Sample Category Title
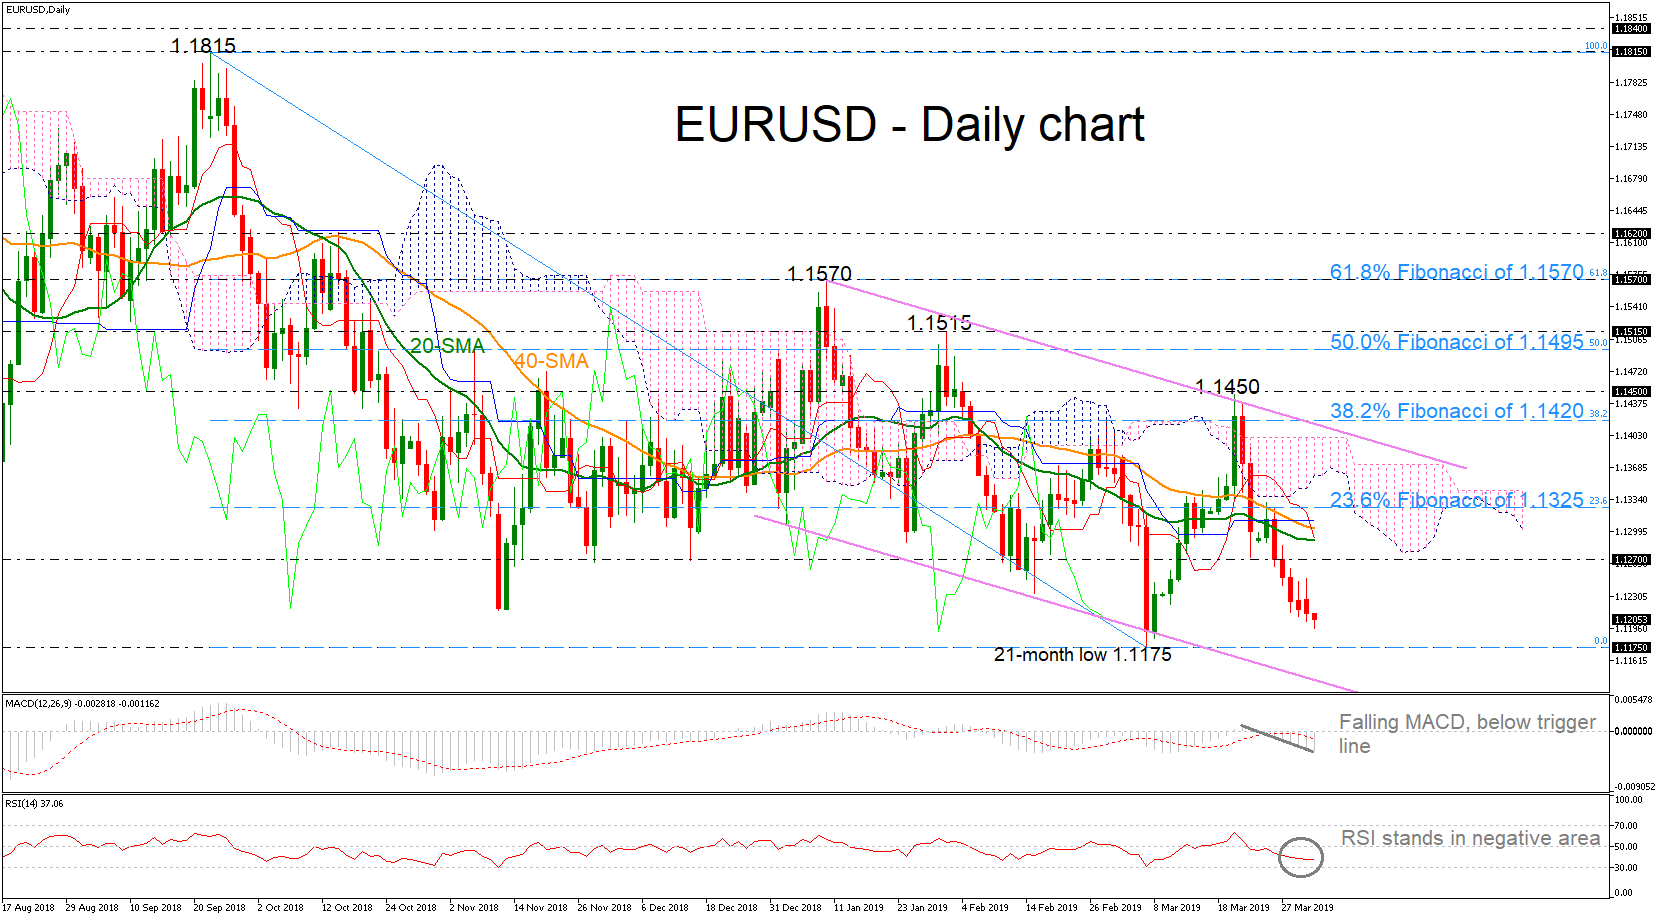
EURUSD Unlocks 1.12 Again, Tumbles To 1-Month Low
EURUSD lost ground in the previous couple of weeks but is still holding above the 21-month low of 1.1175. The world’s most traded pair has been developing within a downward aligned channel over the last three months and recorded a new one-month low of 1.1195.
The sharp bearish rally drove the pair well beneath the Ichimoku cloud and the 20- and 40-simple moving averages (SMAs) in the daily timeframe, re-entering the 1.1200 area. The technical indicators are feeding prospects for a possible negative trading; the RSI stands in the bearish territory with weak momentum, while the MACD is strengthening its movement below the trigger and zero lines.
If the 1.1200 psychological level proves easy to get through, the spotlight would turn to the 1.1175 barrier. Lower, support could be next found around 1.1115 where the lower boundary of the descending channel is currently positioned. More losses could send the price until the 1.0830 support, identified by the highs on January 2017.
On the other hand, if the negative structure weakens, the price could shift to the upside towards the immediate resistance of 1.1270. On top of that, the bulls would need to clear the SMAs to push the rally towards the 23.6% Fibonacci retracement level of the downleg from 1.1815 to 1.1175, around 1.1325. Above that zone, the upper boundary of the channel could come in focus near the 38.2% Fibonacci of 1.1420.
In the medium-term picture, a dive beneath 1.1175 would bring the bearish outlook into play again.
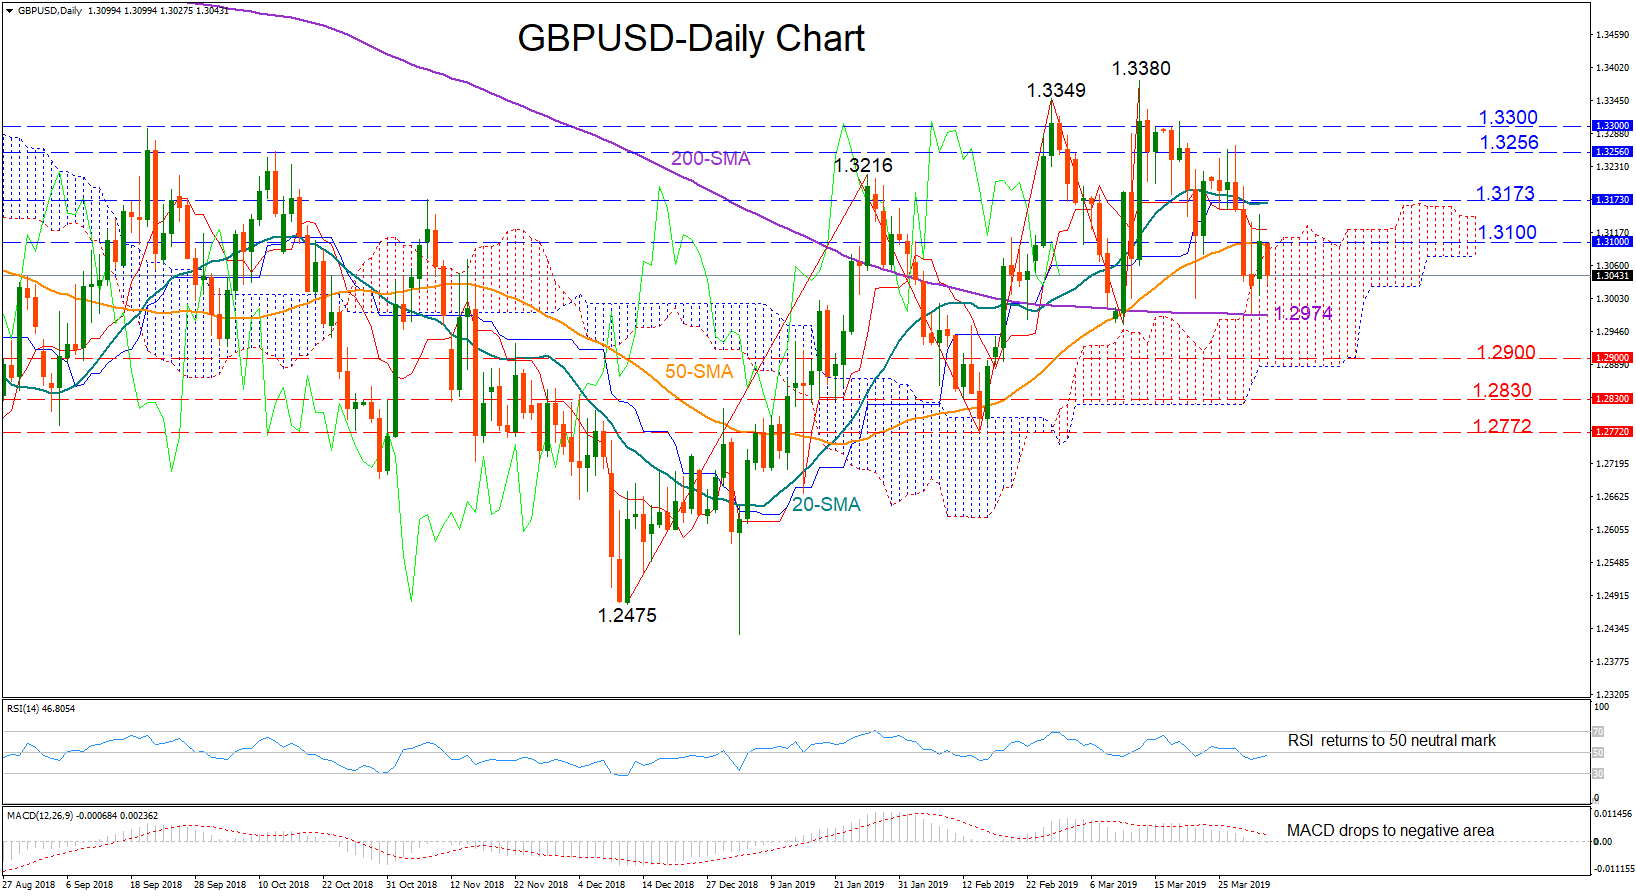
GBPUSD Faces Neutral-To-Bearish Risk In Short Term
GBPUSD returned to the downside on Tuesday after Monday’s closing above 1.31. The RSI is suggesting neutral trading in the short term as the index is curving up to reach its 50 neutral mark. Yet with the MACD stepping into the negative territory, the risk could be skewed to the downside.
The 200-day moving average currently at 1.2974 could act as immediate support if negative momentum accelerates. If the line proves a weak obstacle, the 1.2900 psychological level could be the next level to watch before attention shifts to the 1.2830 congested region. Further down, a slip below the February 14 low of 1.2772 could stage a bigger sell-off.
On the flip side, a reversal to the upside could retest the 1.31 round level, while higher the bullish action may pause between 1.3173 and 1.3256 identified by the peaks on November 7 and October 12 respectively. Should the rally continue, the 1.33 level could be the door for a full recovery.
Meanwhile in the medium-term, the pair is still holding a positive status thanks to the higher highs and higher lows registered over the past three months. Any decline below 1.28 could feed speculation that the upward pattern is nearing an end.
In brief, GBPUSD looks neutral-to-bearish in the short term, while in the medium-term the market maintains a bullish profile.
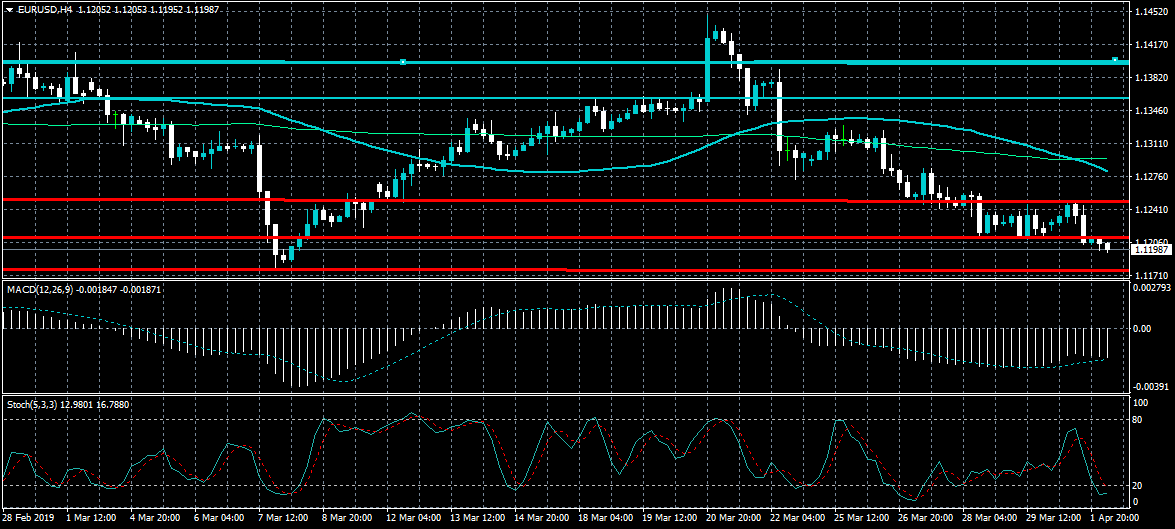
EURUSD 1.1170 Breakout Support
The euro currency is under heavy selling pressure against the US dollar on Tuesday after the pair was strongly rejected from the 1.1250 resistance level. Intraday technical selling will likely increase in the EURUSD pair if bears can force price below the 1.1170 support level. Traders should note that the head and shoulders pattern on the four-hour time frame has a downside projection of close to three-hundred points.
The EURUSD pair is heavily bearish while trading below the 1.1216 level, key technical support is found at the 1.1170 and 1.1130 levels.
If the EURUSD pair trades above the 1.1250 level, bulls may test back towards the 1.1290 and 1.1310 resistance levels.
LTCUSD $52.00 Key Weekly Support
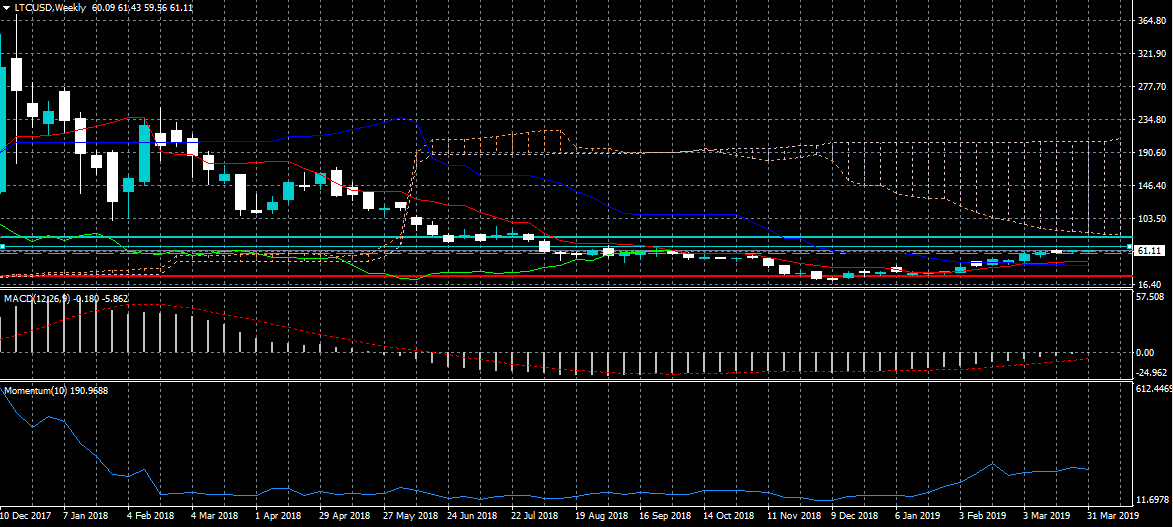
Litecoin is once trading close to the $60.00 resistance level as the fifth largest cryptocurrency by market capitalization remains trapped within a tight $10.00 price range. The $52.00 level is now key weekly support if bears start to take control of the LTCUSD pair. If bulls can break above the $60.00 level the $80.00 level offer the strongest form of weekly technical resistance.
If the LTCUSD pair fails around the $60.00 level, sellers may test towards the $52.00 and $40.00 support levels.
If the LTCUSD pair fails around the $60.00 level, key resistance is found at the $68.00 and $80.00 levels.
USDJPY Turns Bullish
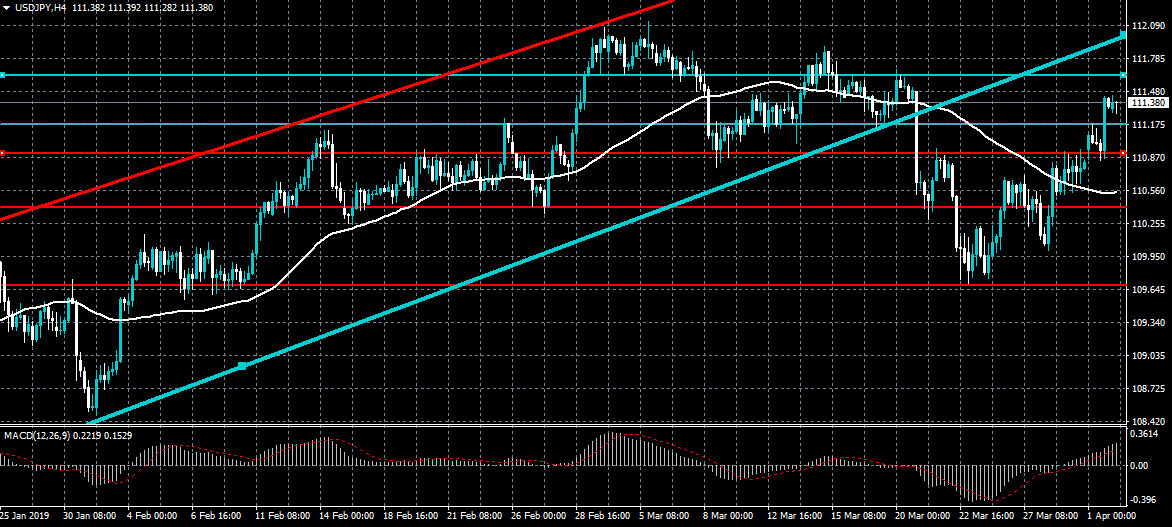
The US dollar continues to advance against the Japanese yen currency on Tuesday as overall risk-sentiment in financial markets continue to improve. The USDJPY pair has now turned bullish, with the 111.68 level critical technical resistance before the 112.00 level. The USDJPY pair will only turn intraday bearish if sellers can once again move price below the pivotal 110.90 support level.
The USDJPY pair is bullish while trading above the 110.90 level, key resistance is found at the 111.68 and 112.00 levels.
If the USDJPY pair falls under the 110.90 level, sellers may test towards the 110.66 and 110.40 support levels.
Aussie Falls After A Dovish Statement From RBA
The Australian dollar declined after the central bank released its interest rates decision. As expected, the bank left interest rates unchanged and expressed worries about the slowing economy. The bank said it expects the economy to grow by a slower rate this year. It blamed this on a few things, such as the softening housing market and the drought that has been in some parts of the country. These issues will be offset by more public spending. Regarding inflation, the bank said that conditions remain low and stable but are expected to pick up gradually over the next couple of years. Inflation is expected to be 2% this year and 2.5% in 2020. In the near term, inflation is likely to decline due to low petrol prices.
Deadlock in the UK Parliament continued in overnight trading. Members failed to pass the so-called indicative votes as signs of more divisions in Theresa May’s cabinet emerged. The option currently gaining most support is for Britain to leave the EU while remaining in the customs union. This motion lost by just three votes. Today, Theresa May is expected to hold a five-hour cabinet meeting as she considers the next step on her own plan which has already been rejected three times.
Traders will focus on a stream of data from the US and Europe. In Switzerland, the headline CPI is expected to remain unchanged at 0.6%. In the UK, the construction PMI is expected to improve slightly to 49.8, from last month’s 49.5. In the European Union, the PPI for February is expected to climb slightly by 3.1%. In the United States, the total vehicle sales are expected to rise to 16.7 million while the core durable goods orders are expected to rise by 0.3%.
EUR/USD
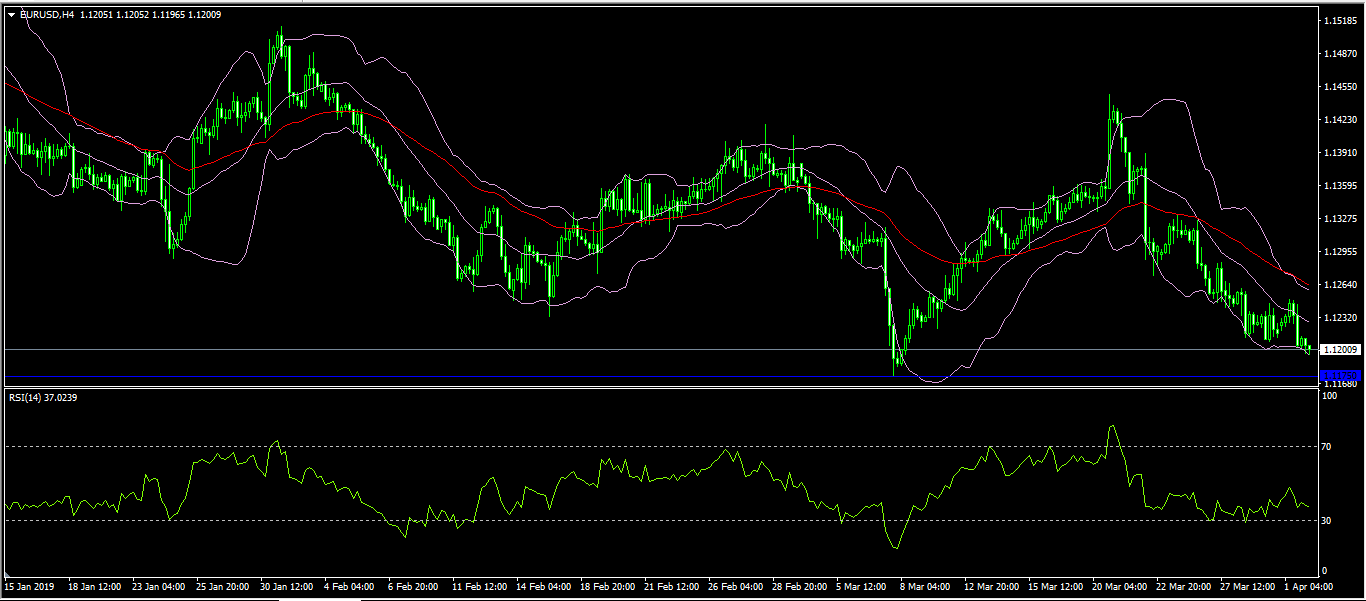
After yesterday’s pause, the EUR/USD pair moved lower in overnight trading. The pair reached a low of 1.1200, which is along the lowest line of the Bollinger Bands. It is also close to the important support of 1.1175. On the hourly chart, this price is below the 50-day moving averages. The RSI has moved slightly lower. The pair will likely continue moving lower, with the next important point to watch being the 1.1175 level.
GBP/USD
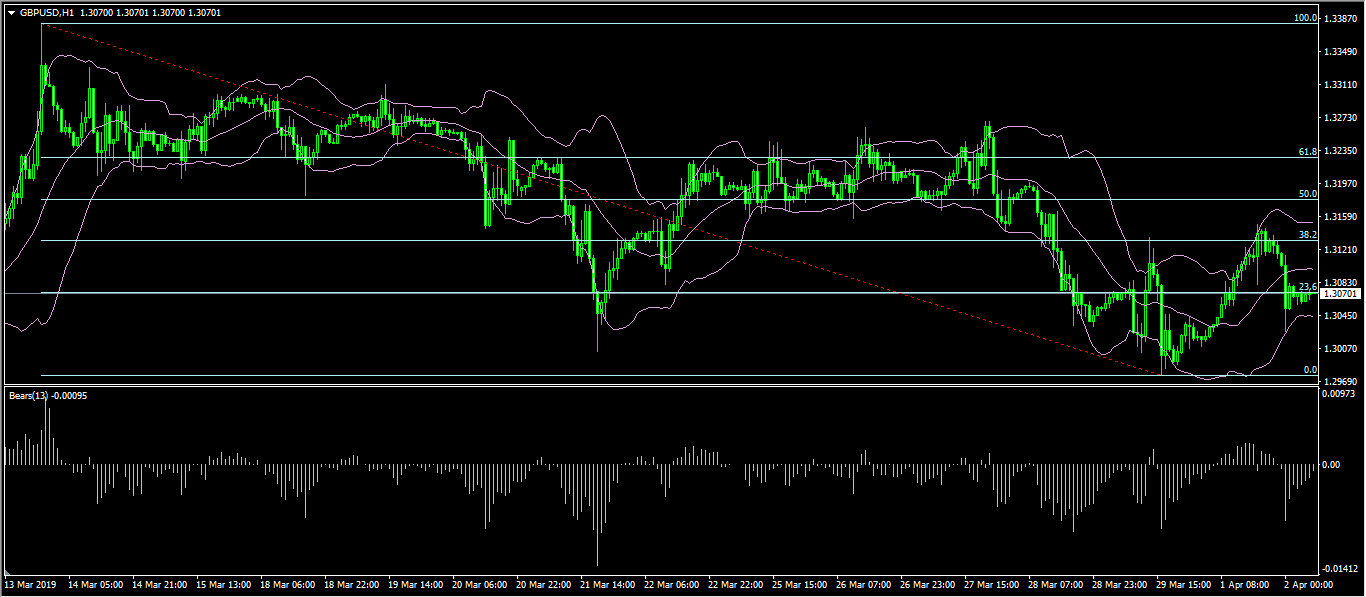
Sterling declined after the UK Parliament failed to pass any of their Brexit options. The GBP/USD pair declined to a low of 1.3025. It is now trading at the 1.3070 level, which is along the 23.6% Fibonacci Retracement levels and along the middle line of the Bollinger Bands. As the pair stabilized, the Bears Power indicator moved closer to the neutral level. The pair will likely continue to be more volatile as Brexit confusion continues.
AUD/USD
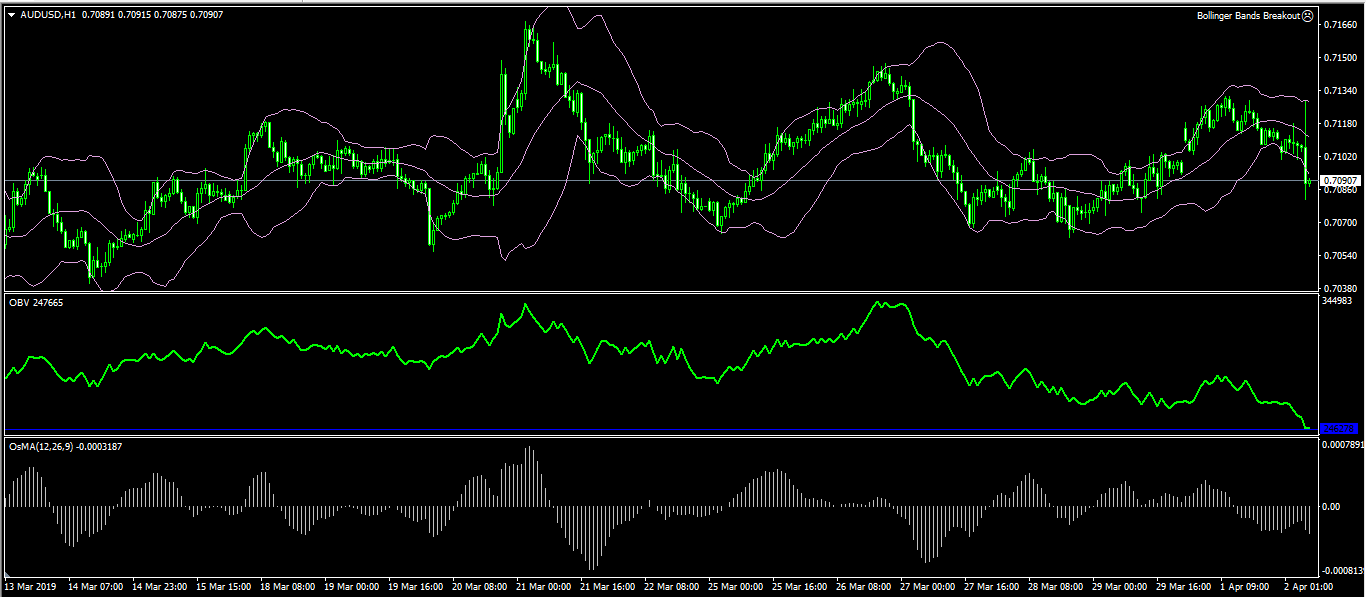
The Australian dollar declined sharply after the slightly dovish statement by the RBA. The AUD/USD pair declined to a low of 0.7080, which was the lowest level since last Friday. On the hourly chart, the On-Balance Volume declined sharply to the lowest level this year. The price is along the lower line of the Bollinger Bands while the moving average oscillator continued to declined. The pair will likely continue to decline until it tests the important support of 0.7050.
GBP/JPY Daily Outlook
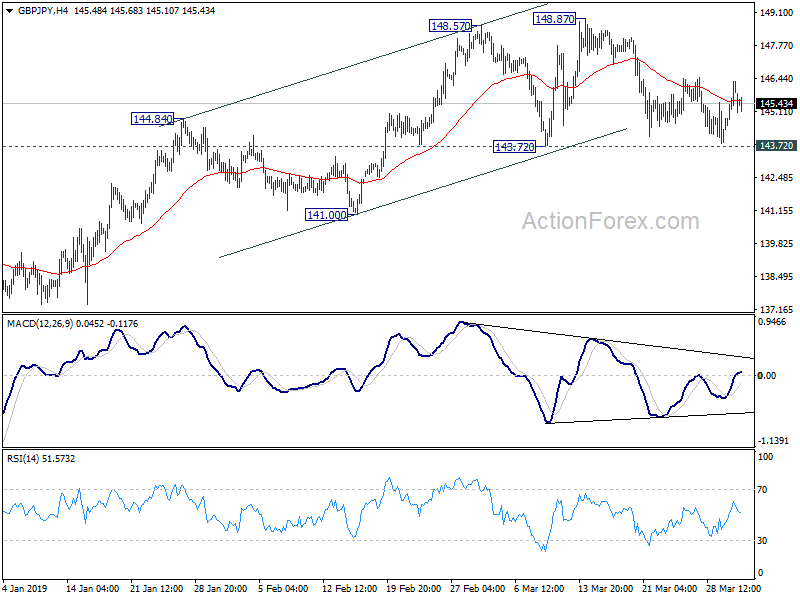
Daily Pivots: (S1) 144.80; (P) 145.57; (R1) 146.74; More...
Intraday bias in GBP/JPY remains neutral as consolidation from 148.87 is in progress. For now, as long as 143.72 support holds, further rise is in favor. On the upside, decisive break of 149.48 key resistance will carry larger bullish implication and target 156.58 resistance next. However. sustained break of 143.72 will indicate near term reversal, after rejection by 149.48 key resistance. In that case, intraday bias will be turned to the downside for 141.00 support first.
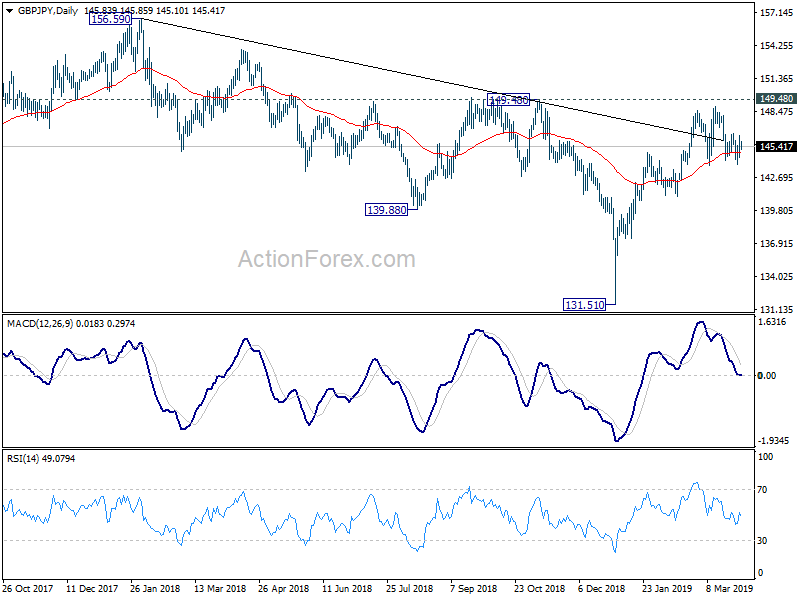
In the bigger picture, focus is now staying on 149.98 key resistance. Decisive break there should confirm that medium term fall from 156.59 (2018 high) has completed at 131.51 already. Rise from 131.51 is then seen as the third leg of the corrective pattern from 122.36 (2016 low). GBP/JPY should then target 156.59 and above. However, rejection by 149.98 will retain medium term bearishness and could extend the fall from 156.59 through 131.51 to 122.36.
EUR/JPY Daily Outlook
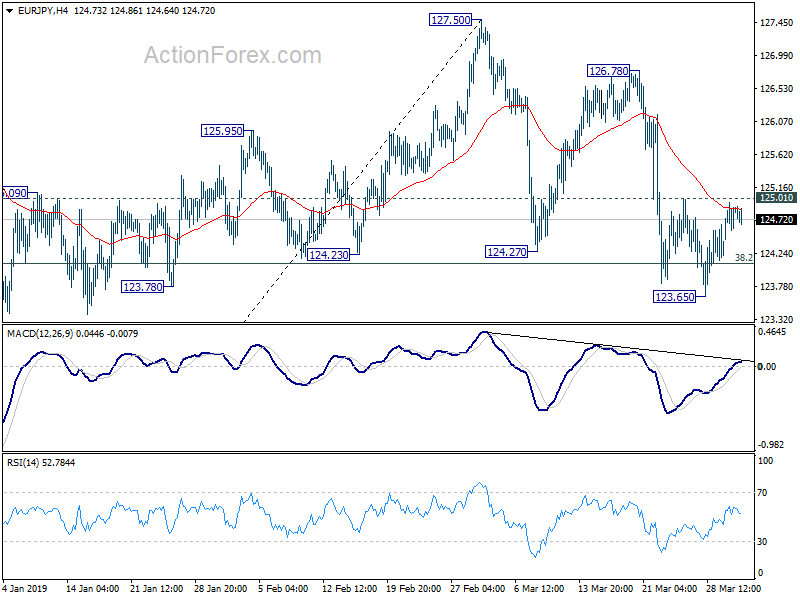
Daily Pivots: (S1) 124.55; (P) 124.75; (R1) 125.06; More....
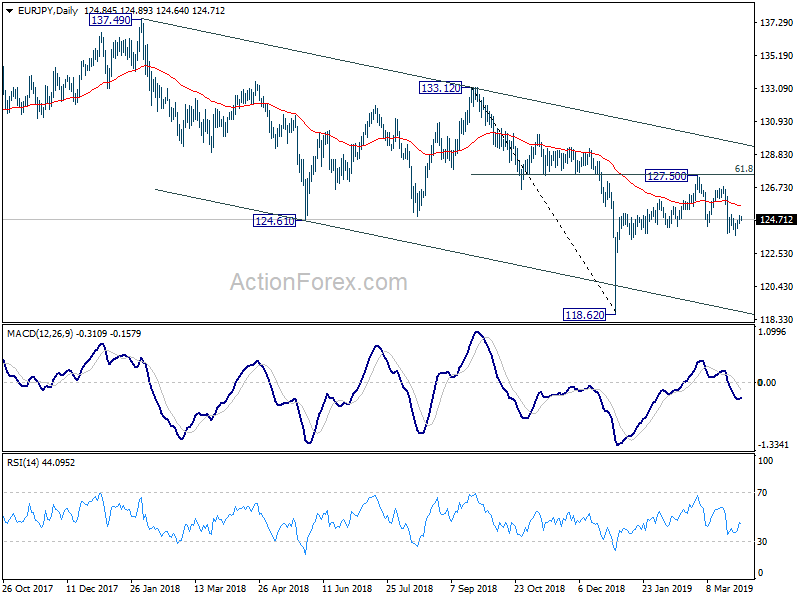
Intraday bias in EUR/JPY remains neutral and further decline is expected. Break of 123.65 will resume the fall from 127.50 for 61.8% retracement of 118.62 to 127.50 at 122.01. However, break of 125.01 will turn bias back to the upside for 126.78/127.50 resistance zone.
In the bigger picture, rebound from 118.62 might have completed earlier than expected at 127.50. EUR/JPY is held well inside medium term falling channel, and below 55 week EMA (now at 127.73). That is, the down trend from 137.49 (2018 high) might still be in progress. Break of 118.62 will target 109.03/114.84 long term support zone. On the upside, however, break of 127.50 will extend the rebound from 118.62 to 133.12 key resistance instead.
EUR/GBP Daily Outlook
Daily Pivots: (S1) 0.8509; (P) 0.8570; (R1) 0.8616; More...
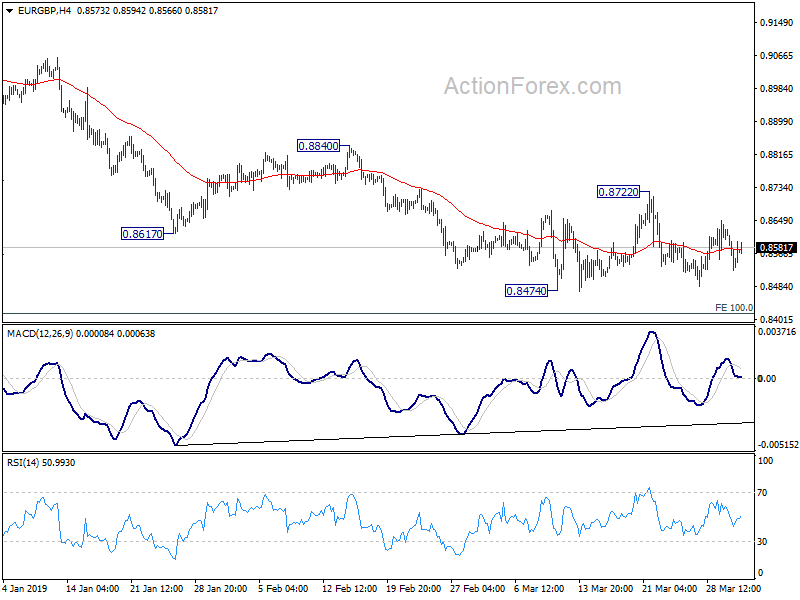
No change in EUR/GBP's outlook as consolidation form 0.8474 is extending. Intraday bias remains neutral first. Near term outlook remains bearish as long as 0.8722 resistance holds. On the downside, break of 0.8474 will resume larger down trend for 0.8416 long term projection next. On the upside, though, break of 0.8722 will resume the rebound from 0.8474 to 0.8840 resistance first.
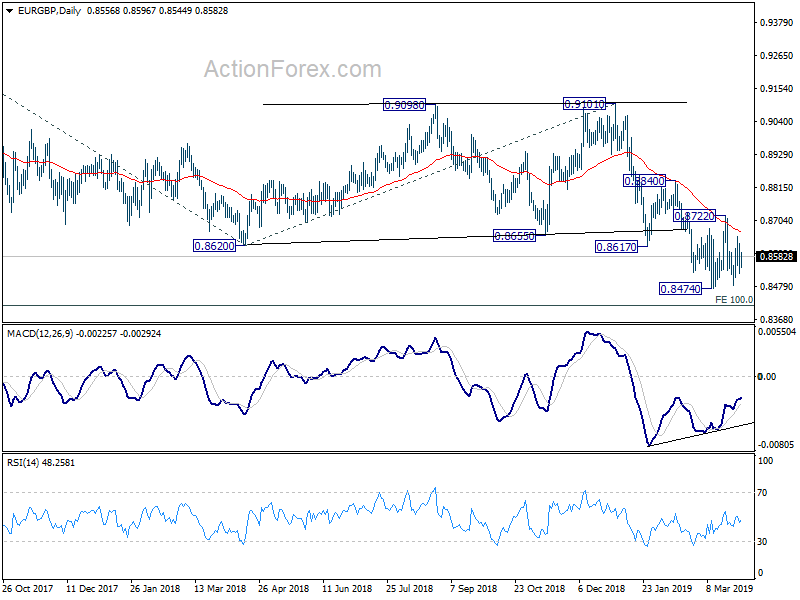
In the bigger picture, EUR/GBP is seen as staying in long term range pattern started at 0.9304 (2016 high). Current fall from 0.9305 (2017 high), is a falling leg inside the pattern. Such decline could extend to 100% projection of 0.9305 to 0.8620 from 0.9101 at 0.8416 and possibly below. But for now, we'd expect strong support around 0.8312 support to contain downside and bring rebound.
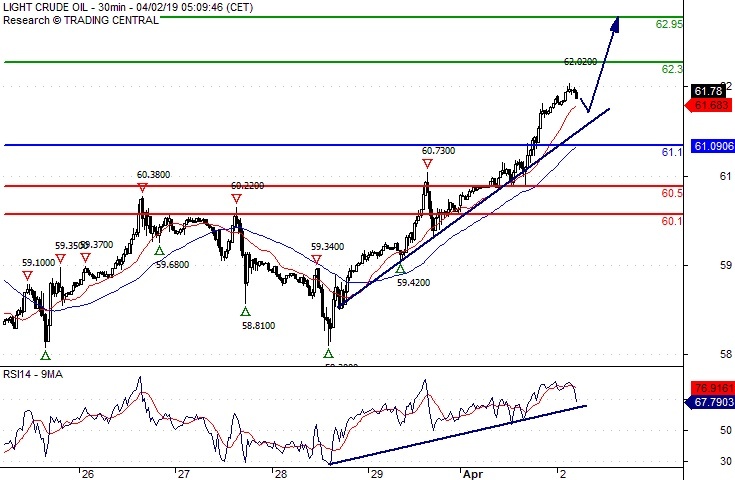
Crude Oil Supported By A Rising Trend Line
Pivot (invalidation): 61.10
Our preference Long positions above 61.10 with targets at 62.30 & 62.95 in extension.
Alternative scenario Below 61.10 look for further downside with 60.50 & 60.10 as targets.
Comment The RSI advocates for further advance.