

Sample Category Title
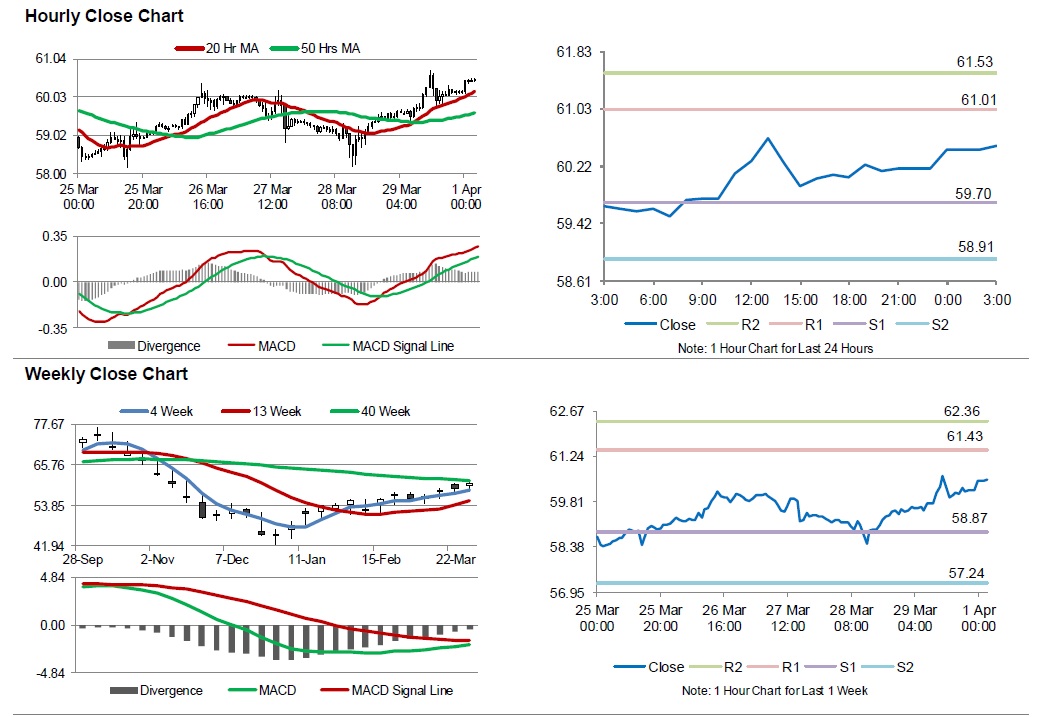
Crude Oil: Oil Extends Its Gains In The Asian Session
For the 24 hours to 23:00 GMT, Crude Oil rose 1.21% against the USD and closed at USD60.15 per barrel on Friday, after Baker Hughes reported that US oil rig count fell for a second consecutive week by 8 to 816 last week.
In the Asian session, at GMT0300, the pair is trading at USD60.50, with oil trading 0.58% higher against the USD from Friday’s close, amid tightening global crude oil market, following OPEC-led supply cuts and US sanctions on Iran and Venezuela.
The pair is expected to find support at 59.70, and a fall through could take it to the next support level of 58.91. The pair is expected to find its first resistance at 61.01, and a rise through could take it to the next resistance level of 61.53.
Crude oil is trading above its 20 Hr and 50 Hr moving averages.
Japan Tankan large manufacturing dropped to 12, lowest since 2017, large fall since 2012
Japan Tankan large manufacturing index dropped to 12 in Q1, down from 19 and even missed expectation of 13. That's also the lowest level since March 2017. The quarterly decline was sharpest since 2012. Large non-manufacturing index dropped to 21, down from 24 and missed expectation of 22. It's also the lowest level since March 2017.
Large manufacturing outlook also dropped to 8 down from 15 and missed expectation of 13. Large non-manufacturing outlook was unchanged at 20, matched expectations. All industry capex rose 1.2% in Q1, suggesting large firms expect to increase capital expenditure by a mere 1.2% in the year that begins in April. It's sharply lower than prior 14.3% but beat expectation of 0.8%.
The overall set of numbers are weak, suggesting worsening outlook and deeper slowdown in the Japanese economy. Down the road, if the trend continues, BoJ might be force to re-evaluate its own monetary policy.
GBP/USD And USD/CAD At Risk Of More Losses
GBP/USD declined sharply below the 1.3165 and 1.3085 support levels. USD/CAD also declined recently and broke the key 1.3400 support level to move into a bearish zone.
Important Takeaways for GBP/USD and USD/CAD
- The British Pound failed to clear the 1.3260 resistance and later declined below 1.3100.
- There is a major bearish trend line formed with resistance near 1.3055 on the hourly chart of GBP/USD.
- USD/CAD faced a strong resistance near 1.3445 and later declined below 1.3400.
- The pair broke a key bullish trend line with support at 1.3048 on the hourly chart to move into a bearish zone.
GBP/USD Technical Analysis
The British Pound traded nicely above the 1.3200 level this past week against the US Dollar. The GBP/USD pair made a few attempts to gain strength above the 1.3260 resistance area, but it failed and later declined below the 1.3200 support area.
There was a strong decline and the pair broke the 1.3165 and 1.3085 support levels. There was even a close below the 1.3085 level and the 50 hourly simple moving average. A swing low was formed near 1.2979 on FXOpen.
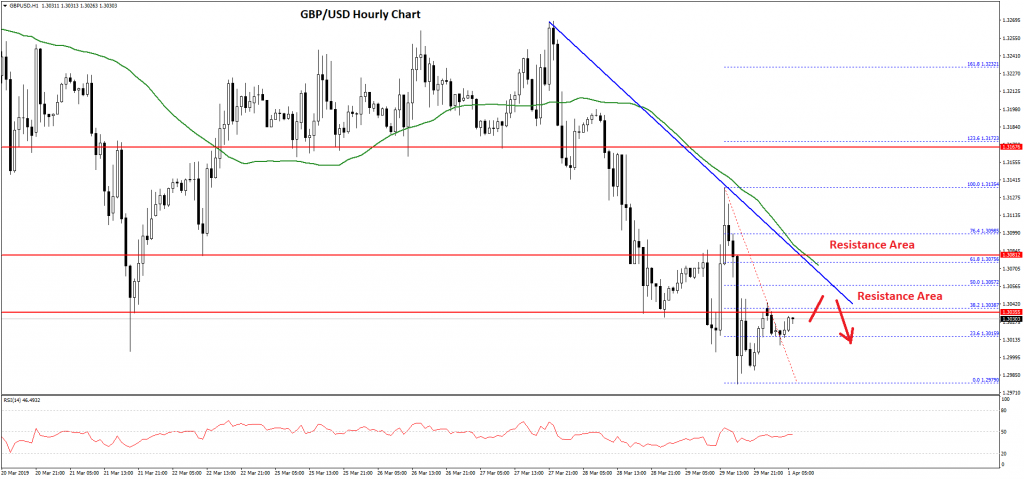
The pair is currently correcting higher and it recently traded above the 23.6% Fib retracement level of the last decline from the 1.3135 high to 1.2979 low. On the upside, there are many hurdles near the 1.3060 level and the 50 hourly simple moving average.
There is also a major bearish trend line formed with resistance near 1.3055 on the hourly chart of GBP/USD. The trend line is close to the 50% Fib retracement level of the last decline from the 1.3135 high to 1.2979 low.
Therefore, if the pair corrects higher, it is likely to face a lot of sellers near the 1.3055 and 1.3060 resistance levels. The next key resistance is near the 1.3085 level, the previous support level.
On the downside, an immediate support is at 1.3000, followed by the 1.2975 support. Any further losses may push the pair below the 1.2950 support level in the near term.
USD/CAD Technical Analysis
The US Dollar remained in a strong uptrend above the 1.3400 support level against the Canadian Dollar. However, the USD/CAD pair faced a strong resistance near the 1.3445 and 1.3450 levels.
As a result, there was a strong bearish reaction below the 1.3400 and 1.3380 support levels. The pair even settled below the 1.3365 level and the 50 hourly simple moving average. It tested the 1.3340 support level and traded as low as 1.3341.
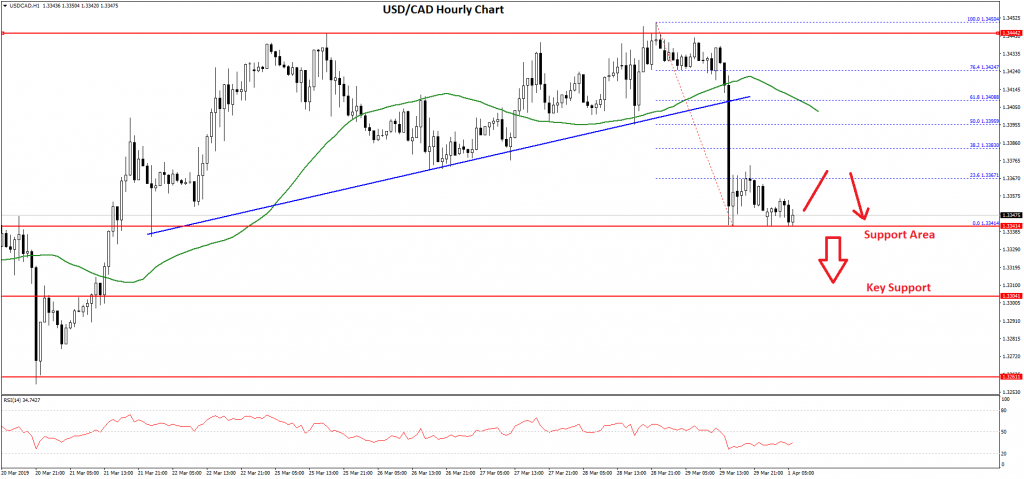
It is currently consolidating losses and it recently tested the 23.6% Fib retracement level of the last decline from the 1.3450 high to 1.3341 low.
If there is an upside correction, the pair could test the 1.3400 resistance zone, where sellers are likely to emerge. It coincides with the 50% Fib retracement level of the last decline from the 1.3450 high to 1.3341 low.
On the downside, an initial support is near the 1.3340 level, below which there is a risk of a sharp drop. The pair could trade towards the 1.3300 support area, which is also a pivot area and a strong buy zone for buyers in the near term.
Japan PMI manufacturing finalized at 48.9, worst quarterly performance since 2016
Japan PMI manufacturing was finalized at 49.2 in March, up[ from February's 48.9, signalling slowdown continues. Markets noted that demand remains sluggish, pulling output lower. Firms push resources to clearing backlogs due to lack of new work. And business confidence remains among lowest on record.
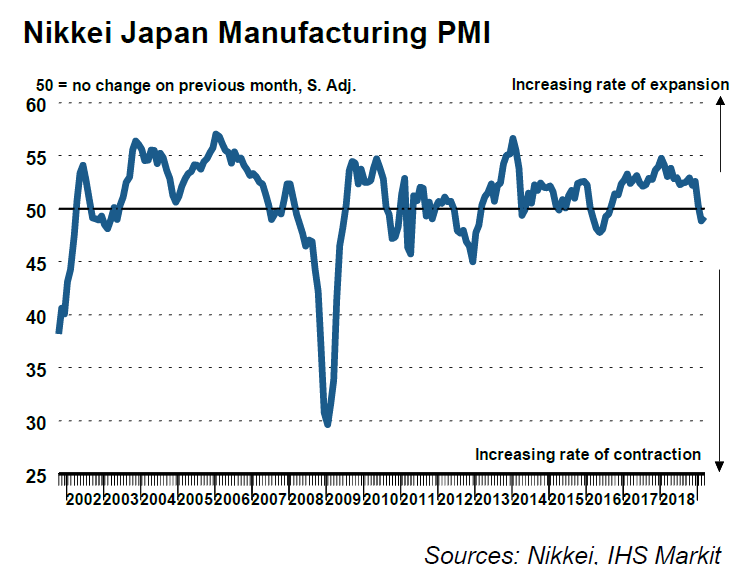
Commenting on the Japanese Manufacturing PMI survey data, Joe Hayes, Economist at IHS Markit, which compiles the survey, said:
"The final manufacturing PMI print of Q1 for Japan points to the worst quarterly performance in the sector since Q2 2016. The likelihood of the negative trend in output being stymied any time soon appears slim, with demand for goods from both domestic and international sources waning further. Firms cut production at the fastest rate in almost three years and showed reluctance to replace out-going staff, with employment growth at the lowest since late-2016.
"The economic backdrop for the manufacturing sector in Japan remains fiercely challenging. Asian goods producers face headwinds from slowing growth in Europe and China, while global trade risks are yet to be mitigated by a breakthrough in US-Sino relations.
"For the Japanese economy to keep its head above water, the service sector will need to pick up any manufacturing slack, which will hinge on domestic demand pressures sustaining the strength that supported the growth rebound at the end of 2018."
China Caixin PMI manufacturing rose to 50.8, employment expands again after five years
China Caixin PMI manufacturing rose to 50.8 in March, up from 49.9 and beat expectation of 50.0. The reading is back in expansionary region and is the highest since July 2018. Markit noted that production and total new work both increase at quicker rates. Also, employment expands for first time in over five years.
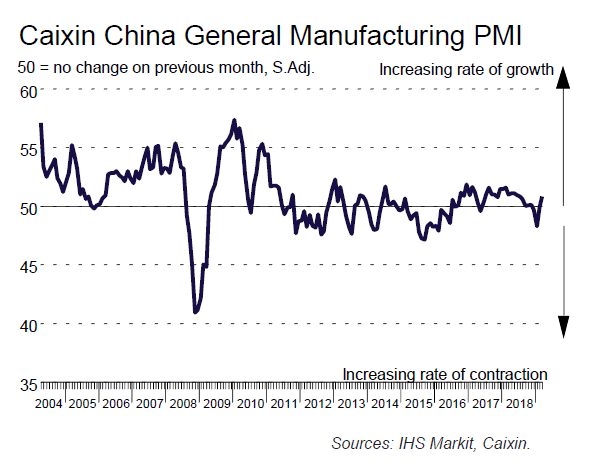
Commenting on the China General Manufacturing PMI™ data, Dr. Zhengsheng Zhong, Director of Macroeconomic Analysis at CEBM Group said:
"The Caixin China General Manufacturing PMI came in at 50.8 in March, up from 49.9 in the previous month, indicating a notable improvement in the manufacturing industry.
"The subindex for new orders climbed to its highest level in four months, and the gauge for new export orders returned to expansionary territory, showing that both domestic and external demand rebounded moderately.
"The output subindex continued to rise in expansionary territory. The employment subindex surged to a high not seen since January 2013. Data from the National Bureau of Statistics showed that the surveyed unemployment rate in urban areas for February was the highest since early 2017, causing concerns about the job market. The situation improved significantly in March, indicating easing pressure on employment.
"The measure for stocks of finished goods rebounded in March from the previous month's near-three-year low, but remained in contractionary territory. The subindex for stocks of purchases returned to expansionary territory, pointing to manufacturers' increasing willingness to restock. The subindex for suppliers' delivery times picked up despite staying below 50, indicating an accelerating capital turnover at companies.
"Both gauges for input costs and output charges edged up in to positive territory, with the latter posting a higher reading than the former, reflecting lower pressure from raw material costs. The producer price index might have risen faster year-on-year in March, and increased month-on-month, compared with a monthly decline in February.
"Overall, with a more relaxed financing environment, government efforts to bail out the private sector and positive progress in Sino-U.S. trade talks, the situation across the manufacturing sector recovered in March. The employment situation improved greatly."
Daily Markets Broadcast
Wall Street indices higher on China data
A sharp rebound in China’s PMI data for March has given risk appetite a jolt in early trading in Asia as growth fears are partly allayed.
US30USD Daily Chart
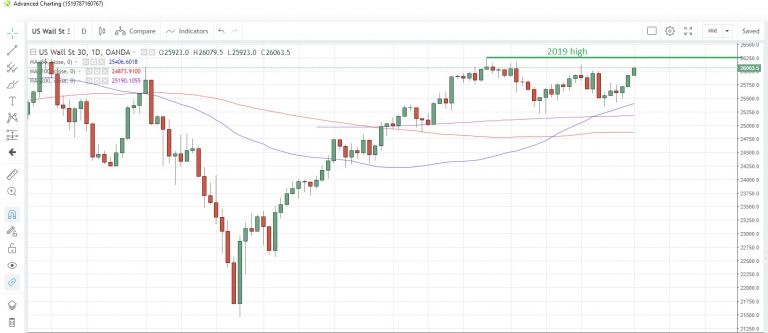
The US30 index looks set for a third straight day of gains as the rebound in the China PMIs builds hopes for the outlook for the Chinese economy, and hence global growth
The index looks set to test last month’s high, with the 2019 high above at 26,041
Tonight we will see if the US manufacturing PMI sees a similar rebound. It’s expected to come in at 54.5 from 54.2 in February.
DE30EUR Daily Chart
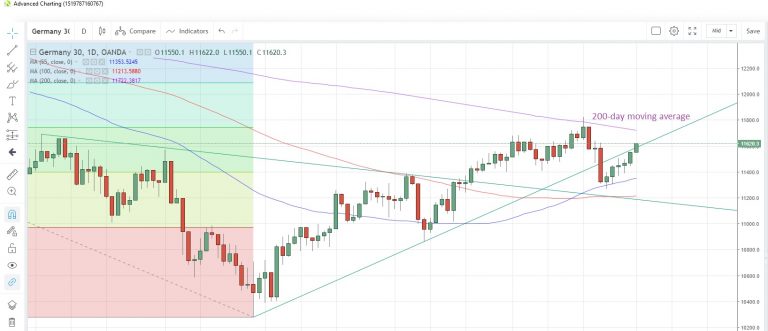
The Germany30 index looks set for a sixth daily advance in a row today after the China data buoys sentiment. The index had its best week in six weeks last week
The index is heading toward 200-day moving average resistance at 11,722. That average has capped prices on a closing basis since July 31
Both German and Euro-zone Markit manufacturing PMIs are not expected to differ from the flash readings of 44.7 and 47.6, respectively.
CN50USD Daily Chart
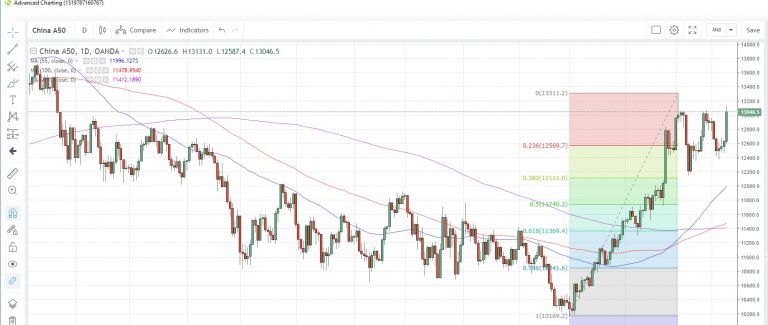
After posting the biggest daily gain in almost a month on Friday, the China50 index could advance further today after the rebound in the PMI numbers
Prices touched a three-week high on Friday and could test the March 4 high of 13,312, which in turn was the highest since March 22, 2018
Data released Sunday showed the manufacturing PMI hitting 50.5, the first time it crossed above the 50 contraction/expansion threshold in five months. The non-manufacturing PMI rebounded to 54.8 from 54.3.
Australia NAB business conditions improved, but confidence dropped
Australia NAB Business Conditions rose 3 pts to 7 in March, beat expectation of 2.On the positive side, employment index rose 2 pts to 7. It remains "well above average, suggesting that for now, survey indicators of labour demand remain favourable." Trading and profitability also rebounded.
However, Business Confidence dropped -2 pts to 0, missed expectation of 4. It also "continued the below average run. "Other forward looking indicators – capacity utilisation and forward orders – showed some improvement but remain at or below average. Also, it's noted that "overall survey measures of prices and inflation remain weak."
Australia AiG PMI dropped to 51, slower pace of expansion
Australia AiG Performance of Manufacturing index dropped -3 pts to 51 in March, indicating slower pace of expansion. Some respondents attributed the down trend since mid-2018 to "general slowing in the economy". Some said their customers are "delaying orders" until after Federal election. Also, downturn in housing construction also affect demand.
EUR/USD Turned Bearish Below 1.1280
Key Highlights
- The Euro started a major decline below the 1.1300 support against the US Dollar.
- EUR/USD traded below key bullish trend lines at 1.1340 and 1.1295 on the 4-hours chart.
- The US Personal Income increased 0.2% in Feb 2019 (MoM), less than the +0.3% forecast.
- The US ISM Manufacturing Index for March 2019 is likely to increase from 54.2 to 54.5.
EURUSD Technical Analysis
This past week, there was a strong decline in the Euro from well above the 1.1300 level against the US Dollar. The EUR/USD pair broke a crucial support near 1.1280 to enter a bearish zone.
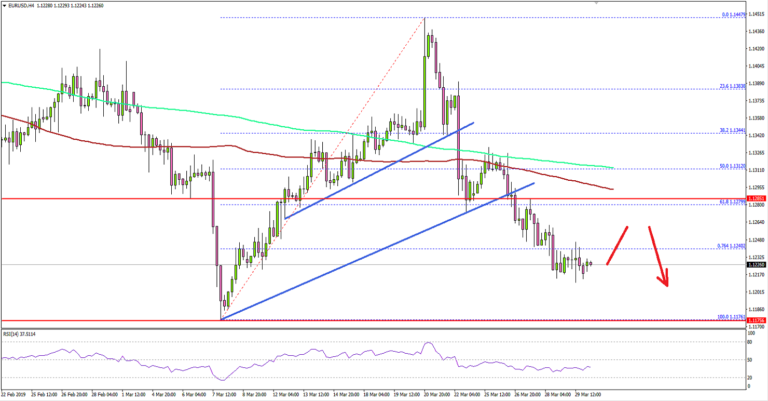
Looking at the 4-hours chart, the pair gained bearish momentum below the 1.1280 support and the 61.8% Fib retracement level of the last wave from the 1.1176 low to 1.1447 high.
The pair traded below the 1.1250 support and settled well below the 200 simple moving average (4-hours, green) and 100 simple moving average (4-hours, red). Besides, there was a close below the 76.4% Fib retracement level of the last wave from the 1.1176 low to 1.1447 high.
Clearly, the pair moved into a strong downtrend and it could decline further towards the 1.1175 support area. If sellers remain in action, the pair could test the 1.1120 support and the 1.236 Fib extension level of the last wave from the 1.1176 low to 1.1447 high.
On the upside, an initial resistance is near the 1.1250 level, above which the pair could test the 1.1280 pivot level and the 100 simple moving average (4-hours, red).
Fundamentally, the US Personal Income report for Feb 2019 was released this past Friday by the Bureau of Economic Analysis, Department of Commerce. The market was looking for an increase of 0.3% in the personal income compared with the previous month.
The actual result was lower than the forecast, as there was a 0.2% rise in the personal income. However, the outcome was positive compared to the last decline of 0.1%.
The report added:
Personal income decreased $22.9 billion (-0.1 percent) in January according to estimates released today by the Bureau of Economic Analysis. Disposable personal income decreased $34.9 billion (-0.2 percent), and personal consumption expenditures increased $8.6 billion (0.1 percent).
Overall, EUR/USD might correct slightly in the short term, but it is likely to face sellers near the 1.1250 or 1.1280 resistance.
Economic Releases to Watch Today
- Germany’s Manufacturing PMI for March 2019 – Forecast 44.7, versus 44.7 previous.
- Spanish Manufacturing PMI for March 2019 – Forecast 49.5, versus 49.9 previous.
- Euro Zone Manufacturing PMI March 2019 – Forecast 47.6, versus 47.6 previous.
- UK Manufacturing PMI for March 2019 – Forecast 51.3, versus 52.0 previous.
- Euro Zone CPI for March 2019 (YoY) (Prelim) – Forecast +1.5%, versus +1.5% previous.
- Euro Zone Core CPI for March 2019 (YoY) (Prelim) – Forecast +0.9%, versus +1.0% previous.
- US ISM Manufacturing Index for March 2019 – Forecast 54.5, versus 54.2 previous.
- US Retail Sales Feb 2019 (MoM) – Forecast +0.3%, versus +0.2% previous.
Market Morning Briefing: Euro-Yen Has Interim Resistance At 125
STOCKS
Global indices like the Dow, DAX which were looking mixed have turned positive now. News on China's PMI entering into the expansion phase have given a boost to the Asian indices - Nikkei and Shanghai. Indian equities can also take cues from them and move higher.
Dow (25928.68, +211.22, +0.82%) has risen breaking above the 21-day moving average (25722) which may now act as a good support. The near-term outlook is positive for a test of the next resistance at 26060, a strong break above which can pave way for a test of 26250. But a pull-back from 26060 can drag the index lower again to 25750 or 25720.
DAX (11526.04, +97.88, +0.86%) has an immediate resistance at 11542 (21-day moving average). A strong break above it can take it higher to 11720 in the near term. But a pull-back from the 21-day moving average resistance can drag the index to 11350 in the coming days.
Nikkei (21679.44, +473.63, +2.23%) has surged breaking above 21400 and has the potential to target 21900-21950 while it sustains above 21500.
Shanghai (3153.98, +63.23, +2.05%) has risen above the key resistance level of 3120. A decisive close above 3120 will mark the end of the sideways consolidation and the resumption of the overall uptrend targeting 3280 in the coming days,
Sensex (38672.91, +127.19, 0.33%), though reflects indecisiveness from Friday's candles looks strong on the weekly charts. Strong support is in the broad 11600 and 11500 region and remains bullish for a rise to 39000 and 39600 in the short term.
Nifty (11623.90, +53.90, +0.47%) has bounced sharply from around its support at 11570 on Friday. The bullish outlook is intact for the index to test 11750 and 11800 in the coming days.
COMMODITIES
Gold looks weak in the near term while silver is mixed and can remain range bound. Copper has gained momentum and can inch further higher. Oil continues to consolidate with a bullish bias.
Gold (1292) has turned weak after last week's sharp fall. As long as it trades below 1300, a fall to 1280 or even 1270 cannot be ruled out in the coming sessions.
Silver (15.15) is getting support from the psychological level of 15. But it needs to breach the immediate resistance at 15.20 to extend the current bounce-back move to 15.35. Inability to breach 15.2 can pull it to 15 again and keep it range bound between 15 and 15.2 for some time. The next support below 15 is at 14.85
Copper (2.95) has surged much higher than our expected level of 2.91 and looks bullish to test 2.97-2.98.
Brent (68) continues to oscillate between 66.5 and 68.5. The bias remains bullish for Brent to break 68.5 and rise to 69.7 and 70 in the near term.
WTI (60.45) can rise to 61.5 and 62 if it sustains above 60. It continues to looks relatively stronger than Brent on the charts. But a dip below 60 can drag it to 58.5.
FOREX
Currencies may trade weak against the US Dollar and may continue for a few sessions.
US Dollar looks strong for the near term. The 3rd vote for the withdrawal agreement for Brexit would be important to watch.
Dollar-Index (97.23) is almost stable above 97. While the index sustains above 97, it could head towards 97.75 on the upside which could act as a decent resistance for the medium term.
While upside scope of testing 97.75 remains on the Dollar Index, Euro (1.1227) could test 1.12/11 on the downside. View is bearish as seen on the 3-day candles.
Euro-Yen (124.81) has interim resistance at 125 and while that holds, there is scope for a fall in the near term towards 124 /123 levels. On a sustained break above 125.00/20, we could expect a possible rise towards 126.
Dollar Yen (111.15) has near term resistance at 111.50 which if holds could push the pair back towards support at 110.50-110.00. Immediate view is bullish with a possible fall in the medium term.
Aussie (0.7125) has risen in the last 2-sessions but could face resistances near 0.7150 and 0.72 respectively. While any of the above hold, Aussie may come off to 0.7050 or lower towards 0.700-0.695 in the medium term.
The Vote on withdrawal agreement on Friday faced rejection and the MPs are scheduled to vote for the other part (political declaration outlining the future relationship with the bloc) today. Pound (1.3030) is looking weak and if it manages to break below immediate support at 1.30, it could turn bearish for the medium term targeting1.29-1.28 levels in the near term.
USDCNY (6.7056) has immediate support at 6.70 which if holds could push the pair back towards 6.74 in the near term. A break below 6.70, if seen could turn bearish where the Yuan could strengthen towards 6.68-6.67 levels.
Dollar-Rupee (69.16) is trading above near term support at 69. While that holds, there is scope of rising towards 69.50 or higher in the near term.
INTEREST RATES
The US yields have bounced well and could now rise in the near term. The 10YR (2.44%), 5Yr (2.27%) and 30Yr (2.84%) have moved up. The 10YR could rise towards 2.46/50% while the 30YR could rise towards 2.90%.
The German-JGB 10Yr (0%) has fallen sharply and unless it recovers from here, it could turn more bearish in the near term towards -0.05% pulling down Euro-Yen to levels of 124-123.
The UK-US 10Yr (-1.45%) has also fallen from resistance near -1.38% and while that holds, the yield spread could fall further towards -1.51% indicating further weakness for the Pound.
The 10YR GOI (7.4858%) is stuck above important support at 7.45%. A break on either side would be crucial.