Sample Category Title
EUR/AUD Weekly Outlook
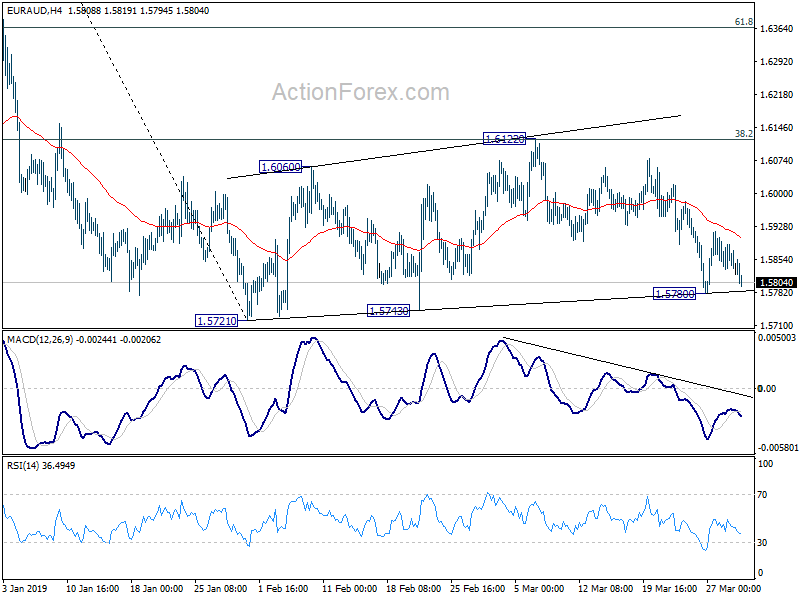
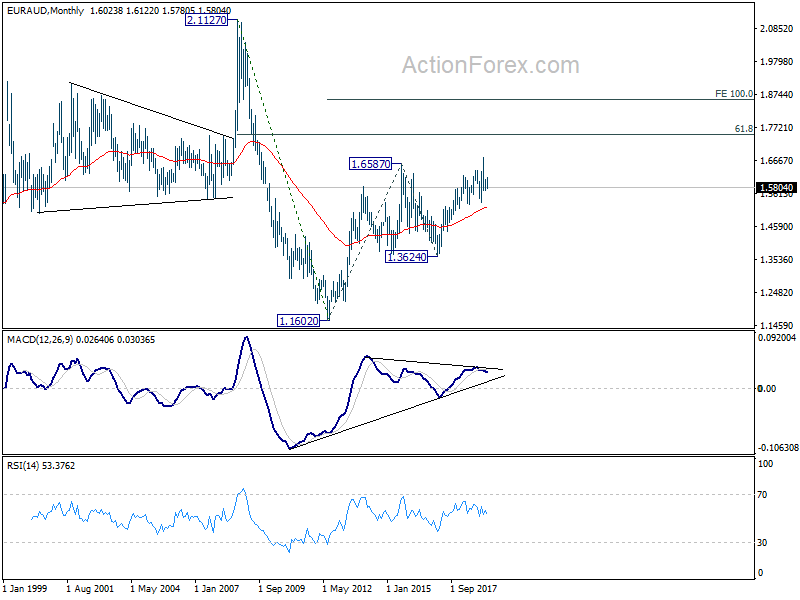
EUR/AUD dropped to as low as 1.5780 last week but recovered well ahead of 1.5721 low. Initial bias remains neutral this week first as consolidation from 1.5721 might extend. On the downside, decisive break of 1.5271 will resume the fall from 1.6765 and target 1.5346 support next. On the upside, in case of another recovery, upside should be limited by 1.6122 resistance.
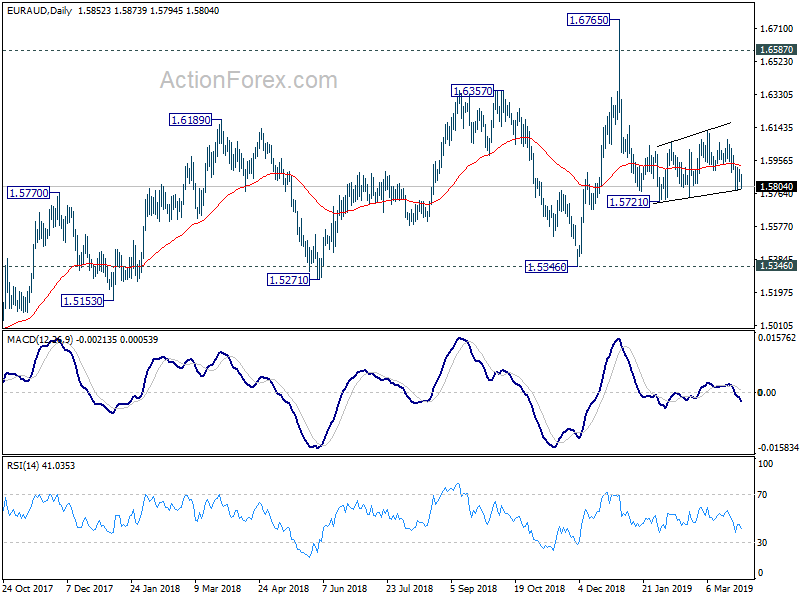
In the bigger picture, as long as 1.5346 support holds, outlook will remain bullish. Uptrend from 1.1602 (2012 low) is expected to resume sooner or later. Break of 1.6765 will target 61.8% retracement of 2.1127 (2008 high) to 1.1602 at 1.7488 next. However, firm break of 1.5346 key support will indicate trend reversal, with bearish divergence condition in weekly MACD, and turn outlook bearish.
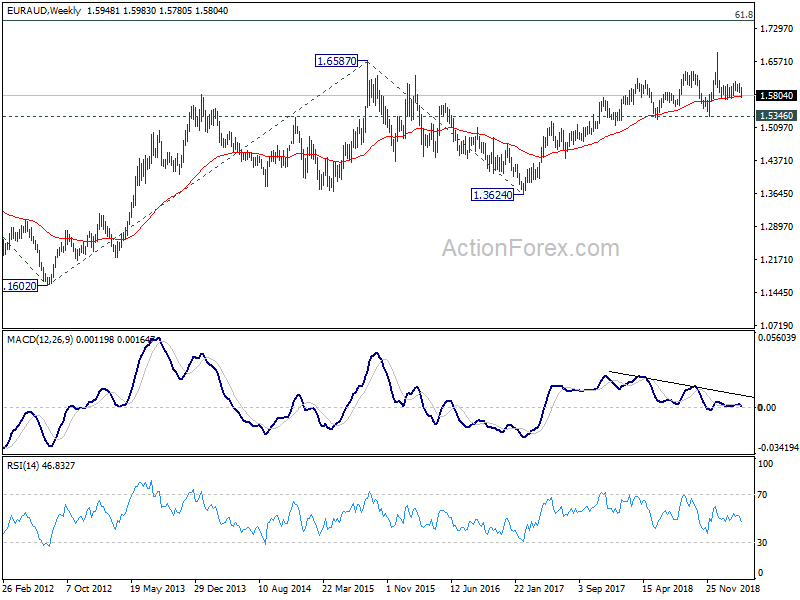
In the longer term picture, the rise from 1.1602 long term bottom (2012 low) is still in progress for 61.8% retracement of 2.1127 to 1.1602 at 1.7488. Firm break there will pave the way to 100% projection of 1.1602 to 1.6587 from 1.3624 at 1.8069. This will remain the favored case as long as 1.5346 remains intact.
EUR/CHF Weekly Outlook
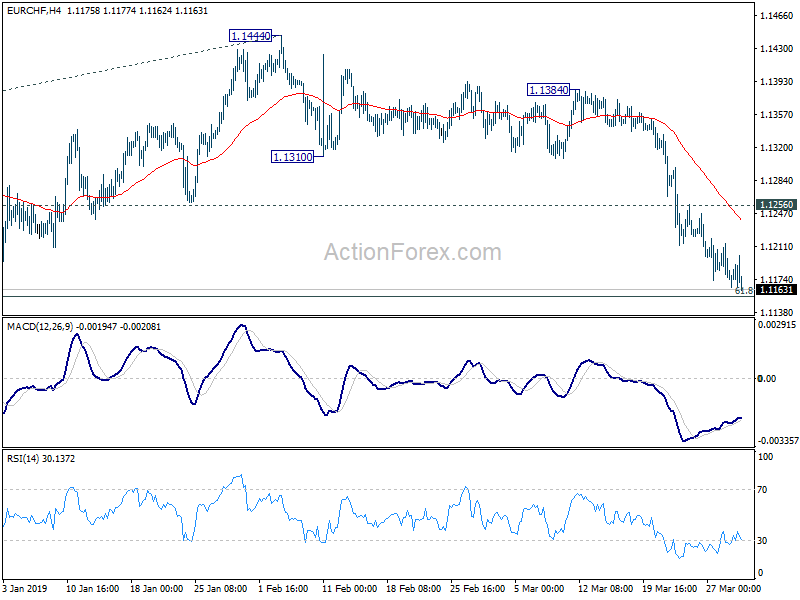
Despite diminishing downside momentum as seen in 4 hour MACD, EUR/CHF dropped further to as low as 1.1163 last week. Break of 1.1173 low should indicate resumption of medium term decline from 1.2555. But decisive break of 1.1154 fibonacci level is needed to confirm. But in any case, further decline is expected this week as long as 1.1256 resistance holds, even in case of recovery. Firm break of 1.1154 will pave the way to 61.8% projection of 1.2004 to 1.1173 from 1.1444 at 1.0930.
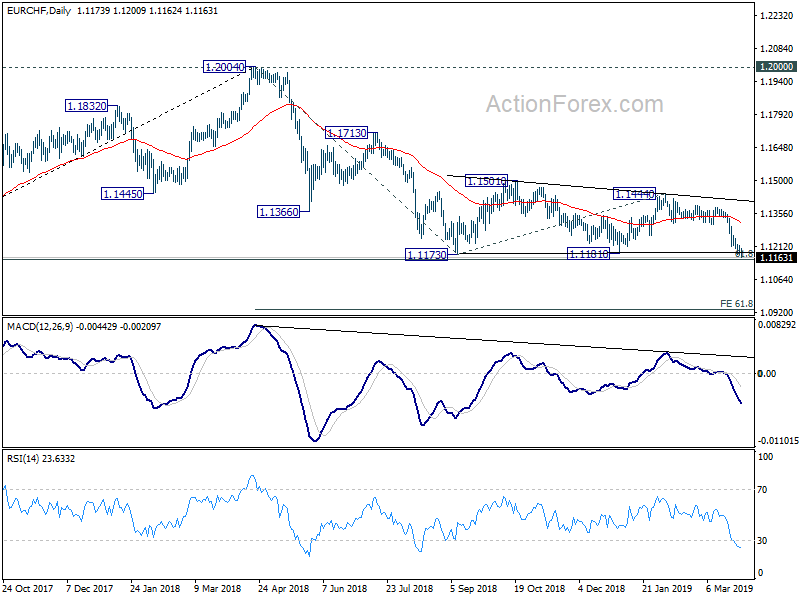
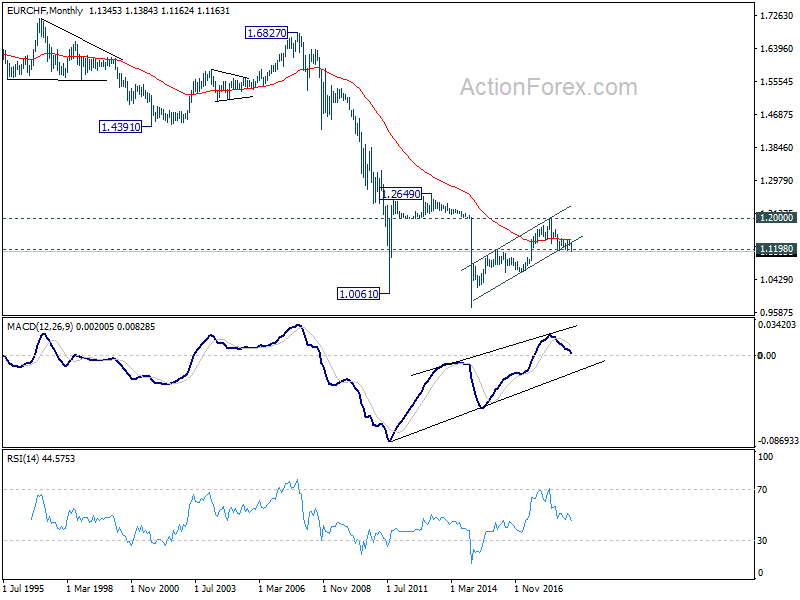
In the bigger picture, multiple rejection by 55 week EMA indicates medium term bearishness. Focus remains on 1.1154/98 support zone (2016 high and 61.8% retracement of 1.0629 to 1.2004 at 1.1154). Decisive break there will confirm resumption of whole down trend from 1.2004 and long term bearish reversal. EUR/CHF should then target 1.0629 support and below. This will now remain the favored case as long as 1.1444 resistance holds.
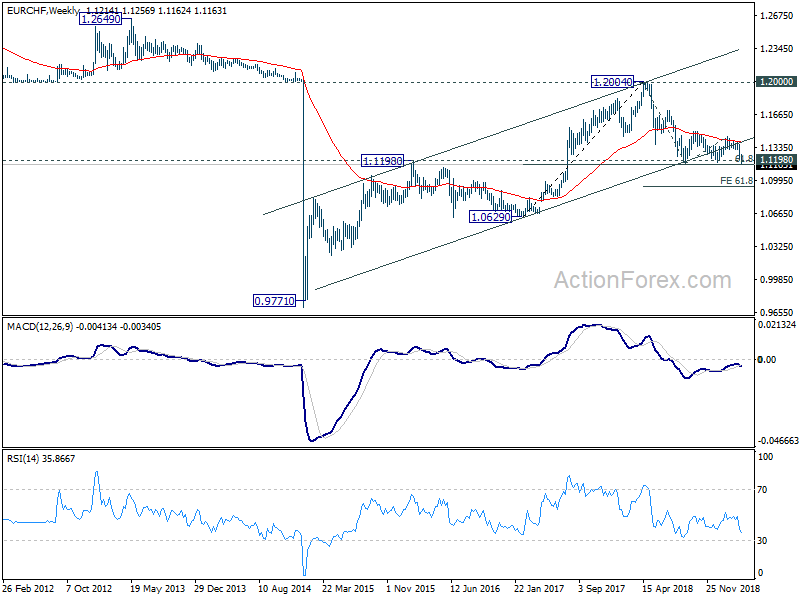
In the long term picture, the current development argues that long term up trend has completed at 1.2004 after rejection of 1.2 key resistance. Sustained break of 1.1198 support will confirm this bearish case and target 1.0629 and below.
Risk Aversion to Come Back in Q2 as Stocks and Yields Recouple
Intensifying recession fear was the main theme in the markets in March, alongside never-ending Brexit and trade tensions. With downside risks to growth starting to materialize, major global central banks started their dovish turns. Most notably, Fed now forecasts no rate hike this year. ECB will keep interest rates unchanged at least through the end of the year, and downgraded economic forecasts. BoC dropped tightening bias. And RBNZ has just indicated last week that next move is a cut.
Bond yields tumbled sharply globally. More importantly, 3-month to 10-yield yield, the most accurate predictor of US recession, inverted for a short period of time. However, the negative sentiments were no so much reflected in the stock markets. In March, DOW closed the month up 0.05%. S&P 500 rose 1.79% while NASDAQ rose 2.61%. In Europe, even after terribly poor Germany manufacturing data, DAX closed the move up 0.09%. CAC was boosted by China Airbus deal and rose 2.10%. FTSE also rose 2.89%. Nikkei was the sole major index that closed down -0.84%. China Shanghai SSE rose 5.09%. Hong Kong HSI rose 1.46% and Singapore Strait Times rose 0.01%.
To us, it's just a matter of time stocks and bond markets align back together. Considering the technical picture of major indices, while more upside cannot be ruled out in the near term, reversals are likely around the corner, in particular in Nikkei. Upcoming March and April data should reveal more about the underlying development in the economies. It will likely be a rough ride for investors in Q2. For forex traders, should risk aversion dominates, there are prospects for more upside in Dollar and Yen.
In the currency markets, Sterling was the worst performing one last week after the Parliament rejected the Brexit Withdrawal Agreement again while disapproving all other alternatives. Without any deal, Brexit deadline is now set at April 12. UK has just around two weeks time to decide how they'd like to move forward, a long delay, referendum, general election, or even just leave with no-deal. New Zealand Dollar was the second weakest after RBNZ indicates that next move is a cut.
Meanwhile, Canadian Dollar was the strongest one last week after strong January GDP data. WTI crude oil also extended recent uptrend to as high as 60.72, ignoring verbal intervention by Trump. Australian Dollar was surprisingly the second strongest. It's partly supported by buying in AUD/NZD, and partly by resilience in Chinese stocks. However, Aussie could be vulnerable this week if RBA hints on a rate cut earlier than expected.
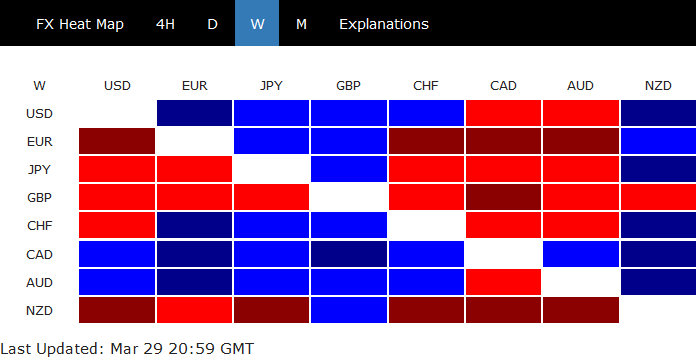
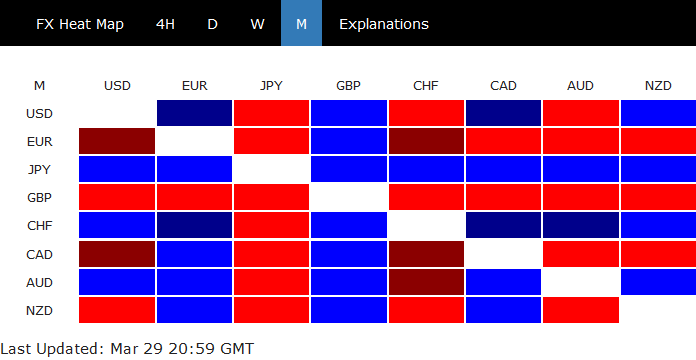
For the month, Yen and Swiss Franc are the strongest, followed by Aussie. Sterling was the weakest, followed by Euro and Canadian.
Recession fears clearly reflected in bond markets
Pessimistic sentiments were clearly reflected in safe haven flow into bonds globally. German 10-year yield hit as high as 0.278 in January and opened March at around 0.20. 10-year bund yield then turned negative in March to close at -0.069. Japan 10-year yield also hit as high as 0.047 in January, then gyrated down to -0.090 on Friday.
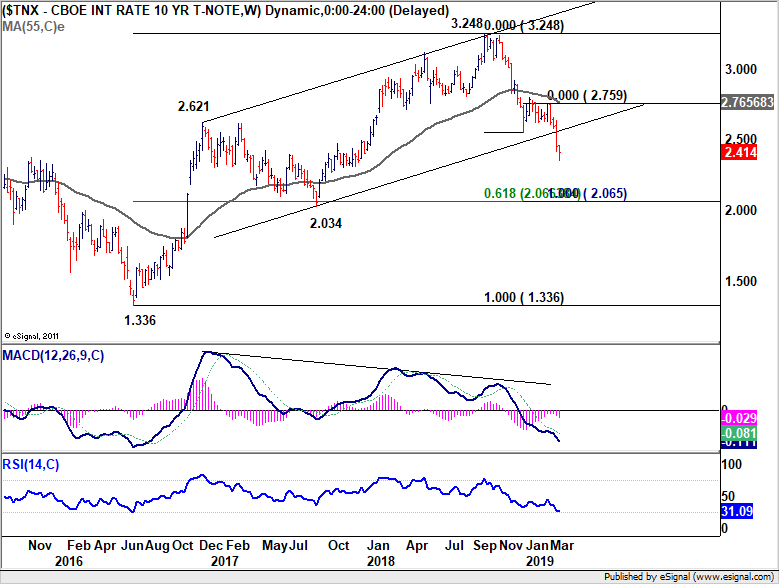
US 10-year yield also suffered steep decline after Fed turned dovish in the month. TNX hit as low as 2.356 last week before recovering to close at 2.414. There seems to be some support from 61.8% projection of 3.248 to 2.554 from 2.759 at 2.330. And some consolidations might be seen in near term. But firm break of 2.554 support turned resistance is needed to confirm short term bottoming. Otherwise, the decline from 3.248 is expected to resume sooner or later.
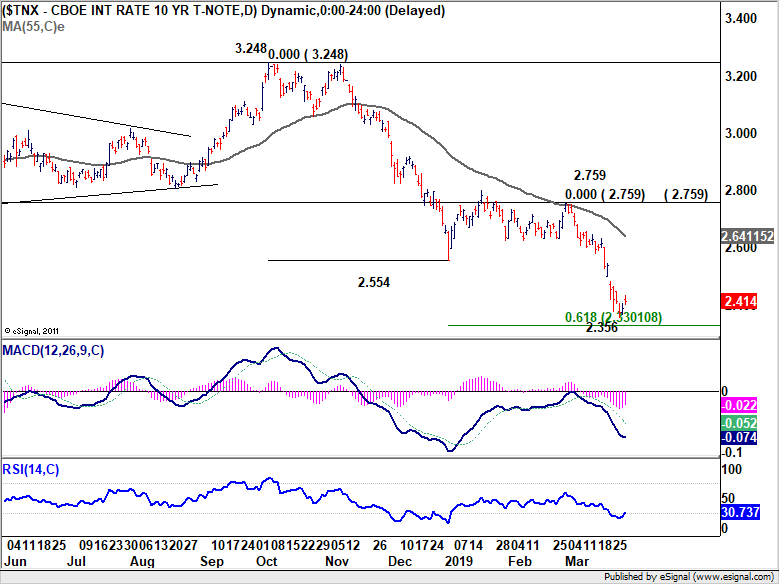
Also, note that the solid break of long term channel support suggests that rise from 1.336 has completed at 3.248. For now, we're viewing decline from 3.248 as correcting this up trend only. But even so, TNX will likely extend to 2.034/66 support zone (61.8% retracement of 1.336 to 3.248 at 2.066, 100% projection of 3.248 to 2.554 from 2.759 at 2.065, 2.034 medium term support and 2.0 psychological). That is that level where the decline from 3.248 would likely complete.
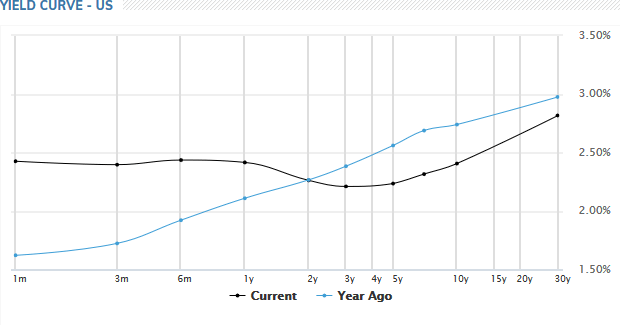
With last week's recovery, 10-year yield is now back above 3-month yield at 2.396. But based on the above view on TNX, it should be just a matter of time this part of the yield curve inverts again.
Stocks stayed firm in general, lagging behind treasury yields
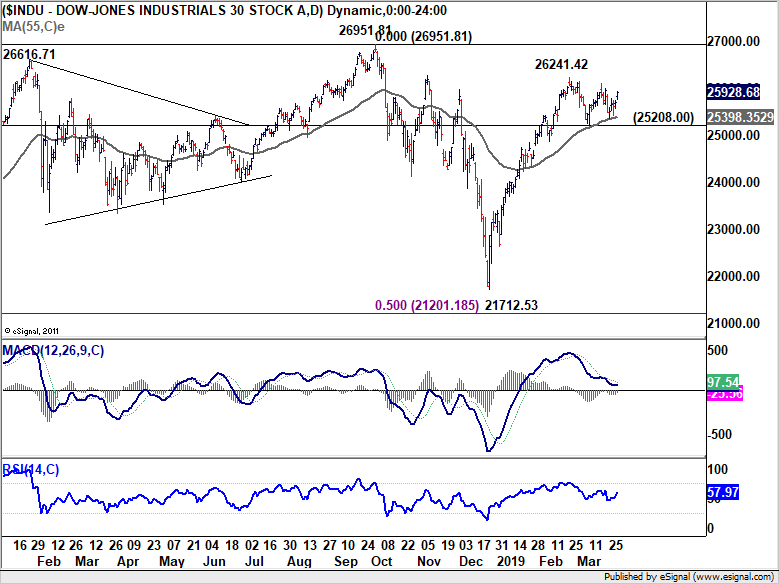
However, the bond "panic" was not so much reflected in stocks, yet. In US, DOW just turned sideway after hitting 26241.42 in late February. Solid support was seen from 55 day EMA despite decline attempts. For now, further rise is still in favor in the early part of Q2. But we maintain the view that rise from 21712.53 is only a leg inside the long term consolidation pattern from 26951.81. Hence, upside potential should be limited with next rise and firm break of 26951.81 is not envisaged. Instead, break of 25208 will be a strong sign of near term bearish reversal.
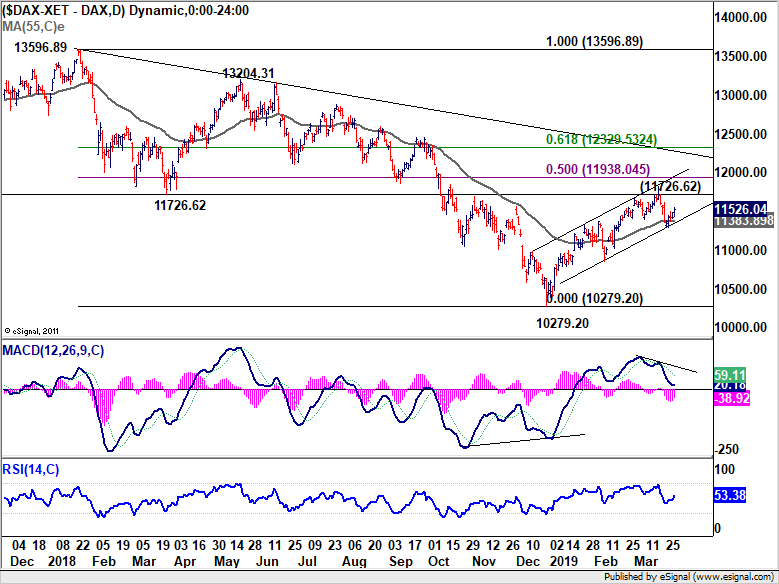
In Europe, despite all the dovish talks of slowdown and even recession in Germany, DAX managed to stay in near term rising channel. Terribly poor manufacturing and export outlook is still offset by solid domestic and service demand. However, upside momentum is DAX is rather weak as seen in daily MACD. Even if it could mange to breach 11726.62 support turned resistance, 50% retracement of 13596.89 to 10279.20 at 11938.04 will likely cap upside.
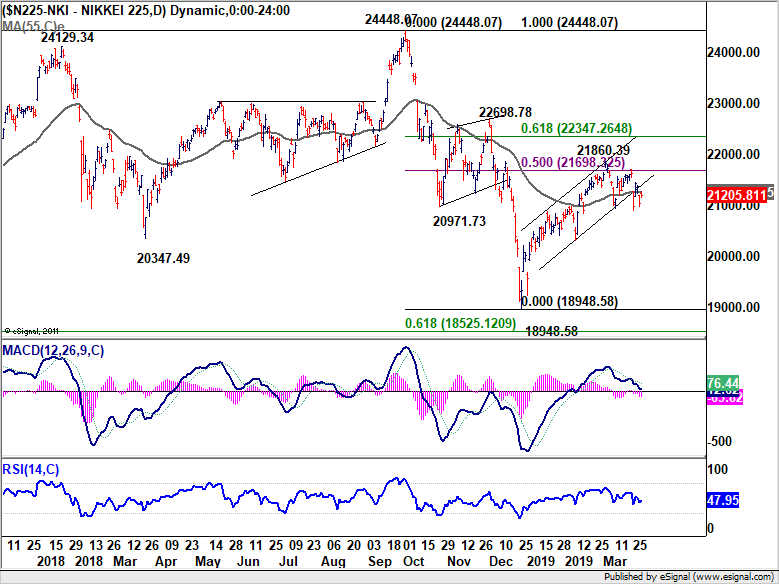
In Asia, Nikkei looks somewhat more vulnerable. 50% retracement of 24448.07 to 18948.58 at 21698.32 proves to be a rather strong resistance level. With break of medium term channel support, risk of reversal is increasing. In case of another recovery, upside should be limited well below 21860.39 resistance. Sustained break 20911.51 support could trigger downside acceleration back to 20000 handle.
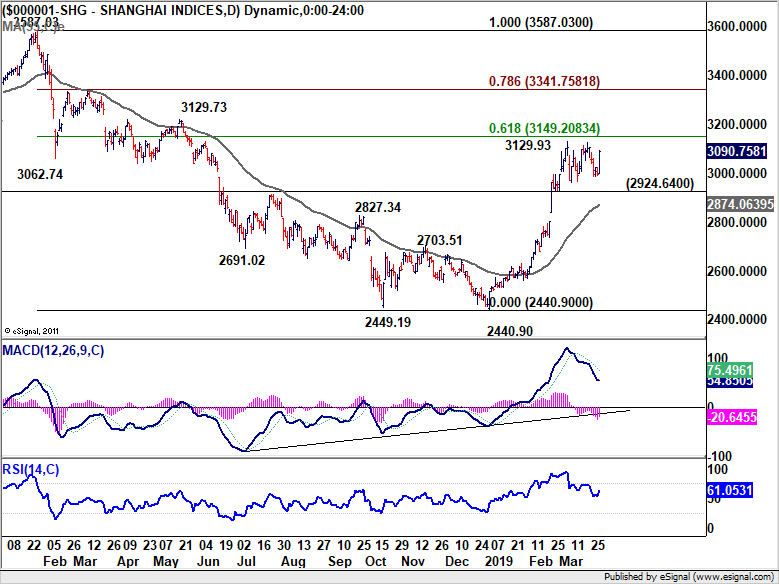
Chinese stocks performed rather well despite lack of concrete progress in trade negotiations with US. And a bit like DOW, Shanghai SSE composite turned sideway after hitting 3129.93 in early March. Such consolidative pattern in turn suggests that rise from 2440.90 isn't over yet. More upside is in favor as long as 2924.64 support holds. SSE could hit 78.6% retracement of 3587.03 to 2440.90 at 3341.75 before topping.
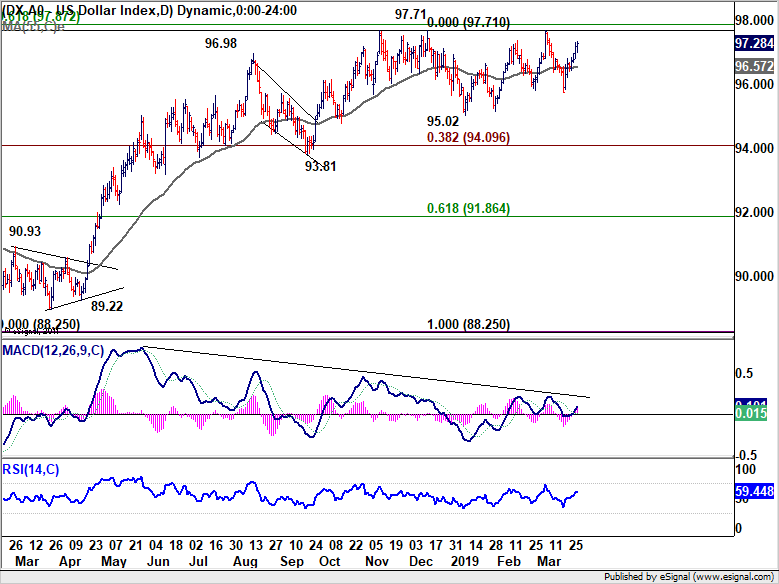
Dollar index extending medium term consolidation, no sign of breakout yet.
There has been no special development in Dollar index. It topped at 97.71 last December and turned sideway since then. And despite last week's rebound, it's still limited well below 97.71. There is no clear sign of breakout yet. Technically speaking, more range trading could be seen with risk of more downside attempts. That include even a dip to 95.02 support and below. But even in that case, we're not expecting a break 93.81 support. An eventual upside breakout is still expected.
EUR/CHF Weekly Outlook
Despite diminishing downside momentum as seen in 4 hour MACD, EUR/CHF dropped further to as low as 1.1163 last week. Break of 1.1173 low should indicate resumption of medium term decline from 1.2555. But decisive break of 1.1154 fibonacci level is needed to confirm. But in any case, further decline is expected this week as long as 1.1256 resistance holds, even in case of recovery. Firm break of 1.1154 will pave the way to 61.8% projection of 1.2004 to 1.1173 from 1.1444 at 1.0930.
In the bigger picture, multiple rejection by 55 week EMA indicates medium term bearishness. Focus remains on 1.1154/98 support zone (2016 high and 61.8% retracement of 1.0629 to 1.2004 at 1.1154). Decisive break there will confirm resumption of whole down trend from 1.2004 and long term bearish reversal. EUR/CHF should then target 1.0629 support and below. This will now remain the favored case as long as 1.1444 resistance holds.
In the long term picture, the current development argues that long term up trend has completed at 1.2004 after rejection of 1.2 key resistance. Sustained break of 1.1198 support will confirm this bearish case and target 1.0629 and below.
Summary 4/1 – 4/5
Monday, Apr 1, 2019
[php_everywhere instance="1"]
Tuesday, Apr 2, 2019
[php_everywhere instance="2"]
Wednesday, Apr 3, 2019
[php_everywhere instance="3"]
Thursday, Apr 4, 2019
[php_everywhere instance="4"]
Friday, Apr 5, 2019
[php_everywhere instance="5"]
Weekly Economic and Financial Commentary: What Lies Beyond the Soft First Quarter?
U.S. Review
Resiliency in the Face of Uncertainty
- The U.S. economy continues to show a great deal of resiliency in the face of slowing global economic growth and a whole host of geopolitical uncertainty.
- Falling long-term interest rates have raised fears about a recession but have also halted the slide in home sales.
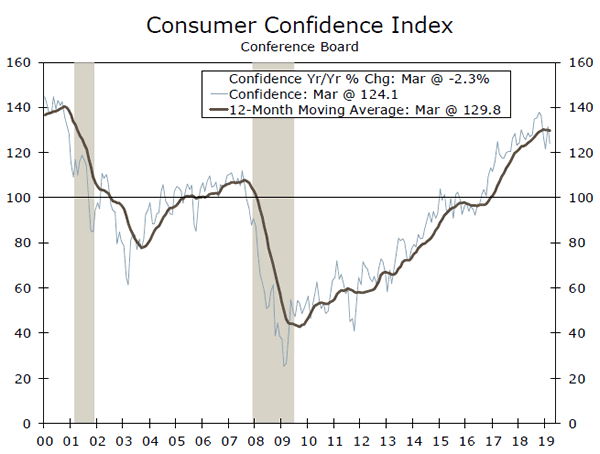
- Consumer confidence fell in March, as consumers expressed less optimism about employment conditions. Plans to purchase cars and homes both rose notably.
- Regional production indices weakened in March but remain at levels consistent with modest economic growth.
What Lies Beyond the Soft First Quarter?
Today marks the last business day of an exceptionally soft first quarter. We estimate that real GDP grew at a 1.4% annual rate during the quarter, largely due to the weakness in consumer spending and housing at the end of 2018 and at the start of this year. The federal government shutdown also negatively impacted Q1 growth, as did weaker global economic growth and lingering uncertainty surrounding geopolitical events, such as Brexit and ongoing trade negotiations with China.
Through all of this uncertainty, the U.S. economy has continued to show a great deal of resiliency. The downward revision to Q4 GDP growth to a 2.2% annual rate effectively lowered the bar for the current quarter, which should make it easier to meet our modest growth expectations. The trade deficit also shrank sharply in January, which should boost Q1 growth.
Most data through February show the economy losing momentum. Income growth has been surprisingly weak, with personal income rising just 0.2% in February after declining 0.1% the prior month. Most of the weakness was in farm income and income from interest and dividends. Wages and salaries rose 0.3% in both January and February. Tax payments also apparently jumped in January, resulting in a 0.2% drop in real after-tax income. The softer income data may explain the recent dip in consumer confidence, which fell 7.3 points in March but remains at a fairly lofty level.
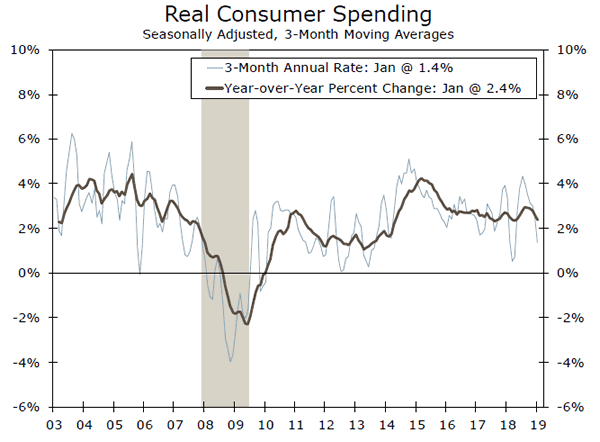
The hangover from the government shutdown has the statistical agencies playing catch-up. Only nominal income data are available through February. The latest real personal consumption data are for January and they rose just 0.1%, following a 0.6% drop in December. Much of January's weakness in January was in durable goods, which plunged 1.6%. With incomes growing slowly, tax refunds running late and Easter falling late this year, the risks to Q1 spending are stacked to the downside for our 1.7% forecast. Any shortfall would at least partially result in higher inventories, mitigating some of the damage to Q1 growth.
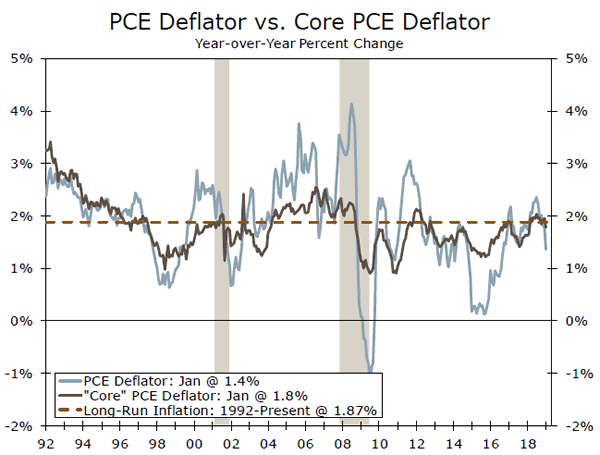
Inflation continues to run slightly below the Fed's objective. The overall PCE deflator fell 0.1% in January, and prices excluding food and energy rose just 0.1%. On a year-over-year basis, the core PCE deflator—the Fed's preferred price gauge—is up just 1.8%. The lack of inflationary pressure gives the Fed plenty of latitude in holding off on any additional rate hikes.
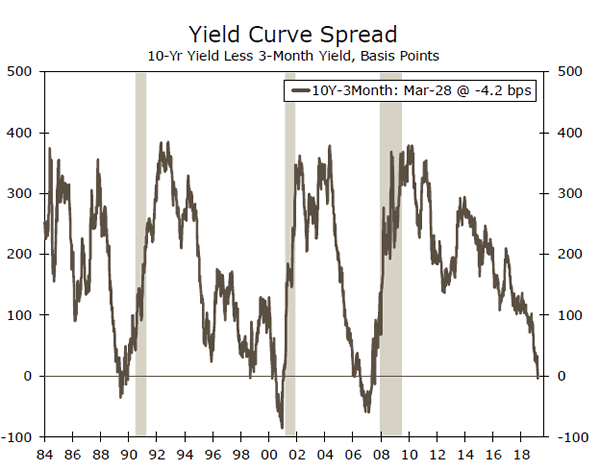
Softer economic news combined with the drop in long-term interest rates has produced an inverted yield curve, with the yield on the 10-year Treasury note falling below the three-month T-bill. On an ominous note, every recession for the past 60 years has been preceded by an inverted yield curve. Every inverted yield curve, however, has not been followed by a recession.
Fortunately, the U.S. economy is slowing from a fairly strong position. Employment growth has been fairly strong, unemployment is low and household balance sheets are relatively healthy. The key areas to watch are the more cyclical areas of the economy—most notably motor vehicle sales, home sales and factory orders, all of which are losing steam.
U.S. Outlook
Retail Sales • Monday
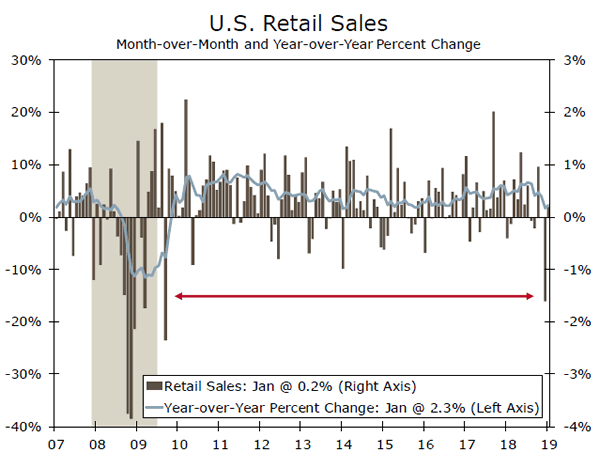
After the largest monthly decline since the Great Recession, retail sales rose a modest 0.2% in January. Excluding volatile components, the control group rebounded 1.1% in January, but that wasn't enough to make up for the cratering in this measure at the end of last year.
Consumer fundamentals have shown some signs of weakness. This morning we learned that income growth has been surprisingly weak, with personal income rising just 0.2% in February. Consumer confidence also slipped 7.3 points in March, indicating consumers have still not fully found their footing after the stock market selloff late last year. Given these developments and the more measured start to the year for retail sales, consumer spending looks poised to slow well below 2% in the first quarter. However, we still hold our view that this will not cause a prolonged retrenchment in consumer spending.
Previous: 0.2% Wells Fargo: 0.2% Consensus: 0.3% (Month-over-Month)
ISM Man. & ISM Non-Man. • Mon & Wed
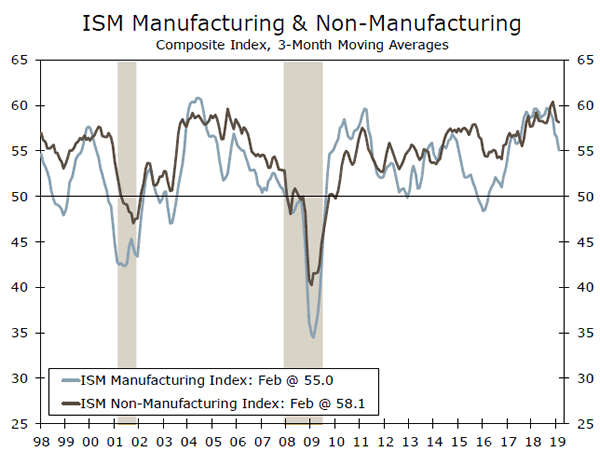
The ISM non-manufacturing index, to be released on Wednesday, rose three points to 59.7 in February. Growth in the service sector remains firm, with the business activity index at 64.7 and the new orders index at 65.2. The ISM manufacturing index, on the other hand, slipped to 54.2 in February, the slowest pace of factory sector activity since 2016. This key gauge of manufacturing momentum appears to have rolled over. However, that has happened twice in this cycle without a subsequent recession, and despite a slowdown in manufacturing, the service sector continues to accelerate.
Though trade tension is likely to have more of an effect on the factory sector than on the service sector, a decelerating global growth environment coupled with continued trade uncertainty have the potential to weigh on activity in coming months.
Previous: 59.7 Wells Fargo: 57.8 Consensus: 58.0
Employment • Friday
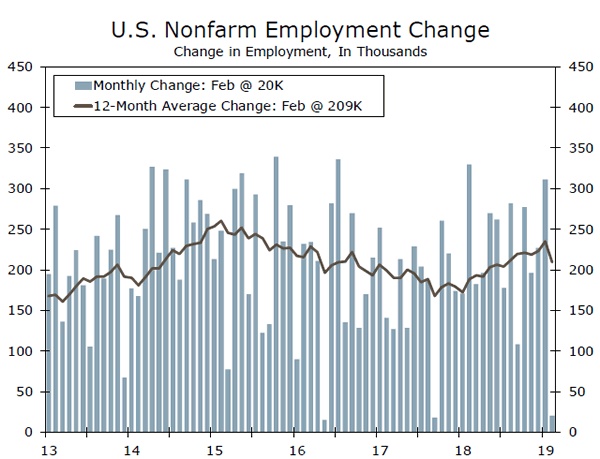
Hiring slowed in February, as employers added only 20,000 new jobs. As evident in the construction, mining & logging and goodsproducing sectors, winter weather weighed on hiring. Average hourly earnings increased 3.4% year-over-year in February—a new cycle high. The unemployment rate remains low within its recent range, consistent with the downward drift in initial jobless claims reported this week.
At last week's FOMC meeting the Fed remained dovish, as a majority of voting members predicted keeping rates on hold this year. They also decreased their projections of real GDP growth and commented on the slow rate of fourth quarter economic activity. Furthermore, the yield curve inverted at the end of last week, suggesting increased worries a recession may be imminent. With these factors in mind, we look for nonfarm payrolls to rise 160,000 in March.
Previous: 20,000 Wells Fargo: 160,000 Consensus: 175,000
Global Review
As the Clock Ticks, Still No Brexit Solution
- As the clock winds down, the United Kingdom again failed to find a path forward for Brexit this week. Parliament had an opportunity to vote on a number of alternative options but none received a majority of votes, while Prime Minister May's deal still seems to lack enough support to pass. The risk of a nodeal exit and a general election are rising.
- It was a busy week for Mexico, where the central bank signaled it was in no rush to start cutting interest rates. High real interest rates are likely keeping a lid on growth in Mexico's economy, which also faces challenges from flat demand for autos and ongoing declines in oil production.
Still No Clear Path Forward for Brexit
The past week featured nearly constant headlines about Brexit, and yet, despite all the back and forth, we know nothing more than we did a week ago. U.K. Parliament had a chance on Wednesday to hold a series of indicative votes on alternative paths forward for the Brexit process. These were non-binding votes, but it was widely expected that any plan favored by a majority of members of parliament (MPs) would be implemented by Theresa May's government. However, none of the options received a majority of votes, and attention is now shifting back toward May's original Brexit deal. May vowed to resign if her deal is approved, but that does not seem to have swayed enough MPs to pass her deal. Where does that leave things? The default legal option as it currently stands is for the United Kingdom to leave the E.U. without a deal on April 12. Before then, MPs must either approve May's deal, propose an alternative plan to deliver Brexit or seek a longer extension to the Article 50 deadline (perhaps several years), which could open the door to new elections or a second referendum. Another round of voting and debates in parliament on alternative plans is expected to take place on Monday.
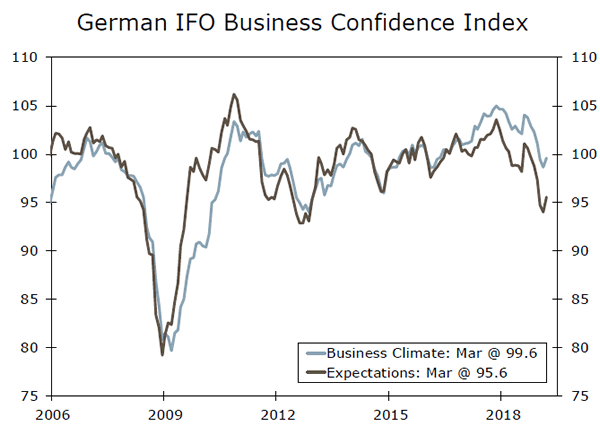
Elsewhere in Europe, activity and sentiment figures for the Eurozone were mixed but showed some green shoots. Germany's March IFO business confidence index recovered to a still-low 99.6 (top chart), the first increase in six months, while annual retail sales growth unexpectedly perked up to 4.7% in February. Still, overall economic confidence for the Eurozone softened a bit more than expected to 105.5 in March, with declines in industrial and services confidence. Overall, it seems that the Eurozone economy will remain soft for now, and interest rates will likely remain at or near current levels for quite some time. Perhaps acknowledging that rates would remain negative for an extended period, European Central Bank (ECB) President Draghi this week noted that the central bank would consider measures to mitigate the side effects of negative rates. One option that has been discussed would be a tiered-deposit system where only a certain portion of commercial bank excess reserves would be subject to negative interest rates (currently, all excess reserves of commercial banks are subject to a rate of -0.40%). However, ECB policymakers have had mixed comments on such a policy, suggesting it is far from a done deal.
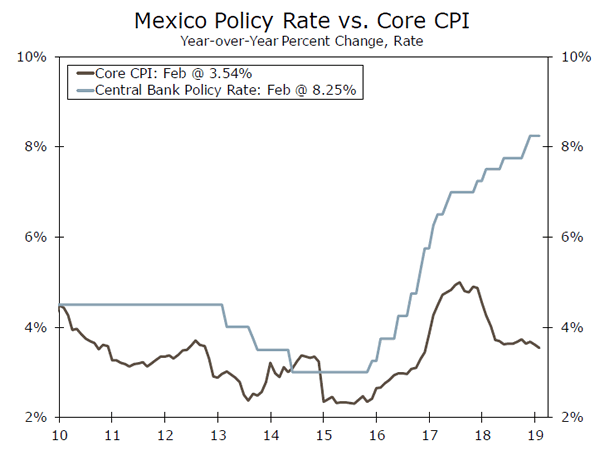
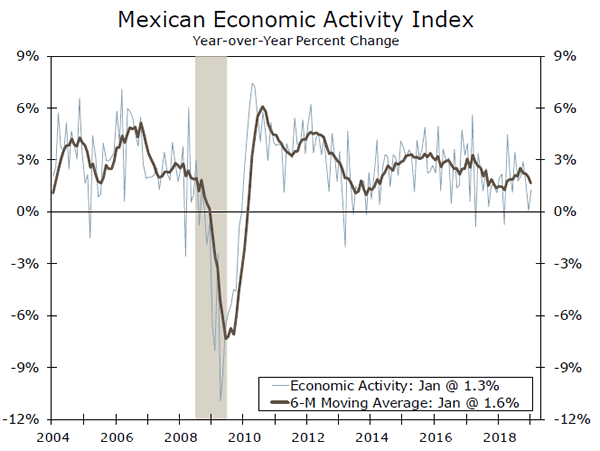
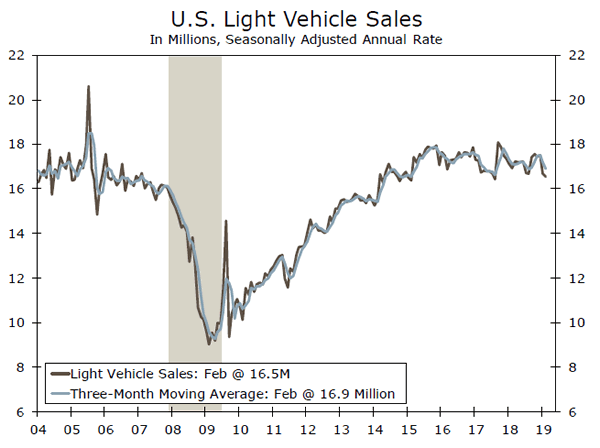
Finally, turning to emerging markets, Mexico's central bank held its overnight rate steady at 8.25% as expected, but was more hawkish than anticipated, noting inflation risks were still to the upside. It seems the Mexican economy will not be receiving much relief from high real interest rates anytime soon. Data released this week showed economic activity rose just 1.3% in the year through January, while retail sales climbed just 0.9% (middle chart). As we wrote in a longer form piece earlier this week, Mexico's economy is also facing weaker auto demand from its neighbor to the north (bottom chart) and continued declines in oil production. Weakness in the Mexican economy raises the stakes for the ratification of the NAFTA replacement known as the U.S.-Mexico-Canada Agreement (USMCA), currently being discussed by U.S. Congress.
Global Outlook
U.K. PMIs • Monday &Wednesday
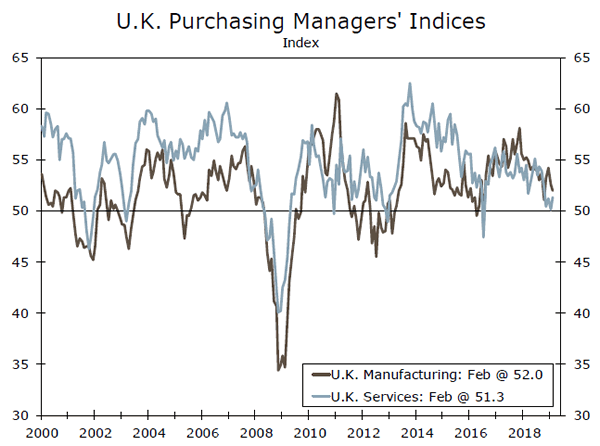
The U.K. PMIs for March are slated for release next week (manufacturing PMI on Monday, services PMI on Wednesday), and could offer important insight into the performance of the economy during a month characterized by the most acute uncertainty over the Brexit process. The PMIs for both the manufacturing and services sectors are only modestly above 50, and somewhat at odds with surprisingly resilient hard economic data. Nowhere is that dichotomy more apparent than the services sector, with a PMI reading of just 51.3, even as retail sales have accelerated in recent months. The picture manufacturing is a bit more consistent, as output has weakened considerably and sentiment remains soft, with the manufacturing PMI currently standing at just 52.0. In our view, the longer the uncertainty of Brexit drags on, the more negative it will become for the economy, and the more it will affect the hard data and sentiment data alike.
Previous: 52.0 (Manufacturing) 51.3 (Services) Consensus: 51.3 (Manufacturing) 51.0 (Services)
Eurozone Retail Sales • Wednesday
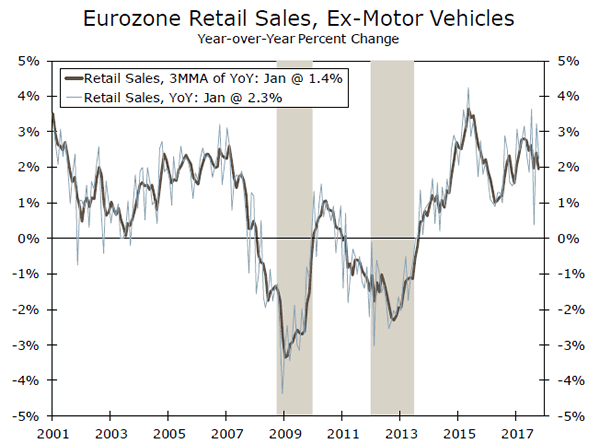
The Eurozone economy has been slowing for several months now, and fears of a recession in the currency bloc are rising. Looking at the components of domestic demand, consumer spending has been the weakest component with sequential growth of just 0.2% (not annualized) in Q4-2018 and just 0.1% in the prior quarter. These data are somewhat at odds with the retail sales figures, which have been a bit more resilient, and are even harder to square with solid consumer fundamentals in the Eurozone. Wage growth has picked up meaningfully in recent quarters and employment growth remains solid, implying strong income growth. Inflation jumped toward the second half of last year amid higher oil prices, but has receded more recently, suggesting real incomes have improved. We remain of the view that the Eurozone will avoid recession, helped in large part by solid consumer fundamentals, and retail sales will thus be a key activity figure to watch.
Previous: 1.3% (Month-over-Month) Consensus: 0.1%
Canada Employment • Friday
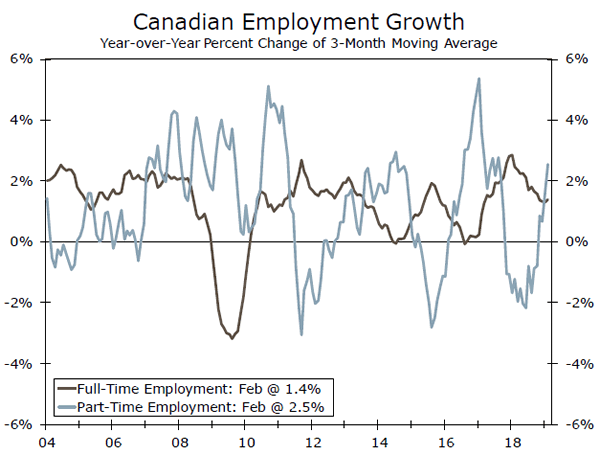
Canada's economy has shown recent signs of weakness, as Q4 GDP rose just 0.4% on a sequential annualized basis. That softness in growth has seemingly not yet fed into a weaker labor market, however. If anything, employment growth has picked up in recent months, while wage growth has rebounded and the jobless rate remains fairly low. To be sure, the mix of full-time jobs and part-time jobs has worsened a bit in recent months, but full-time job growth is still solid.
Going forward, the labor market will be a key signal to watch for whether Canada's economy will hold up amid rising risks, including housing market weakness and still-subdued oil prices. Wage growth could be particularly important to watch given concerns around elevated consumer indebtedness, especially as it relates to mortgage debt. Solid real wage gains would help offset some of the burden of higher interest rates as consumers pay off their mortgages.
Previous: 55.9K Consensus: -10.0K
Point of View
Interest Rate Watch
What Is Going on in the U.S. Treasury Market?
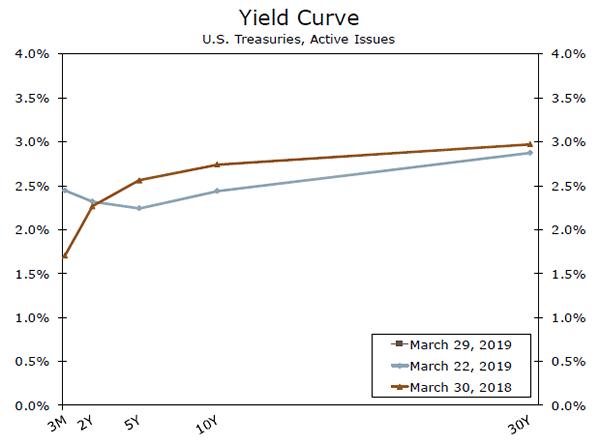
U.S. Treasury markets have been on a wild ride over the past week or so. Treasury yields on securities maturing between two and ten years have fallen about 25 bps since the day before the Fed meeting, accelerating what has already been a steep decline in yields over the past six months. As recently as November, the 10-year Treasury was yielding about 3.25%, while today it stands just below 2.40%.
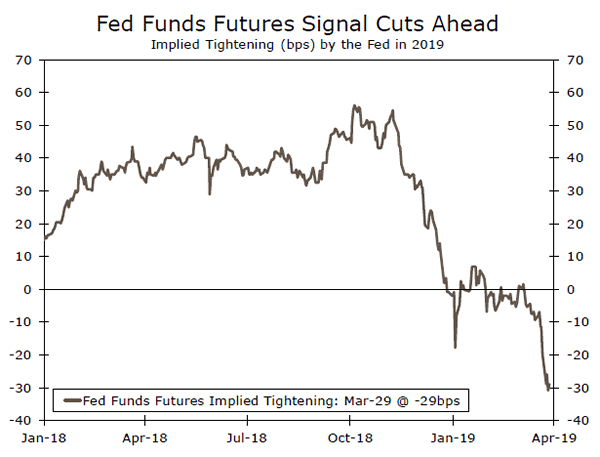
A softer growth and inflation outlook has likely played a role in the falling yields, but the biggest driver has probably been the extent to which all future Fed tightening has been removed from the bond market. Back in November, fed funds futures implied that markets were pricing in a bit more than two rate hikes in 2019. Today, fed funds futures imply markets are priced for a bit more than one cut in 2019. This amounts to a net swing of roughly 80bps (middle chart), a significant move that has weighed on yields across the Treasury curve. Going out a bit further, the story does not change much, as fed funds futures currently imply roughly another 40 bps in easing in 2020.
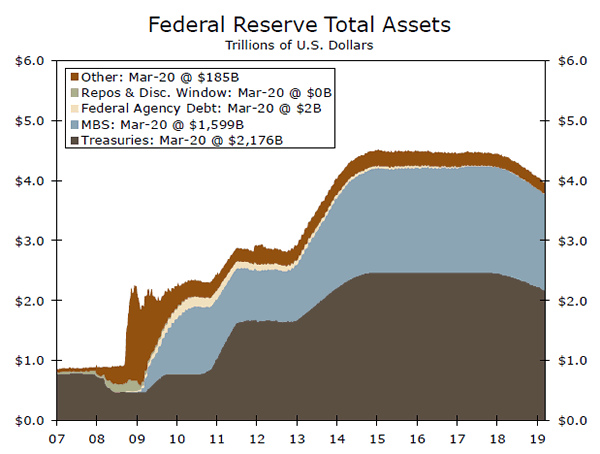
A secondary driver was the Fed's somewhat dovish approach to ending balance sheet reductions. The Fed announced last week that it would stop reducing the size of its balance sheet at the end of Q3; our forecast had been for the unwind to end one quarter later. Furthermore, the Fed chose to reduce the cap on its Treasury redemptions by $15 billion a month starting in May. Though individually neither of these moves were particularly large, their cumulative impact was probably enough to reduce the supply of Treasury securities available to the market in 2019 by roughly $150 billion relative to our baseline.
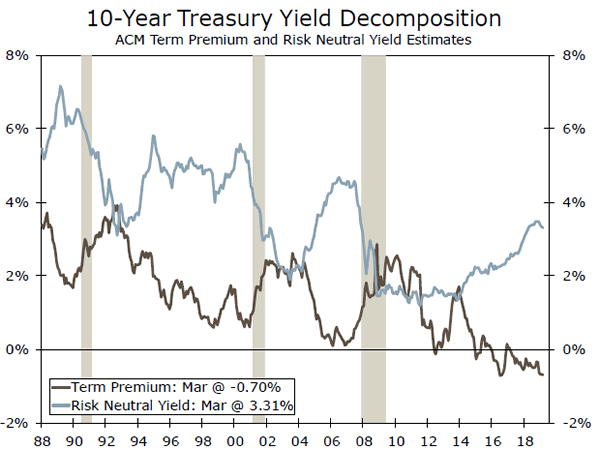
Will yields continue to decline? We believe the answer is no. We do not expect the Fed to cut rates in 2019, and we expect foreign central banks like the European Central Bank and the Bank of England to begin tightening either late this year or in the first half of 2020. That said, it will be difficult for yields to rise too much unless expectations for Fed policy dramatically reverse course or the term premium reemerges from hibernation.
Credit Market Insights
Mortgage Rates Head South
The average rate on a conventional 30-year mortgage fell 22 bps over the past week, the largest weekly decline since 2008. After reaching a cycle high of 4.8% in November, rates have plunged to 4.1%, bringing residential financing costs down to the lowest level in more than a year.
The Fed's dovish pivot has reverberated throughout credit markets worldwide. Sovereign bond yields across the developed world have fallen dramatically in recent weeks as investors sift through indications of weakening economic momentum and shifting central bank intentions. The 10-year Treasury yield has fallen below 2.4% and now sits below the yield on the three-month T-bill. While the inversion of the yield curve will spark fears of a recession, the outlook for the housing sector during this key buying season has become sunnier. Mortgage applications bounced 8.9% last week and should continue to trend up as lower rates filter through to prospective buyers. With prices stretching affordability so thin, a drop in rates— particularly of this magnitude—can induce marginal buyers to re-enter the market. We have also seen a surge in refinancing activity as homeowners aim to lock in these lower rates. Implied interest rate volatility has surged this past week as markets increasingly price in a Fed rate cut, despite officials maintaining they are merely on hold. Nevertheless, the decline in mortgage rates is significant, and should be sufficient to stem the decline in housing we observed through the end of last year.
Topic of the Week
Inverted Yield Curve: Is It Different This Time?
Yields on 10-year Treasury notes fell below yields on three-month Treasury bills at the end of last week, resulting in an inversion of this measure of the yield curve for the first time since 2007. The front-end of the curve inverted in December, but the inversion of the 10-year/three-month is a more widely recognized omen for recession. This week, we examined the recent inversion of the yield curve and what it suggests for economic growth—is it different this time?
First, the degree of yield curve inversion at present is insignificant relative to prior cycles. Putting the recent inversion of the yield curve into perspective, the curve inverted 17 months before the start of the Great Recession, and the spread fell to as much as -60 bps in early 2017. During the previous cycle, the curve inverted eight months before the start of the recession, and the spread fell to nearly -100 bps in late 2000. The curve would need to invert significantly and remain inverted for weeks, if not months, before it would be a reliable recession signal. Recent comments from Dallas Fed President, Robert Kaplan, and St. Louis Fed President, James Bullard, reiterate this point. In an interview this week, Kaplan said, "I'd need to see an inversion of some magnitude and/or some duration," while Bullard said on Thursday, "I think you would have to get a wider variety of spreads to be inverted…and it would have to stay inverted and be meaningfully inverted for a while" when discussing if the recent inversion was a negative signal.
There is also some question about unique factors that may make the yield curve more dynamic compared to prior inversions. The purchase of Treasury securities by the Fed as part of its quantitative easing program collapsed the term premium on longer-dated Treasury bonds. That means the yield on the 10-year Treasury is arguably lower than it otherwise would be.
Furthermore, the yield curve is really the only indicator signaling trouble at present. We would need to see further sustained inversion along with generalized restriction in financial conditions in conjunction with deterioration in economic fundamentals before we become truly worried.
The Weekly Bottom Line: When the Downside Risks Loom Large
U.S. Highlights
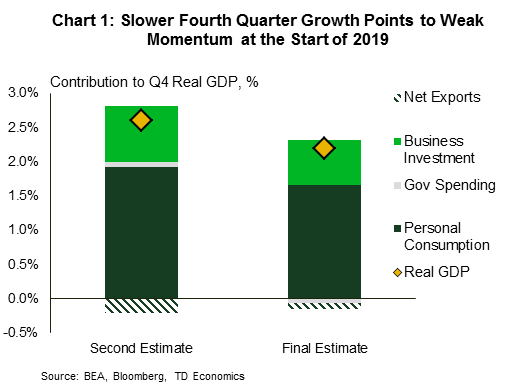
- The U.S. economy expanded at a slower pace than previously reported in the fourth quarter (2.2% vs. 2.6%). This left annual average growth at just below the 3% mark, though Q4/Q4 they were just able to hit that psychological marker.
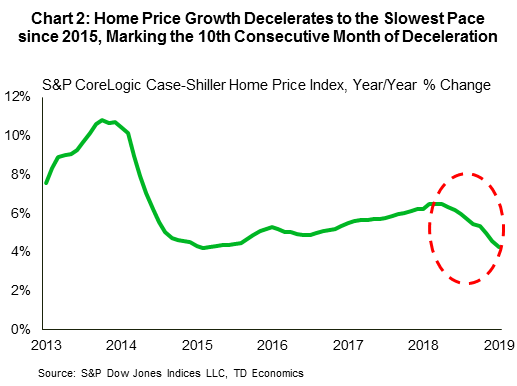
- Housing starts declined in February, though the sale of new homes picked up. A recent deceleration in home price growth should support an expected rebound in housing activity in the months ahead.
- The trade deficit narrowed in January, aided by a decrease in the goods deficit with China – down $5.5B. On this front, trade talks between the two countries made progress as China showed willingness to negotiate on tech-related concerns.
Canadian Highlights
- The highly-anticipated January GDP report blew away expectations, with the economy expanding at a healthy 0.3% rate to begin the year. What's more, the breadth of the expansion was impressive, with output higher in 18 of 20 industries.
- The strong GDP report brightened the mood of financial markets. It sent bond yields and the Canadian dollar higher, narrowing the inversion in the yield curve, and causing investors to pare back their bets on a rate cut this year.
- Payroll employment expanded by a healthy 71k in January, capping an overall healthy week for Canadian data.
U.S. - When the Downside Risks Loom Large
Hang on to your hats folks. With Fed speeches, Brexit votes, and a slew of economic data, this week was exhilarating.
First, on the data front, the American economy expanded by 2.2% (annualized) in 2018Q4, down from the 2.6% rate initially reported (Chart 1). The revision brought annual average growth to 2.9%, though Q4/Q4 growth was 3%. Consumer spending, government expenditure and business investment were all revised lower, while net exports showed a smaller deficit. Corporate profits also stalled in Q4. These data point to a slowing trend and a weaker handoff to 2019. Reinforcing this narrative, personal income and spending kicked off 2019 with tepid gains. PCE inflation was also muted at 1.4% (y/y) overall and 1.8% for core.
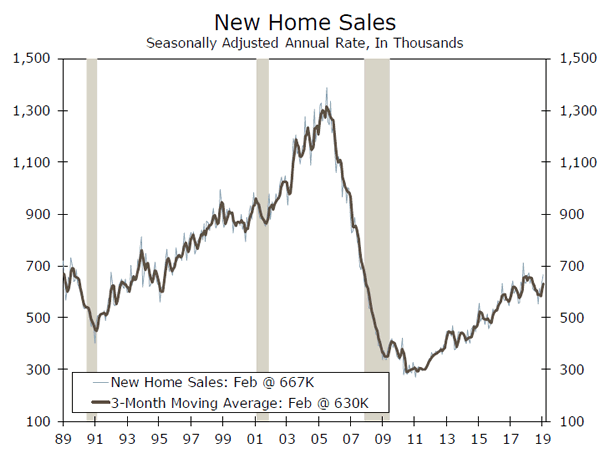
Housing data also came in on the disappointing side. Housing starts declined 8.7% in February, giving back most of the gains in January. The turn lower was concentrated in the single family segment. Meanwhile, the pace of new home sales perked up to the best rate in almost a year (4.9%). Additionally, in January, home price growth decelerated to the slowest rate in almost 4 years – 4.3% (y/y) down from 4.6% a month earlier. It also marked 10 consecutive months of slowing growth (Chart 2). Higher mortgage rates earlier in 2018 and the past run-up in home prices dented affordability. However, recent declines in rates, smaller price gains, and rising wages should result in improved activity going forward as housing demand rebounds (see report).
On the trade front, the trade deficit narrowed sharply in January, from $59.9bn to $51.1bn, implying less of a drag on GDP growth from net trade in 19Q1. The improvement largely reflected shifting trade with China. Fortunately, there appears to be some progress in negotiations. China is offering concessions on technology-related issues, which had been a major sticking point for U.S. negotiators. Trade talks continue in Washington next week.
Across the pond, the Brexit saga continued to unfold, leaving a lingering air of uncertainty. The UK's Parliament failed to come to a consensus on alternatives to the withdrawal agreement on Wednesday. Out of eight options proposed, not one was able to garner the needed majority. Parliament voted for a third time against the deal today, the day Britain was originally set to leave. Prime Minister May, who offered her resignation in exchange for support, continues to face an uphill battle to consolidate opinion on a deal. Debate on a deal is expected to continue next week.
Lastly, a parade of Fed speakers made the rounds this week. Among them, Chicago Fed President Evans echoed sentiments expressed in last week's Fed statement – a rate hike for 2019 is likely not in the cards, while his Philadelphia counterpart, Patrick Harker, suggested one hike could be appropriate. All told, policy normalization at the Fed is quite likely nearly complete, as rising global risks leave the U.S. exposed to foreign shocks.
Canada - Strong GDP Print Brightens the Mood in Markets
After a steady diet of pessimism had permeated financial markets in recent weeks, the mood was brightened to end this week. The improved sentiment came courtesy of a robust January GDP report, showing that the economy started 2019 on a much stronger footing than analysts had expected. The upside surprise on GDP sent the yield on the 10-year benchmark bond up over 1.6%. The strong print also caused investors to significantly pare back their bets on a rate cut this year.
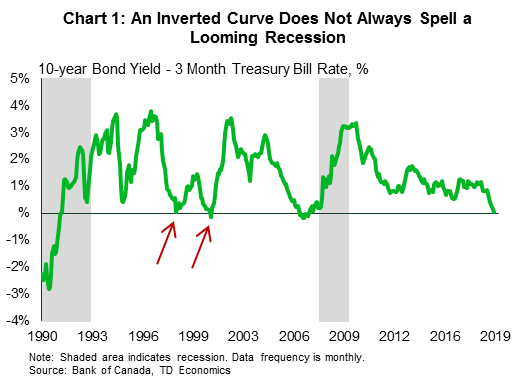
As of writing, the yield curve remains inverted – the three month yield sits at about 1.67% - but the gap narrowed by 5 basis points relative to where it was on Monday. At this juncture, we remind readers that, as a recession predictor, the yield curve has been fairly reliable for the U.S. economy. However, it is by no means perfect (see report). In Canada its track record is perhaps even less impressive, having sent a false signal a few times (Chart 1). Indeed, when reading the recession tea leaves, investors are better served by examining a range of indicators.
On that front, January employment data from the SEPH released this week sent a decidedly non-recessionary (albeit backward looking) signal. Indeed, payroll employment expanded by a solid 71k in January, the strongest gain since early 2017 and confirming the strength in the more timely LFS data that is used in calculating the unemployment rate. While other aspects of the report were softer, the solid jobs print had marginally positive implications for our Q1 tracking.
Elsewhere on the data front, January international trade data was notably less positive for Q1 growth prospects. The 0.9% gain in export volumes only partially offset December's drop, and was swamped by the 1.5% rise in imports.
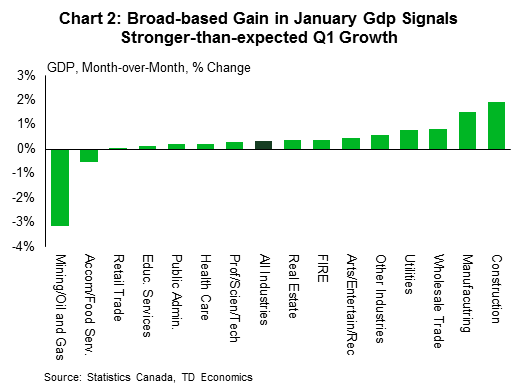
While the SEPH and international trade data whet the appetites of analysts, January's GDP report was undoubtedly the main course. As noted above, the report blew away expectations, with the economy expanding at a healthy 0.3% pace in January. The breadth of the expansion was impressive, with a full 18 of 20 sectors seeing higher output in the month (Chart 2). The construction sector led the way, where output expanded by 1.9%, breaking a string of seven straight monthly declines. Notable gains were also recorded in manufacturing, wholesale trade, and utilities output. Amid nearly wall-to-wall strength, the only real fly in the ointment was the mining, quarrying, oil and gas sector, where production curtailments in Alberta helped send output lower.
The upside surprise on GDP pushed our Q1 tracking all the way up to 1.1% (SAAR), roughly in line with the Bank of Canada's last read in January. Still, this below-trend pace of growth is unlikely to stir any fundamental inflation pressures or require action on rates from the Bank of Canada. In our view (see report), the current overnight rate of 1.75% is neither too hot, nor too cold, which should leave monetary policy on the sidelines for some time yet.
U.S.: Upcoming Key Economic Releases
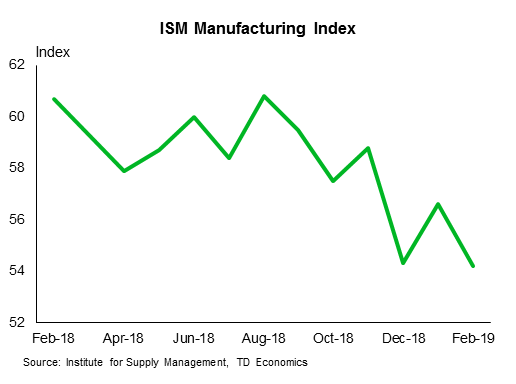
U.S. ISM Manufacturing Index - March
Release Date: April 1, 2019
Previous: 54.2
TD Forecast: 54.5
Consensus: 54.5
We look for a minor gain in the ISM index as the regional Fed surveys suggest manufacturing activity is holding up or may have even recovered in March. Indeed, the average of the ISM-adjusted regional surveys registered its first increase in four months to 54.2 in March, as only one out of the five surveys registered a decline. Based on the regional data, we anticipate improvements in the production and employment components of the survey, which are likely to be paired back by a decline in new orders. That said, across-the-board weak global manufacturing PMIs increase the risk for a downside surprise in March.
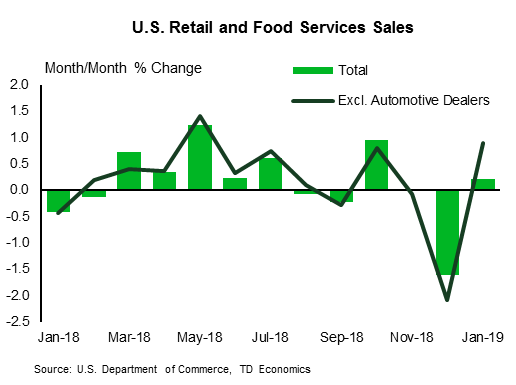
U.S. Retail Sales - February
Release Date: April 1, 2019
Previous: 0.2%, ex auto: 0.9%
TD Forecast: 0.2%, ex auto: 0.3%
Consensus: 0.3%, ex auto: 0.4%
We expect retail sales to have advanced at a 0.2% m/m pace in February, on the back of a solid increase in gasoline sales (its first in four months) and a more subdued gain in sales in the control group. We expect the former to have advanced a firm 0.4% m/m as gasoline prices continue to recover, while the latter likely mean-reverted (+0.3% m/m) following an eye-popping 1.1% jump in January. On the contrary, we expect auto sales to have remained mired, posting a second consecutive monthly drop in February.
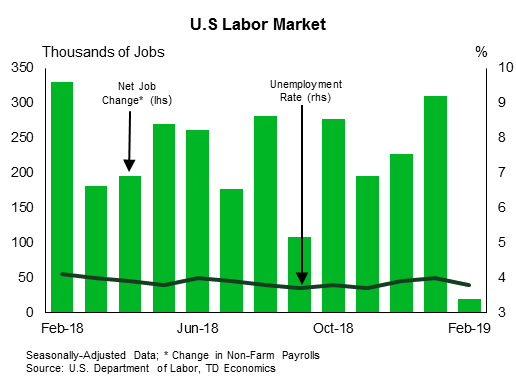
U.S. Employment - March
Release Date: April 5, 2019
Previous: 20k, unemployment rate: 3.8%
TD Forecast: 165k, unemployment rate: 3.8%
Consensus: 180k, unemployment rate: 3.8%
Following two zig-zagging reports for January and February, we look for payrolls to return to a more sustainable 165k print in March. In particular, we expect a recovery in employment in the construction sector following a sharp decline in February that probably reflected adverse weather effects. In addition, both manufacturing and services jobs should also register more trend-like gains as suggested by the regional Fed surveys. We look for the improvement in services employment to be led by job gains in the education and leisure sectors. All in, the household survey should show the unemployment rate remained steady at 3.8% in March, while we expect wages to rise by a "soft" 0.3% m/m pace as we anticipate some payback from the February rise. This should bring down the annual print by a tenth to 3.3% in March.
Canada: Upcoming Key Economic Releases
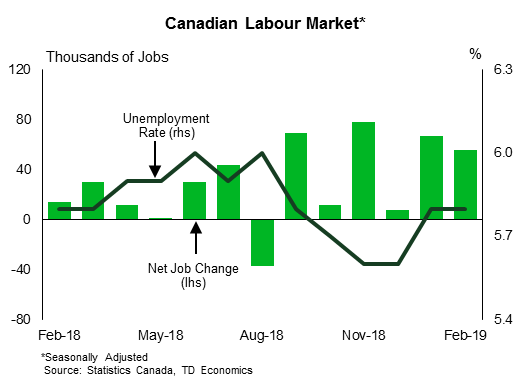
Canadian Employment - March
Release Date: April 5, 2019
Previous: 56k; unemployment rate: 5.8%
TD Forecast: 0k; unemployment rate: 5.9%;
Consensus: N/A
TD looks for employment levels to remain unchanged in March as firms hit pause after hiring over 100k workers over the first two months of 2019. Given the inherent volatility of the labour force survey, it is difficult to rule out further gains but we would note that the current 6m trend for job growth (48k, 29k full time) is entirely at odds with broader conditions in the Canadian economy. Unchanged employment should see the unemployment rate tick higher to 5.9% barring any unforeseen change to labour force participation while wage growth should hold at 2.2% y/y. Hours worked will also come under scrutiny after three consecutive declines that have seen total labour input fall into negative territory on a year-ago basis for the first time in two years. Further softness here would underscore the recent slowdown in the Canadian economy and undercut the message from strong employment gains.
April Optimism Could be Key Turning Point for Global Growth
The US dollar climbed higher as markets balanced out global growth concerns along with optimism a trade deal was nearing between the two largest economies in the world. US economic data painted a mixed picture with the earlier data in the week confirming slowdown worries. The focus is expected to shift away from the 3-month/10-year yield curve inversion as April data is expected to show signs the economy is stabilizing or possibly rebounding. Trade optimism is also growing as Chinese Vice Premier Liu He will resume talks with US officials in DC on Wednesday. With accommodative stances firmly cemented by most of the major central banks, any improvements to the global outlook could help drive a high-beta rebound.
- Strike 3 for PM May means long extension
- Oil’s best quarter in almost a decade may continue
- Australian rate decision, budget, and election announcement on tap
Brexit
Normally, after three strikes you are out! But PM May seems determined to ram through a deal so the UK can avoid taking part in EU parliamentary elections in May. May suffered a third defeat on her stripped-down withdrawal agreement. The margin of defeat has steadily improved from a historic 230 votes, to 149, and on Friday she lost by 58 votes. The third defeat raises bets that we will see a general election, complicating the UK’s attempts to finalizing a divorce agreement with the EU. Monday’s indicative votes may see a customs union be agreed upon in Parliament.
The base case is for UK to get a long extension and on Monday we will see lawmakers try to figure out options for a Plan B. The risks of a no-deal exit or an election are growing and those options would likely be the most bearish for the British pound.
Australia
The Australia dollar volatility should pickup ahead of a busy week that will see a rate decision, the annual budget release and announcement of elections. Expectations are high for the RBA to deliver a rate cut this year, especially after they witness their own yield curve inversion. Unlike the US, Australian 3-month/10-year yield curve inversions are more frequent and recent history shows six out of seven inversions saw rate cuts.
The release of the Australian budget is expected to snap a long streak of deficits. Economists expect a budget surplus of A$4.6 billion in the year through June 2020, the first since 1970. The last time Australia saw a surplus was right before the financial crisis in 2008.
Later in the week, expectations are high for elections to be called, something we have been seeing frequently in Australia. They have seen six prime ministers over the last 9 years, and current polls have Labor opposition’s Bill Shorten in the lead.
Oil
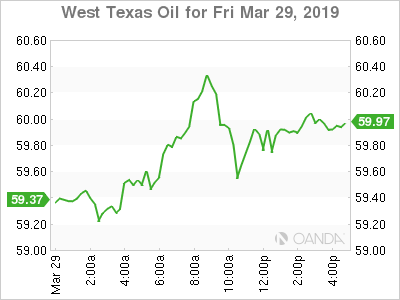
West Texas Intermediate crude had a great quarter that saw price recapture the $60.00 a barrel level, the first time since early November. The recent rise stemmed from growing optimism on global growth and continued declines with US rigs. April optimism is high for US and China data to recover and that could be a key spark for the demand side argument for higher prices.
Regarding production cuts, OPEC + has been very effective in stabilizing prices and if we continue to hear supportive comments from Russia, prices could remain well supported. OPEC has punted the April Extraordinary meeting till after the US makes their decision on sanctions with Iran and Venezuela. If OPEC fails to deliver a year-end extension, that could be straw that breaks this bullish rally’s back.
S&P 500 has best quarter since 2009
Stocks managed to still crush it this quarter, despite a yield inversion with the Fed’s favorite spread and heightened economic growth concerns. The rally is mainly attributed to accommodative monetary policy stances globally, expectations for growth concerns to stabilize and optimism China and the US will make a trade deal.
This was a very long earnings season and the next season is about to kickoff on April 11th. Expectations are for a soft quarter, but we could be in for a bullish surprise if we see trade war concerns ease. Earnings growth for the S&P 5000 index are eyed falling 3.3% when compared to the same period from a year ago. Weakness is heavily priced in and we could see strong reactions if we do get some more optimistic outlooks.
Turkish Lira
Once the Turkish controls are relaxed, we still could see the lira collapse. Regardless of the local Turkish election outcomes, investors may be quick to hit the sell button if Turkey abandoning faith in Turkish investments. The restriction of allowing foreign investors to sell the lira could prove to be damning in the future.
The Turkish economy is very weak, falling into its first recession in a decade and with inflation three times above the bank’s target range. If the elections see the public vote in line with the recent data, President Erdogan may lose control of some large cities and that could lead to calls for an early election. The next major election in Turkey is not for four years.
Monday, April 1
- 5:00am EUR CPI Estimate YoY
- 8:30am USD Retail Sales m/m
- 11:30pm AUD RBA Interest Rate Decision
Tuesday, April 2
- 4:30am AUD Annual Budget Release
- 8:30am USD Core Durable Goods Orders m/m
Wednesday, April 3
- 4:30am GBP Services PMI m/m
- 8:15am USD ADP Employment Change
- 10:00am USD ISM Non-Manufacturing PMI
Thursday, April 4
- CNY Holiday
- 7:30am EUR ECB Monetary Policy Meeting Accounts
- 8:30am USD Jobless Claims
Friday, April 5
- 8:30am USD Non-Farm Employment Change
- 8:30am USD Average Hourly Earnings m/m
- 8:30am CAD employment Change
*All times EDT
Struggling Euro Shifts Focus to Flash Eurozone CPI
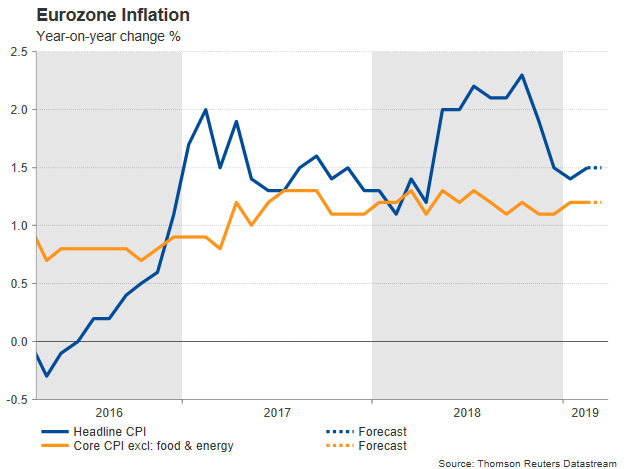
While the Brexit drama continues to keep investors busy in Europe, holding the euro and the pound in check, the Eurozone preliminary inflation readings for the month of March are expected to steal attention on Monday at 0900 GMT. Consensus is for the headline inflation to remain unchanged below the target the European Central Bank aims to achieve, feeding prospects of a continuing accommodative monetary policy as negative growth risks are on the rise.
On Thursday, the Harmonized version of the flash German Consumer Price Index, which is comparable to inflation measures from other EU economies, fell short of expectations both in monthly and year terms, raising speculation that Monday’s HICP for the euro area could also undershoot projections.
The European Central Bank has been long waiting wage growth to translate into higher inflation as it stubbornly maintained interest rates in negative territory and asset purchases running to enhance liquidity. While the headline CPI figure managed to increase slightly above the ECB’s 2.0% inflation goal during the second half of 2018, the core CPI that trims volatile food and energy items, remained subdued below 1.3% y/y, flagging that wage growth is still missing in action and therefore inflation upsides are not sustainable despite the unemployment rate easing to decade lows.
Indeed, during the December-January period, the headline CPI retreated significantly, from 1.9% y/y to 1.4% before inching up to 1.5% in February. On Monday, new data are anticipated to show that the measure failed to extend the recovery, remaining flat at 1.5%, which is also the ECB’s inflation forecast for 2019. Analysts also project a steady core CPI at 1.2% for the month of March.In monetary terms, such a level would urge policymakers to hold policy accommodative to aid the Eurozone economy. But since economic and political risks are heightening in the background mainly due to the Brexit chaos, the Italian recession and the US-Sino trade war, more needs to be done to avoid another crisis in the bloc.
With financial institutions complaining about negative interest rates eating their profits and the QE program coming to an end in December, the ECB has turned focus to lending. Specifically, at its March policy meeting, the central bank decided to provide further stimulus through a new series of targeted long-term refinancing operations (TILTRO-III) starting in September 2019 and ending in March 2021 (each with a maturity of 2 years). Moreover, the governing council agreed to continue reinvesting earnings from maturing securities purchased under the QE program for an extended period of time and until the date it starts to hike interest rates, or as long as it is necessary.
Stas on credit supply last month were also somewhat inflation-supportive as the numbers revealed that fears over a melting economy did not restrict the flow of cash to businesses and consumers. Corporate lending rose by 3.7% in February from 3.4% previously, while for households, the rate ticked up to 3.3% from 3.2% before. Still the negative prints in the eurozone consumer confidence measures and the weak PMI readings suggest that businesses and households are reluctant to boost spending.
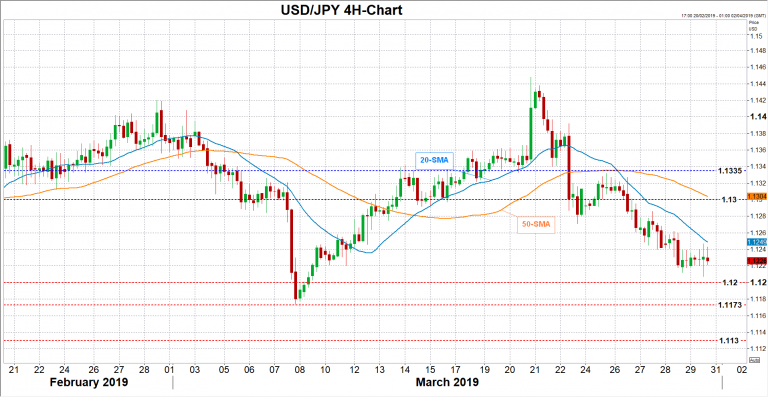
The lack of demand in the EURUSD market reflects the rising confusion investors face about the region’s economic health. Worse-than-expected inflation readings next week could increase chances for an even dovish policy meeting on April 10th as markets could start pricing that the course of the accommodative program may turn to more stimulus if conditions deteriorate. Such data results could push the pair in the edge of the 1.12 area, while lower traders could look for support around the March 3 low of 1.1175 and then at 1.1130.
In the positive scenario, if inflation shows strength, EURUSD could climb above the 20-period moving average in the 4-hour chart (1.1249) and towards 1.13. Slightly higher 1.1330 could also halt upside corrections.
RBA Meets; Might Struggle to Stay Neutral
The Reserve Bank of Australia made a major shift in policy in February by signalling that a rate cut was just as likely as a rate hike, abandoning its long-held tightening bias. However, investors have gone a step further and are pricing a 25-basis point reduction in the cash rate by August. With recent economic data suggesting the RBA’s recently downgraded growth forecasts are already looking overoptimistic, the RBA will have a hard time maintaining its current neutral stance and could be tempted to join its New Zealand counterpart in making another dovish turn. The Bank is due to announce its latest policy decision on Tuesday at 03:30 GMT.
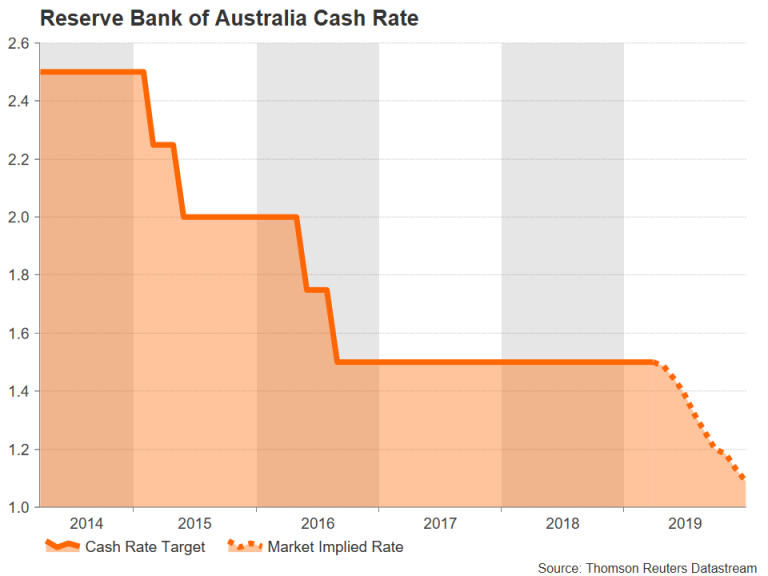
Australia’s central bank has held its cash rate at a record low 1.50% since August 2016 and has long been signalling that the next move is more likely to be up. But with growth in China – Australia’s biggest export market – continuing to decelerate and trade uncertainty still weighing on business confidence, Australia’s economy has also been losing momentum since the second half of 2018. Add to that, inflation remains subdued below the RBA’s 2-3% target band, forcing the Bank to repeatedly delay the timing of its rate hike.
But policymakers could soon be forced to backtrack on their rate hike plans and align their views with futures markets, which are currently indicating a more than 80% chance of two 25-basis point rate cuts by the year-end. It’s unclear, though, whether the central bank is ready to openly flag a rate cut as early as next week and may hang on to its neutral position for a while longer in case growth and inflation start to pick up in the coming months.
While a rebound in growth in the near term cannot be ruled out, it’s not looking very likely at the moment. The economy expanded by just 0.2% quarter-on-quarter in the final three months of 2018, retail spending weakened substantially in December and January, and inflation moderated to 1.8% in Q4. The labour market has been one of the few bright spots and the RBA is counting on rising employment to gradually lift wages, which in turn would put upward pressure on consumer prices.
But at the current pace, that could be a very slow process and the best hope for the RBA to meets its economic projections is for China and the US to resolve their trade differences quickly. A trade deal between the US and China would go a long way in boosting investor sentiment globally. Another tailwind for the Australian economy could come from a rebound in Chinese growth even without a trade agreement with the US. Chinese authorities have been pursuing a series of stimulus measures over the past nine months and should those policy steps begin to bear fruit, China’s major trading partners are also likely to benefit from any rebound.
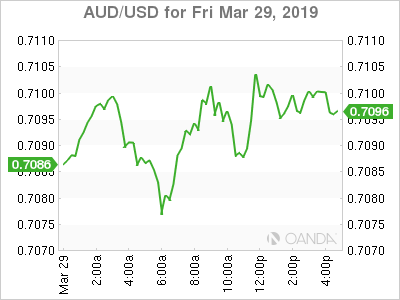
As for the reaction in forex markets, the Australian dollar has already taken a bit of a knock from the Reserve Bank of New Zealand’s decision this week to adopt an easing bias. The move sent the kiwi spiralling downwards and the aussie followed suit, slipping back below the $0.71 level. However, given the RBA’s reluctance to go down the dovish path, keeping the aussie supported, there is plenty more downside scope for the currency should the Bank hint at a rate cut.
The aussie/dollar pair is at the moment being supported by the 38.2% Fibonacci retracement of the upleg from 0.6743 to 0.7295, around 0.7085. Losing this support would pave the way for the 50% Fibonacci at 0.7019, while a sharper sell-off could see the pair heading towards the 61.8% Fibonacci at 0.6954.
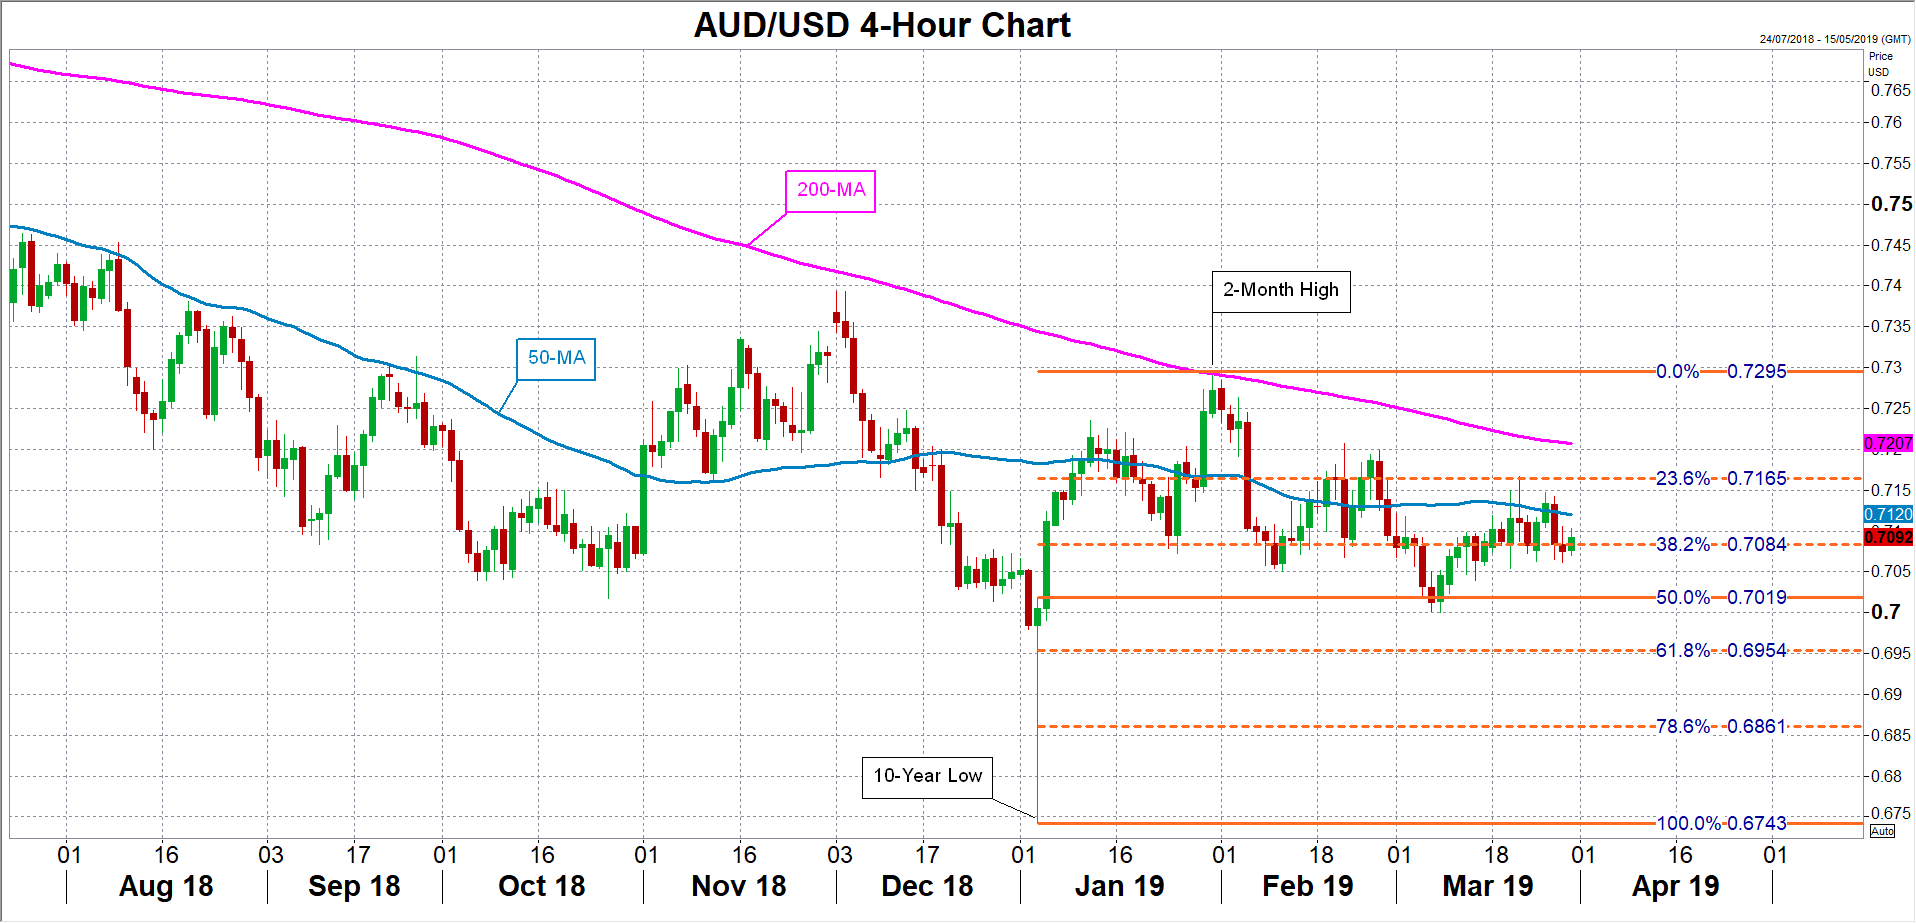
An upside move should not be discounted, however, as the RBA may stubbornly cling on to its relatively upbeat views. The bulls could drive aussie/dollar towards the 23.6% Fibonacci at 0.7165 in such a scenario. But a bigger rally is unlikely given that most investors think it’s only a matter of time before the RBA turns dovish and a strong upward push would probably be thwarted by the 200-period moving average, which currently lies slightly above the 0.72 handle in the 4-hour chart.
GBP/USD Outlook: Sterling Cracked Key Supports after UK Lawmakers Rejected Brexit Plan Again
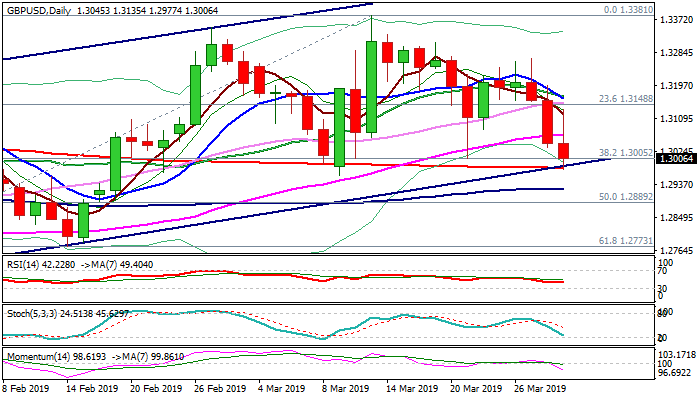
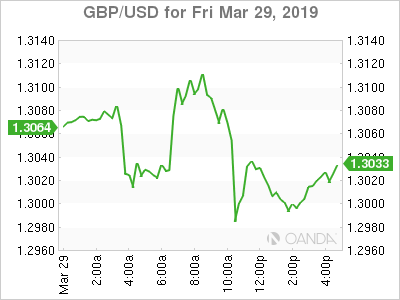
Cable collapsed below 1.30 on Friday and cracked key supports (200SMA/bull-channel support trendline and also pressured the top of thick daily cloud) after UK parliament rejected PM May's deal for the third time. Lawmakers voted 344 against vs 286 for the deal, confirming their previous decisions that the plan is not good enough. Cable moved in a roller-coaster on Friday, as optimistic news boosted pound for over 100-pips advance, but rally quickly changed direction after initial optimism started to fade and accelerated to new low on May's repeated defeat. According to the already known information, the Britain will leave the EU on 12 April, however, the government is expected work on alternative scenarios and possibly bring plan B that will need consensus at home and then to persuade EU members to approve longer extension. UK government will try to buy some time to find workable solution in order to avoid disastrous 12 April no-deal Brexit scenario. Today's attack at 200SMA could generate strong bearish signal on weekly close below, as the moving average kept the downside protected since 19 Feb. Sterling could spiral lower on sustained break as this will also signal break out of bull-channel (uptrend from 2018 low at 1.2476) that would imply the change of the trend. Soured sentiment of Rejection of Brexit plan would add to negative outlook.
Res: 1.3070; 1.3135; 1.3153; 1.3162
Sup: 1.2980; 1.2968; 1.2960; 1.2923