Sample Category Title
Forex Forecast and Cryptocurrencies Forecast
First, a review of last week’s events:
EUR/USD. Despite the decline in the GDP data, the US dollar has felt pretty confident this week. And it’s not the US President, not the Fed, but, first of all, the Prime Minister and the Parliament of Great Britain, who can’t decide how to get out of the stalemate that they themselves have driven, who are the reason.
Naturally, the ambiguity with Brexit could not but put pressure on the European currency, which has been falling all week. And any attempts of the bulls to change the trend rested on the downward resistance line (1.1447-1.1230). And only on Friday, just before the next vote in the British Parliament, did the pair move to a sideways movement. Thus, starting from March 20, it lost about 235 points, fixing the low at the level of 1.1209, very close to a very important support/resistance level of 1.1200;
GBP/USD. It is not for nothing that the ancient Greeks called Britain Foggy Albion. The British managed to let the Brexit procedure go in so much fog that it’s impossible to see the road from the EU even at arm's length.
As of the end of Friday, March 29, we can state the following. Parliament voted three times against the deal with the EU in the Theresa May version. But it voted against withdrawing without any deal at all as well. The country's leadership should formulate further plans until April 12 or withdraw without a deal (but Parliament is against such an exit). Mrs. May is likely to propose an extension of the Brexit procedure based on article 50 of the European Union Treaty. But then the UK will have to participate in the European election, which is again opposed by the parliamentarians.
Europe does not really understand how to act in a situation of such uncertainty either, which is why an emergency EU summit is being convened. And the British pound has so far rolled down to the lower border of the five-week side corridor 1.2960-1.3350, but did not leave it, having fought off later by 55 points up and having completed the five-day period at the level of 1.3030;
USD/JPY. The dollar strengthening and not reducing risk appetites of investors could not but touch the yen. Recall that 15% of the oscillators on H4 and D1 at the end of last week already gave signals this pair had been oversold, which is a fairly accurate precursor of the trend reversal, and graphical analysis indicated a rise in the pair above 110.75. Everything happened according to this scenario: the pair made a throw to the north, rising from the level of 109.70 to 110.90. The final chord sounded at 110.85;
Cryptocurrencies. Our forecast last week said that, amid the absence of serious news, the BTC/USD pair would not fall below $3,900 but would try to overcome resistance in the $4,200 zone. That's exactly what happened. Having fixed the low at $3,938 on Monday March 25, the pair turned around and was moving upward for all the remaining days, reaching $4,190 by Friday and thus completing the two-week cycle almost at the same place where it began.
Following Bitcoin, Ethereum (ETH/USD) and Litecoin (LTC/USD) demonstrated similar dynamics, having gained almost 100% of their recent losses. And it was only Ripple (XRP/USD) that could not return to the March 16 high, $0.328, and stopped a little below its 10-week Pivot Point $0.318.
As for the forecast for the coming week, summarizing the opinions of a number of analysts, as well as forecasts made on the basis of a variety of methods of technical and graphical analysis, we can say the following:
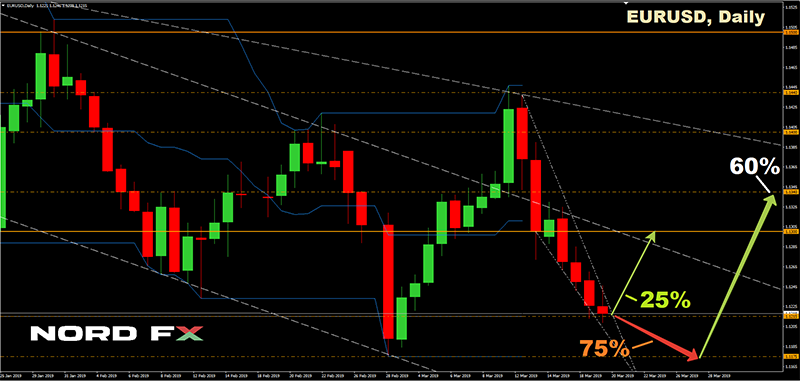
EUR/USD. If the pair overcomes the support level of 1.1200, it will be able to continue moving down. 75% of analysts, 100% of trend indicators and 90% of oscillators on H4 and D1 agree with this. The closest goal is the low of 2018-19, recorded on March 7,1.1175. The following support is located 50 points below.
But, despite this seemingly clear advantage of the bulls, not everything is so straightforward. Already now, 10% of oscillators signal the pair. is oversold. Graphic analysis on D1 also indicates that it will not be able to overcome such a strong support as 1.1175 and will return to the horizon 1.1340. In the medium term, 60% of experts agree with the return to the area of 1.1300-1.1500.
As for economic events, one should pay attention to the publication of statistics on the consumer market in the Eurozone and the United States on Monday, April 1, as well as data on the US labor market (including NFP), which will be released on Friday, April 5. Analysts expect the number of new jobs created outside the agricultural sector to rise sharply in March compared with February, from 20K to 175K, even though the growth of the average wage will remain at the same level. Such data should strengthen the dollar, but it must be borne in mind that the market very often takes these forecasts into account in advance in its quotes.
GBP/USD. At the time of writing, the forecast for this pair is almost one-to-one similar to the forecast for EUR/USD. This also applies to the bearish attitude of 75% of the experts, and the red color of the indicators. In addition to the fog with Brexit, the UK has a very serious trade deficit, the interest rate is low, and the pound is subject to great risks, which is why investors avoid investing in the British economy.
The pound finished the week close to the strong support/resistance level of 1.3000. But, unlike the euro, it is still far away from the lows of 2018-2019. So, a breakthrough below 1.3000 opens the way for the pound to supports 1.2830 and 1.2770.
The similarity with the euro this week concerns both the bearish and the bullish scenarios. Here, oversold signals are signaled by 10% of oscillators, and graphical analysis shows that, after having fallen to 1.2960, the pair will turn up and head towards the center of the five-week side corridor 1.2960-1.3350 in the 1.3150 zone;
USD/JPY. The upcoming movement of this pair can be limited to the channel 109.70-112.15. The pair is practically in its center at the moment, and the only question is where it will move now, down or up.
Most trend indicators and oscillators look to the north at H4, while at D1 they take a neutral position. At the same time, 15% of oscillators on H4 indicate that the pair is overbought.
As for analysts, 65% of them, supported by graphical analysis on H4, have sided with the bears. And 35%, along with graphical analysis on D1, give victory to the bulls;
Cryptocurrencies. Since December 15 last year, the total capitalization of the crypto market has grown by almost 40%, reaching a high of $143.366 billion on Wednesday, March 27. This is undoubtedly a good sign and gives hope that the Bitcoin will manage to overcome the resistance of $4,200 and gain a foothold in the range of $4,200-4,280. Almost 65% of experts agree with this forecast. The next target for the bulls is the zone 4,365-4,385, where the highs of November-December 2018 are located. However, we recall that in the transition to the medium-term forecast, the balance of power changes, and here, as before, 70% of analysts side with the bears, voting for the reduction of the pair to the $3,000 mark.
EUR/USD Weekly Outlook
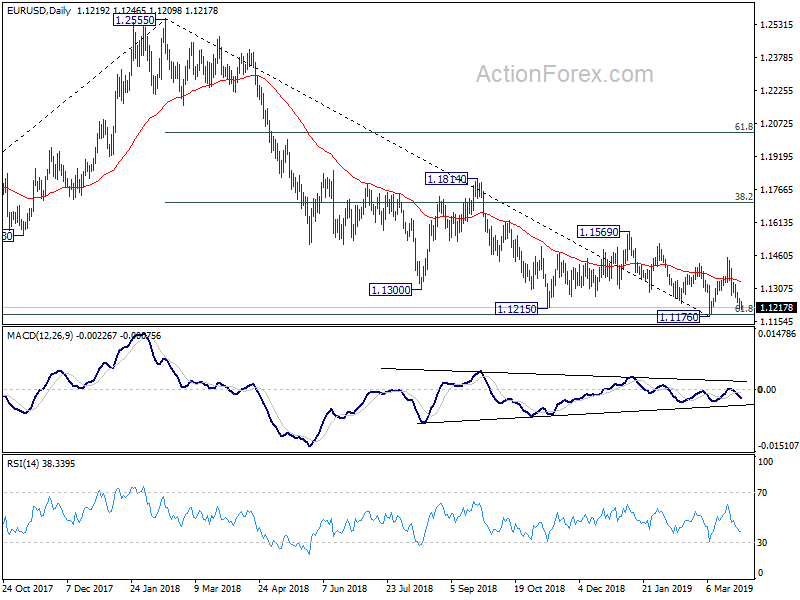
EUR/USD's decline from 1.1448 extended lower last week. Despite loss of downside momentum as seen in 4 hour MACD, further decline is expected this week as long as 1.1285 minor resistance holds. Focus remains on 1.1176 low and decisive break there will resume whole decline from 1.2555. On the upside, however, break of 1.1285 minor resistance will turn bias back to the upside for 1.1448 instead.
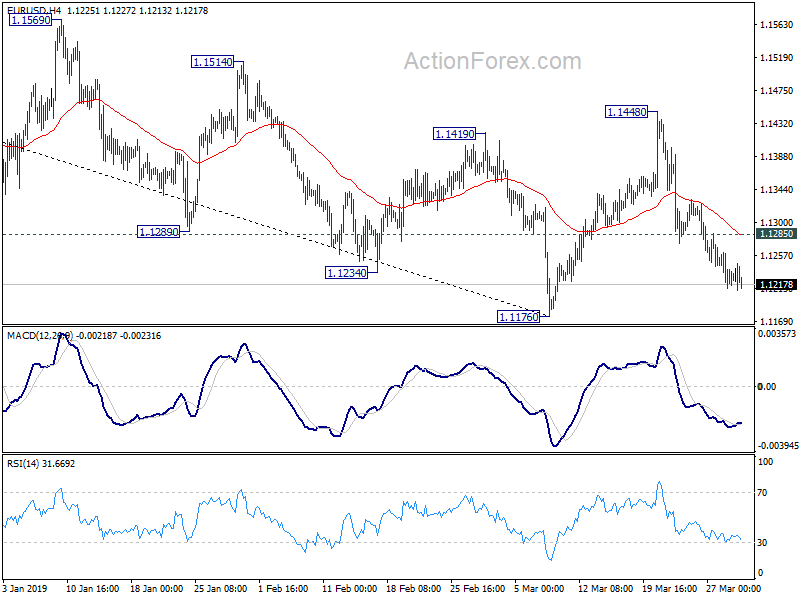
In the bigger picture, medium term weakness was revived as the weak rebound from 1.1176 was rejected well below 55 week EMA and failed to sustain above 55 day EMA. Focus is back on 1.1176 low, with 61.8% retracement of 1.0339 (2016 low) to 1.2555 (2018 high) at 1.1186. Decisive break there will resume whole down trend from 1.2555. Such decline target 1.0339 low next. On the upside, firm break of 1.1569 resistance is needed to be the first sign of medium term bottoming. Otherwise, downside breakout will be in favor.
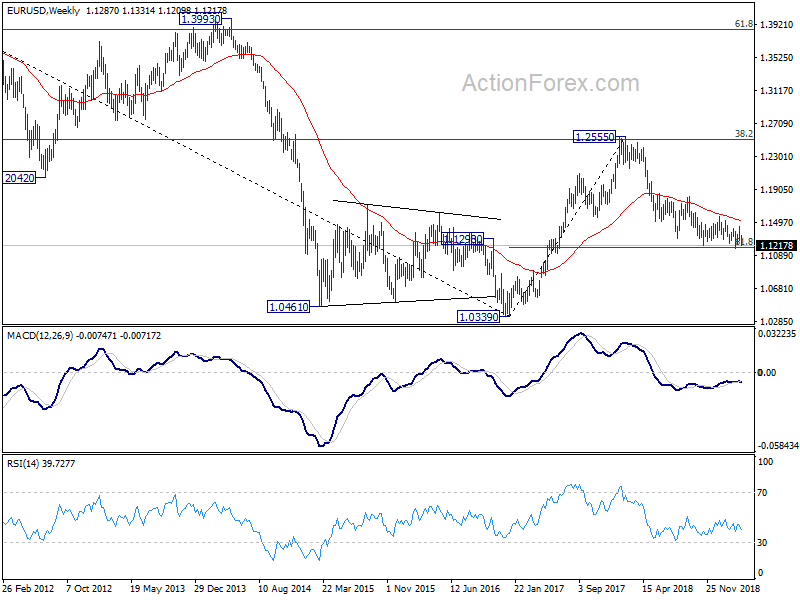
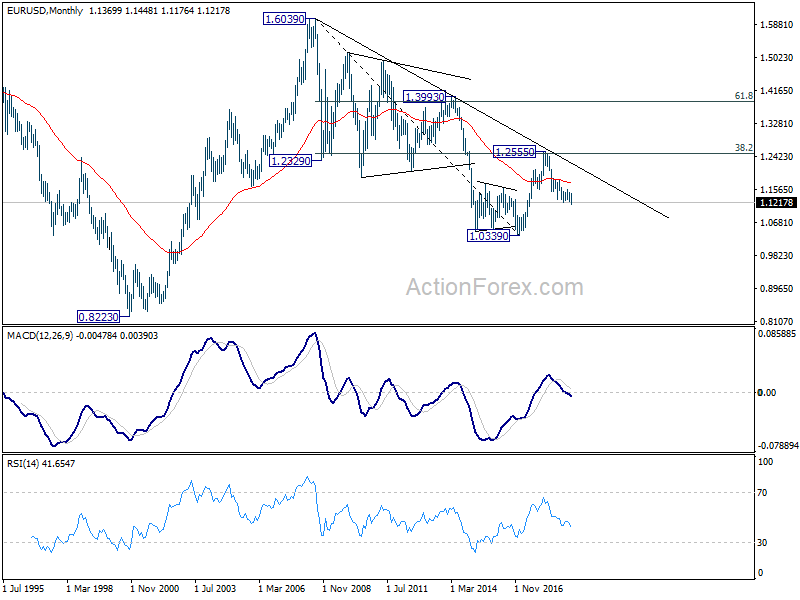
In the long term picture, the rejection from 38.2% retracement of 1.6039 to 1.0339 at 1.2516 argues that long term down trend from 1.6039 (2008 high) might not be over yet. EUR/USD is also held below decade long trend line resistance. Firm break of 61.8% retracement of 1.0339 to 1.2555 at 1.1186 should at least bring a retest on 1.0339 low. This will remain the favored case as long as 1.1569 resistance holds.
USD/JPY Weekly Outlook
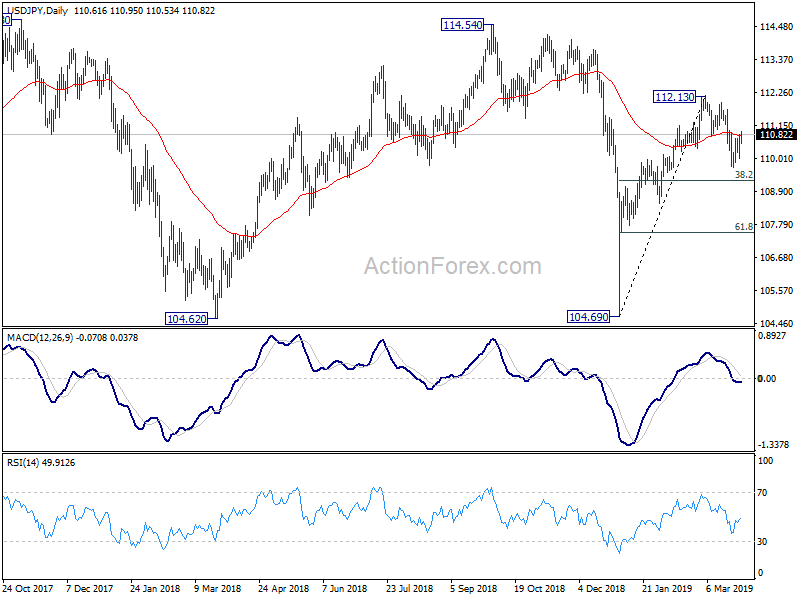
USD/JPY edged lower to 109.71 last week but recovered. But upside was limited below 110.95 minor resistance so far. Initial bias stays neutral this week first. On the upside, break of 110.95 will argue that the pull back from 112.13 has completed at 109.17. In this case, intraday bias will be turned back to the upside for retesting 112.13. On the downside, break of 109.71 will resume the decline from 112.13 to 38.2% retracement of 104.69 to 112.13 at 109.28. Break of 109.28 will target 61.8% retracement at 107.53 next.
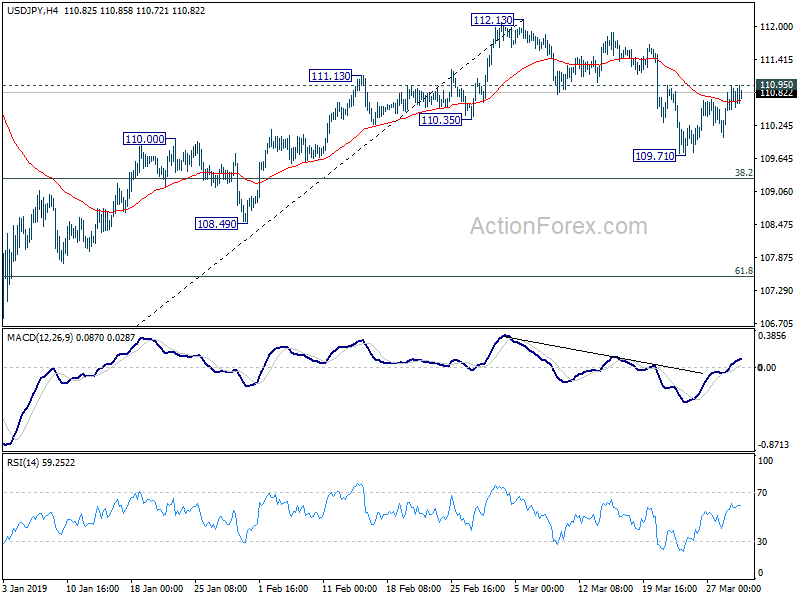
In the bigger picture, while the rebound from 104.69 was strong, USD/JPY failed to sustain above 55 week EMA (now at 110.80), and was kept well below 114.54 resistance. Medium term outlook is turned mixed and we'll wait for the structure of the fall from 112.13 to unveil to make an assessment later. For now, more range trading is expected between 104.69 and 112.13 first.
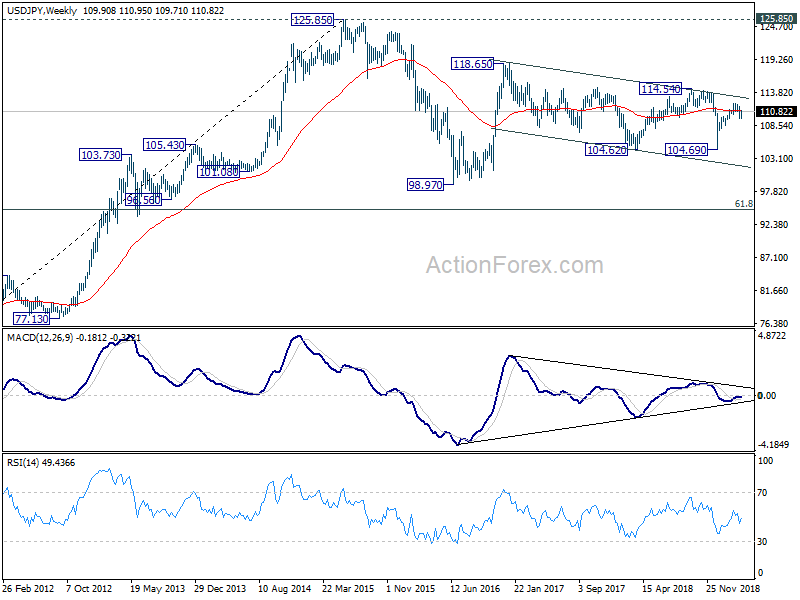
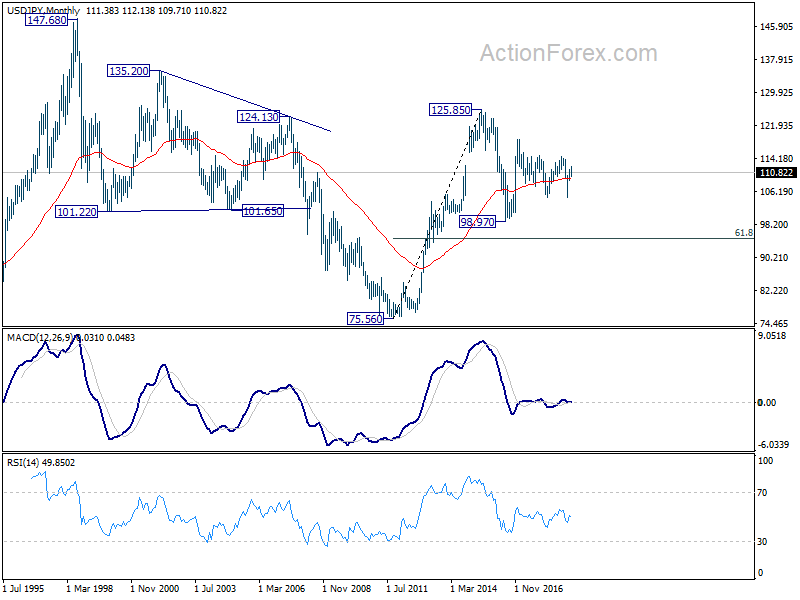
In the long term picture, the rise from 75.56 (2011 low) long term bottom to 125.85 (2015 high) is viewed as an impulsive move, no change in this view. Price actions from 125.85 are seen as a corrective move which could still extend. In case of deeper fall, downside should be contained by 61.8% retracement of 75.56 to 125.85 at 94.77. Up trend from 75.56 is expected to resume at a later stage for above 135.20/147.68 resistance zone.
GBP/USD Weekly Outlook
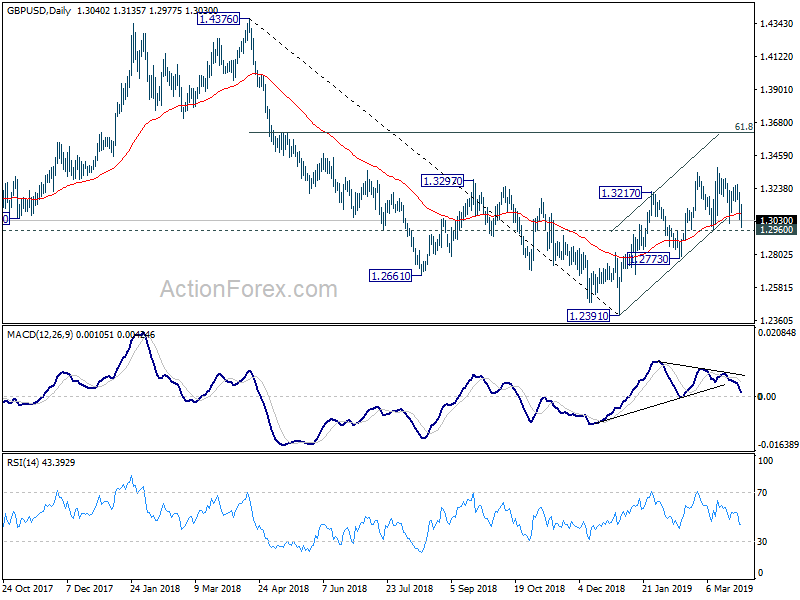
GBP/USD gyrated lower last week but stayed above 1.2960 support. Initial bias remains neutral first and more sideway trading could be seen. As long as 1.2960 support holds, further rise is mildly in favor. On the upside, firm break of 1.3381 will target 61.8% retracement of 1.4376 to 1.2391 at 1.3618 next. However, on the downside, firm break of 1.2960 will indicate that rebound from 1.2391 has completed earlier than expected. Deeper fall would then be seen to 1.2773 support for confirmation.
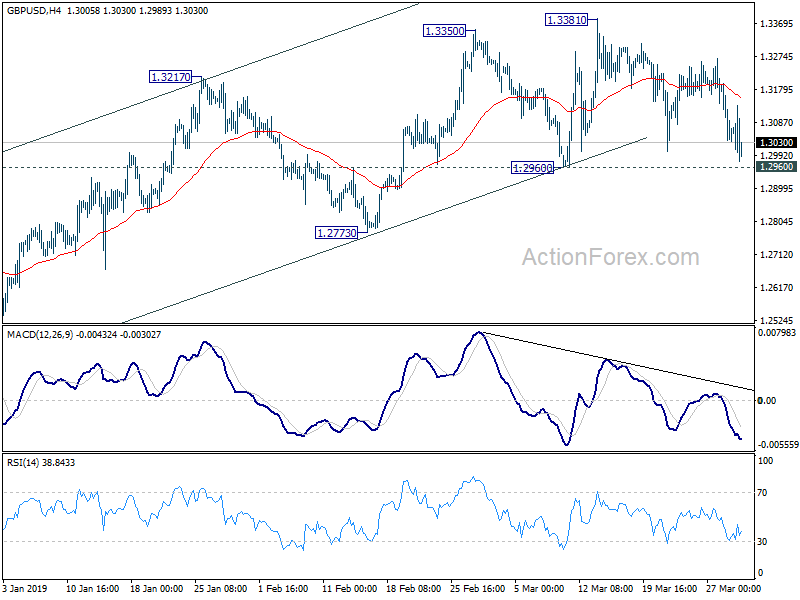
In the bigger picture, medium term decline from 1.4376 (2018 high) should have completed at 1.2391. Rise from 1.2391 is seen as the third leg of the corrective pattern from 1.1946 (2016 low). Further rise could be seen through 1.4376 in medium term. On the downside, though, break of 1.2773 support will dampen this view. Focus will be turned back to 1.2391 low and break will resume the fall from 1.4376 to 1.1946.
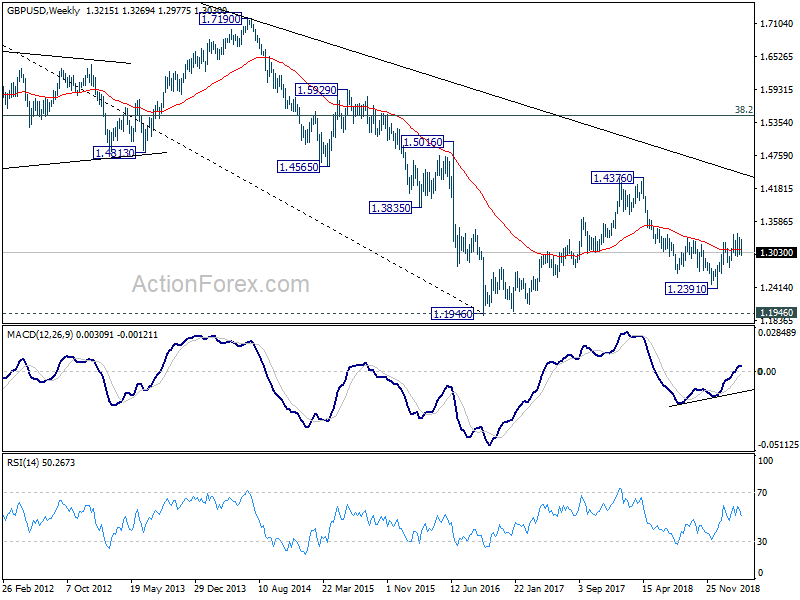
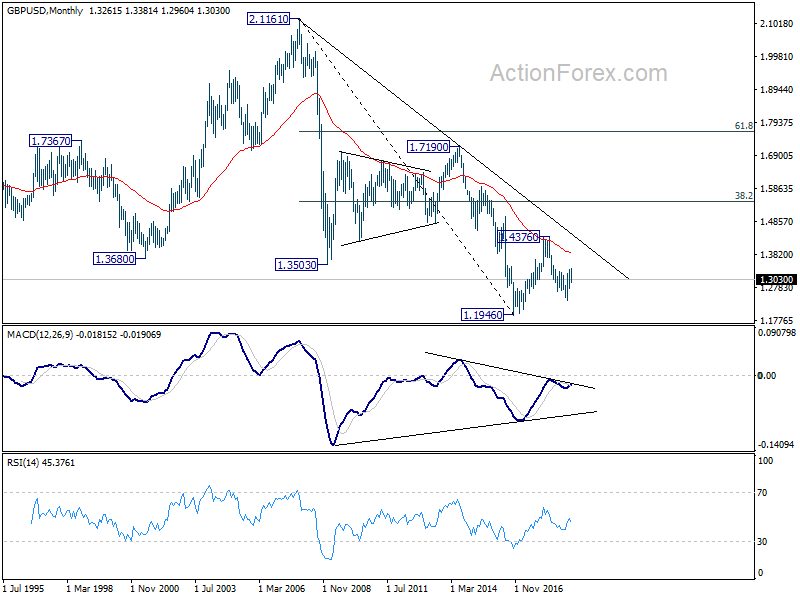
In the longer term picture, current development argues that corrective pattern from 1.1946 (2016 low) is extending with another rise. But there is no change in the long term bearish outlook as long as 38.2% retracement of 2.1161 (2007 high) to 1.1946 at 1.5466 holds. An eventual downside breakout through 1.1946 is still in favor in the long term.
USD/CHF Weekly Outlook
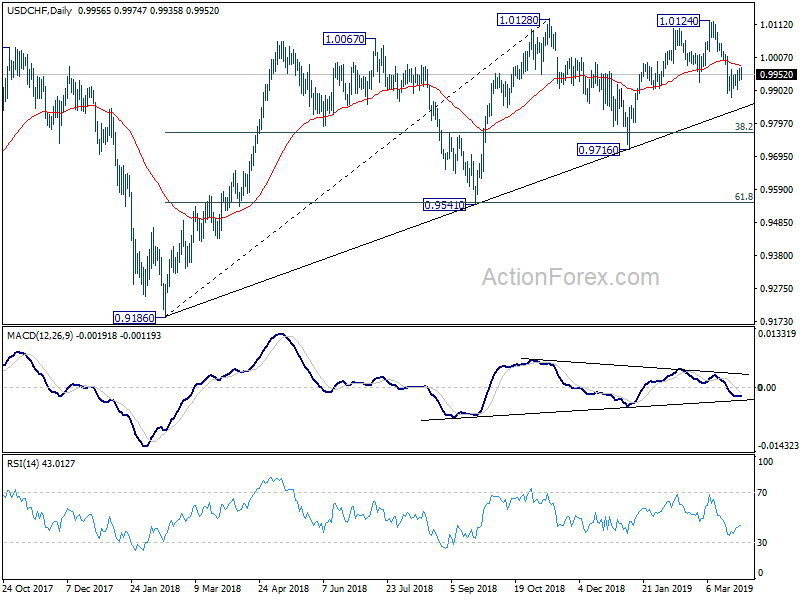
USD/CHF stayed in consolidation above 0.9879 last week and outlook is unchanged. Initial bias remains neutral this week first. As long as 1.0010 resistance holds, further decline remains in favor. On the downside, below 0.9879 will resume the fall from 1.0124 to 0.9716 key support. Nevertheless, break of 1.0010 will turn bias back to the upside for 1.0124/28 resistance zone.
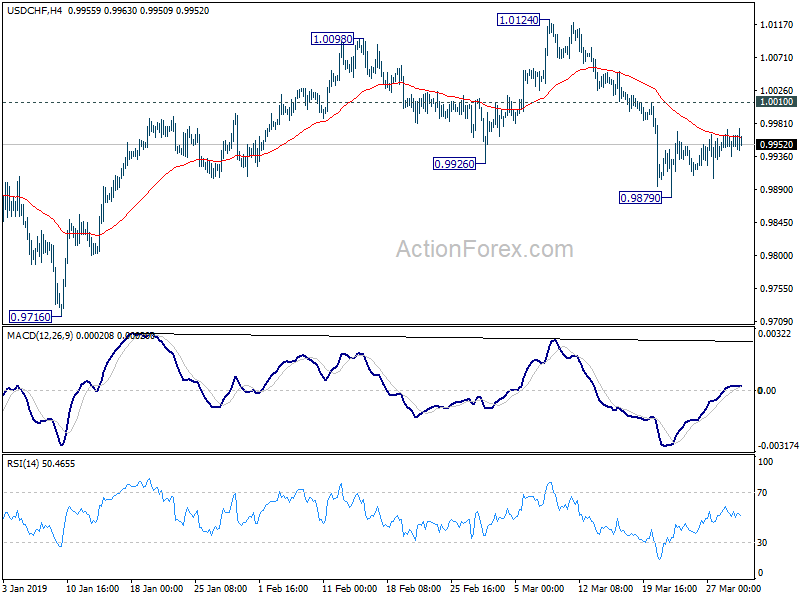
In the bigger picture, focus is back on medium term trend line (now at 0.9849). Decisive break there will argue that whole rise from 0.9186 has completed. Further break of 0.9716 will confirm reversal and target next support level at 0.9541. Nevertheless, there is still a chance that price action from 1.0128 are forming a consolidative pattern with fall from 1.0124 as third leg. If this is the case, stronger support should be seen between 0.9716 and the trend line to contain downside.
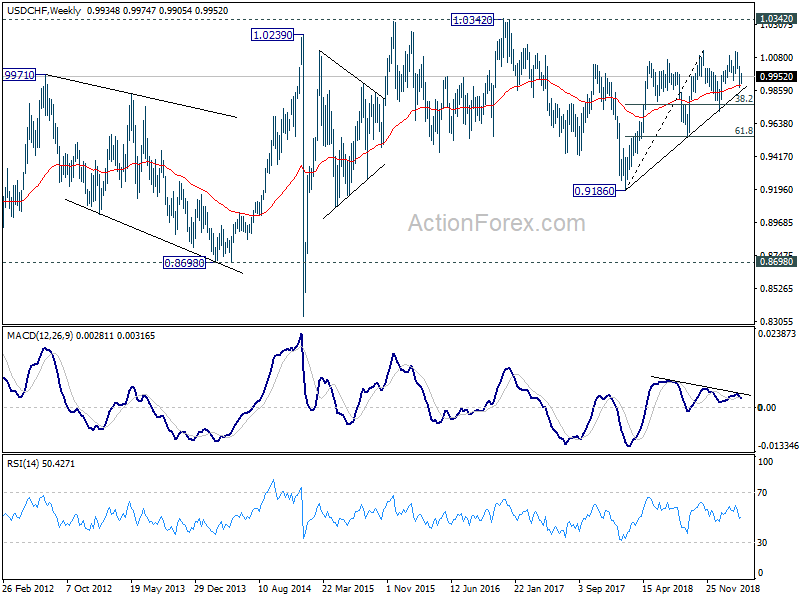
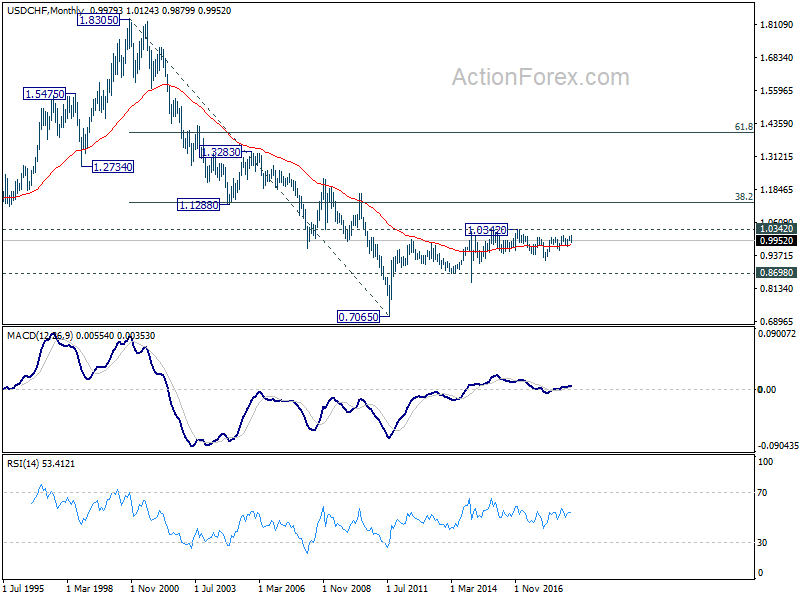
In the long term picture, price actions from 0.7065 (2011 low) are not clearly impulsive yet. Thus, we'll treat it as developing into a corrective pattern, at least, until a firm break of 1.0342 resistance.
AUD/USD Weekly Outlook
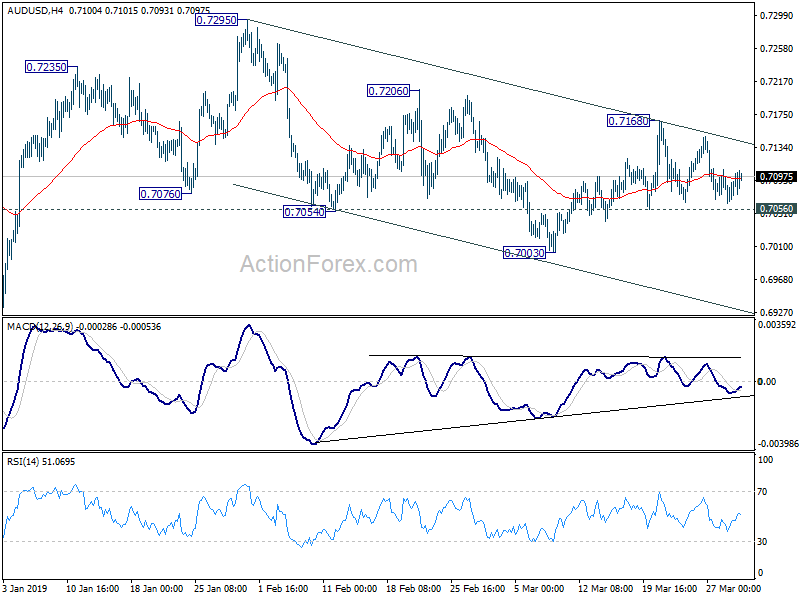
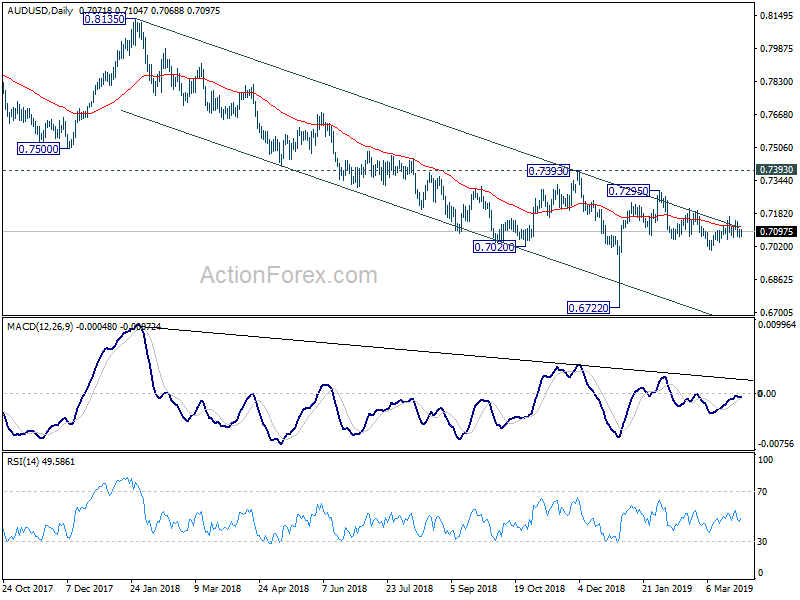
AUD/USD gyrated in range of 0.7056/7168 last week and outlook is unchanged. Initial bias remains neutral this week first. On the downside, break of 0.7056 minor support will turn bias to the downside for 0.7003 first. Break will resume the whole decline from 0.7295. On the upside above 0.7168 will resume the rebound from 0.7003 towards 0.7295 high instead.
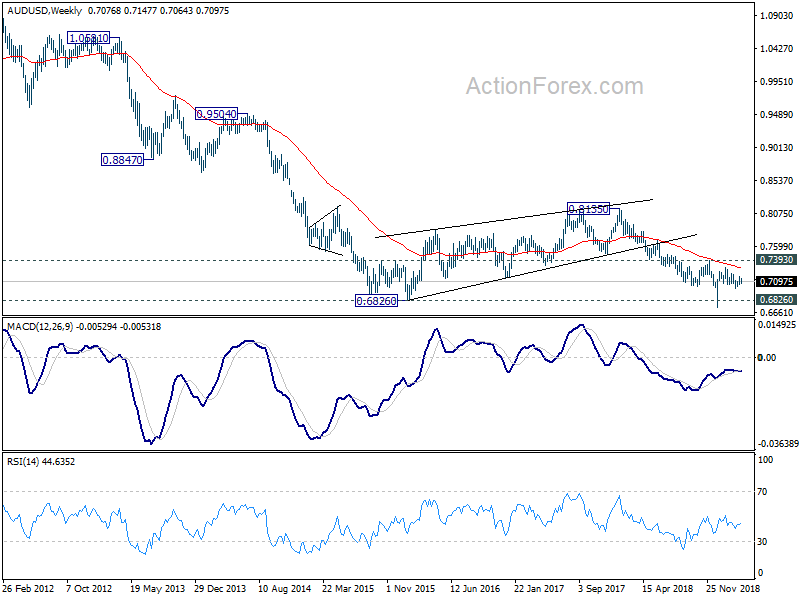
In the bigger picture, as long as 0.7393 resistance holds, we'd treat fall from 0.8135 as resuming long term down trend from 1.1079 (2011 high). Decisive break of 0.6826 (2016 low) will confirm this bearish view and resume the down trend to 0.6008 (2008 low). However, firm break of 0.7393 will argue that fall from 0.8135 has completed. And corrective pattern from 0.6826 has started the third leg, targeting 0.8135 again.
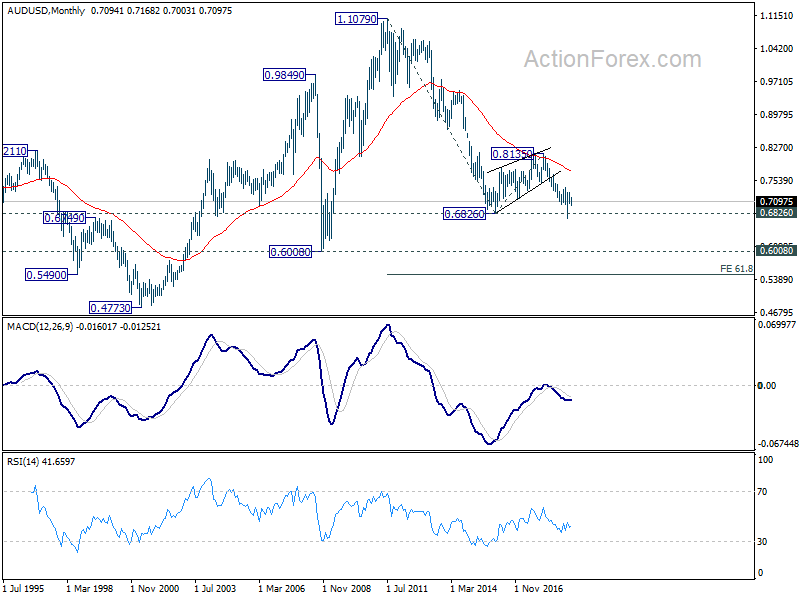
In the longer term picture, prior rejection by 55 month EMA maintained long term bearishness in AUD/USD. That is, down trend from 1.1079 (2011 high) is still in progress. Sustained break of 0.6826 will target 0.6008 low and then 61.8% projection of 1.1079 to 0.6826 from 0.8135 at 0.5507.
USD/CAD Weekly Outlook
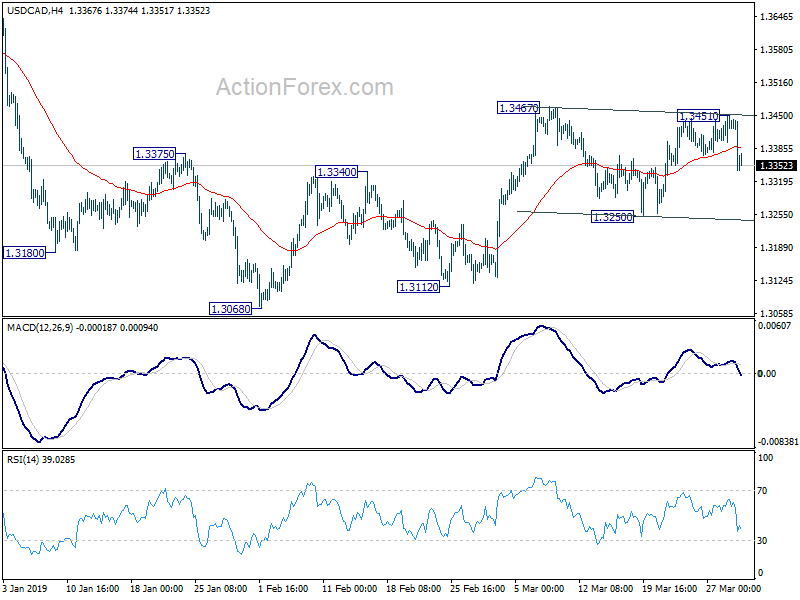
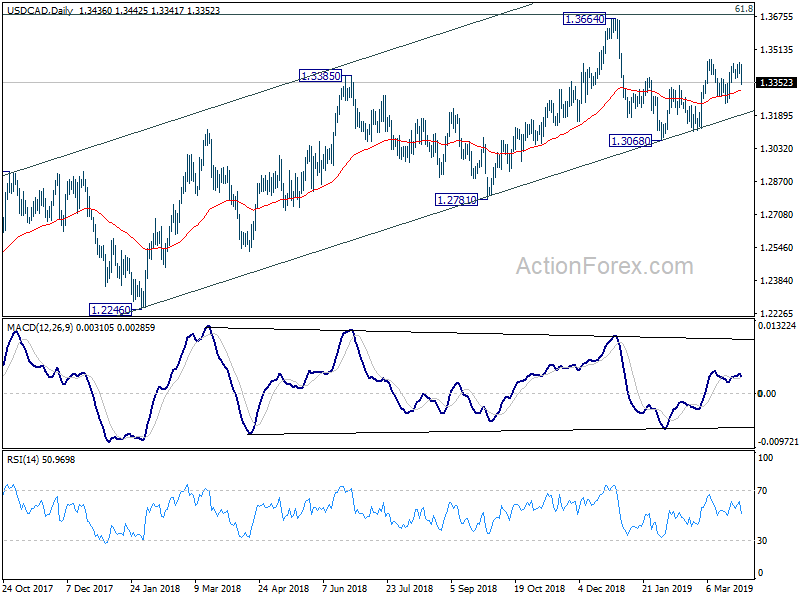
USD/CAD rebounded to 1.3451 last week but failed to break through 1.3467 resistance and reversed. Initial bias is back on the downside this week for 1.3250 support. Firm break there will indicate completion of whole rebound from 1.3068. In that case, deeper fall would be seen back to 1.3068/3112 support zone. On the upside, break of 1.3467 will resume the rebound from 1.3068 and target a test on 1.3664 high.
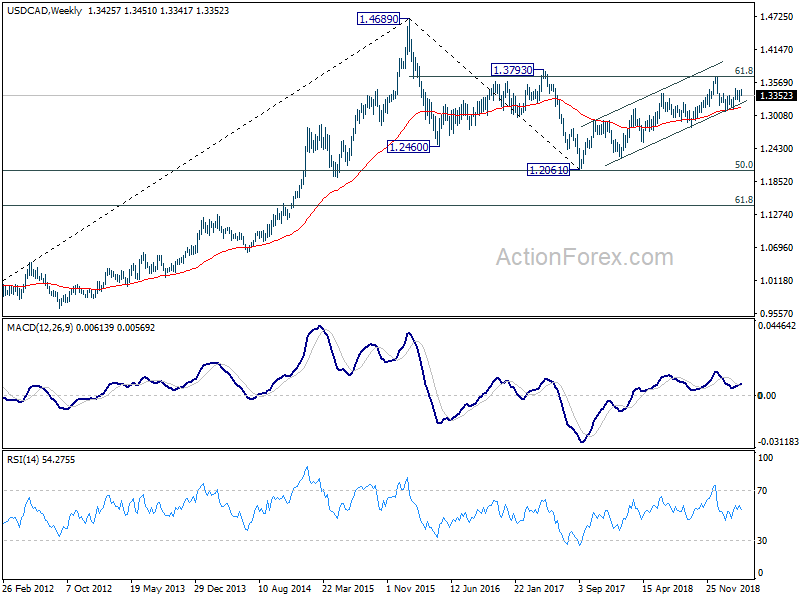
In the bigger picture, structure of the medium term rise from 1.2061 (2017 low) to 1.3664 is not clearly impulsive. Hence, we'd stay cautious on strong resistance from 61.8% retracement of 1.4689 (2016 high) to 1.2061 at 1.3685 and 1.3793 resistance to limit upside, and bring medium term topping. But in any case, medium term outlook will stay bullish as long as channel support (now at 1.3210) holds. Sustained break of 1.3793 will pave the way to retest 1.4689 (2015 high). However, firm break of the channel support should confirm reversal and target 1.2061 low again.
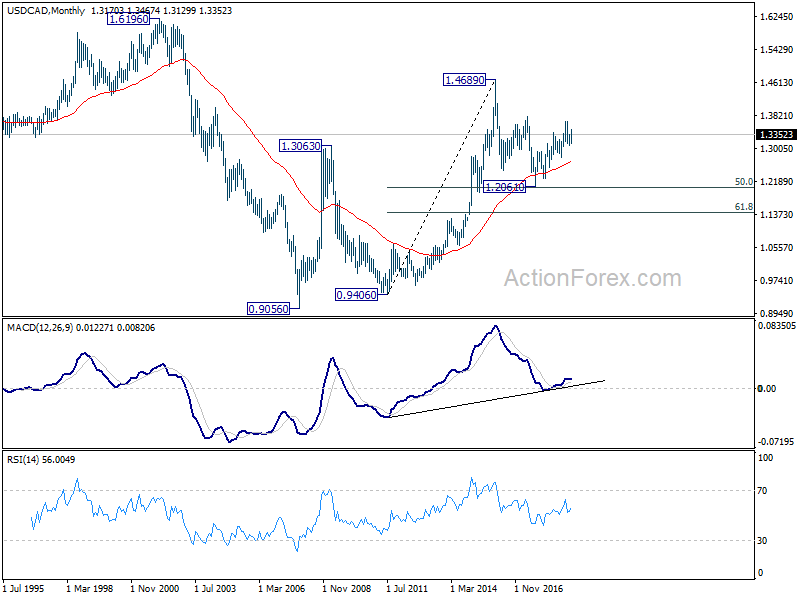
In the longer term picture, corrective fall from 1.4689 (2015 high) should have completed with three waves down to 1.2061, just ahead of 50% retracement of 0.9406 (2011 low) to 1.4689 (2015 high) at 1.2048. The development keeps long term up trend from 0.9406 and that from 0.9056 (2007 low) intact. For now, there is still prospect of extending the long term up trend through 1.4689.
GBP/JPY Weekly Outlook
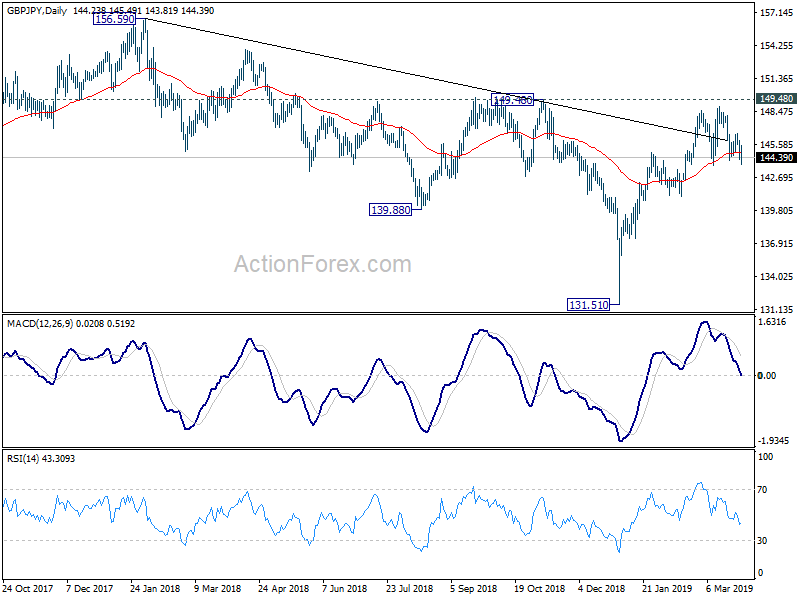
GBP/JPY gyrated lower last week but stayed above 143.72 support. Initial bias remains neutral this week first and some more consolidation could be seen. On the downside, sustained break of 143.72 will indicate near term reversal, after rejection by 149.48 key resistance. In that case, intraday bias will be turned to the downside for 141.00 support first. On the upside, decisive break of 149.48 key resistance will carry larger bullish implication and target 156.58 resistance next.
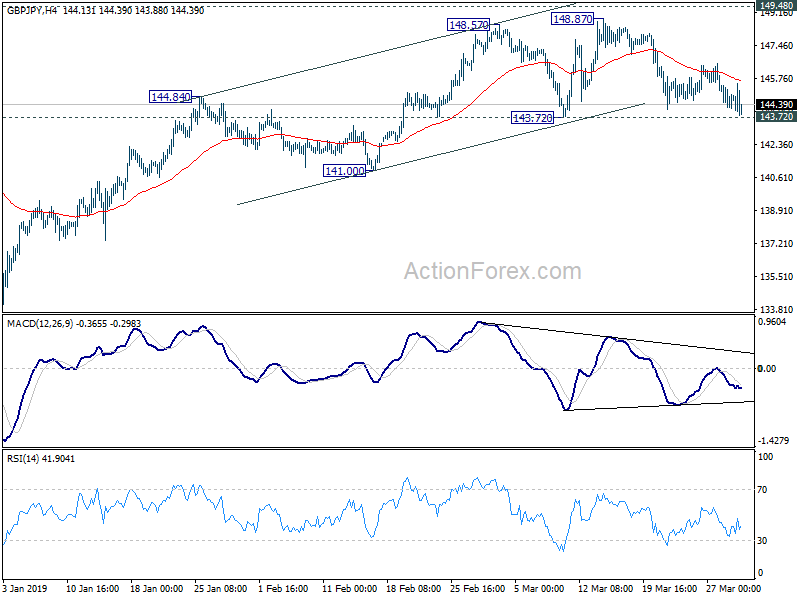
In the bigger picture, focus is now staying on 149.98 key resistance. Decisive break there should confirm that medium term fall from 156.59 (2018 high) has completed at 131.51 already. Rise from 131.51 is then seen as the third leg of the corrective pattern from 122.36 (2016 low). GBP/JPY should then target 156.59 and above. However, rejection by 149.98 will retain medium term bearishness and could extend the fall from 156.59 through 131.51 to 122.36.
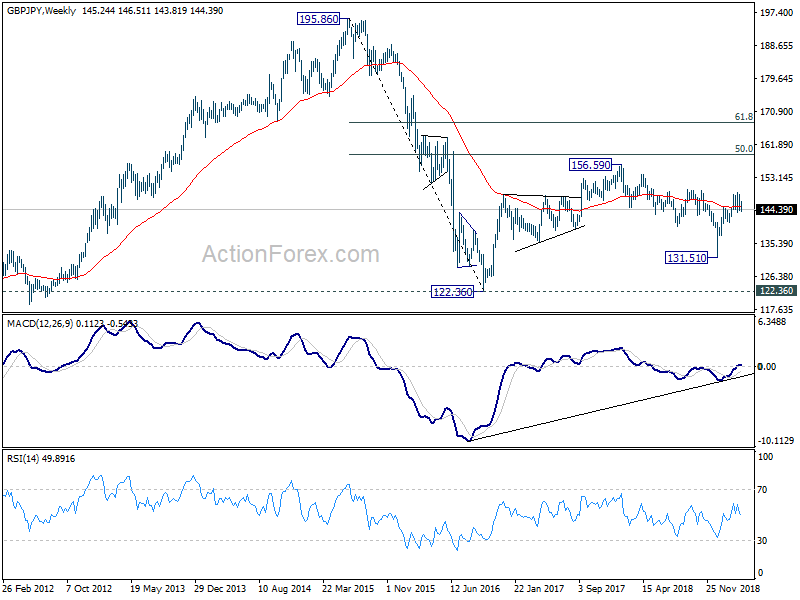
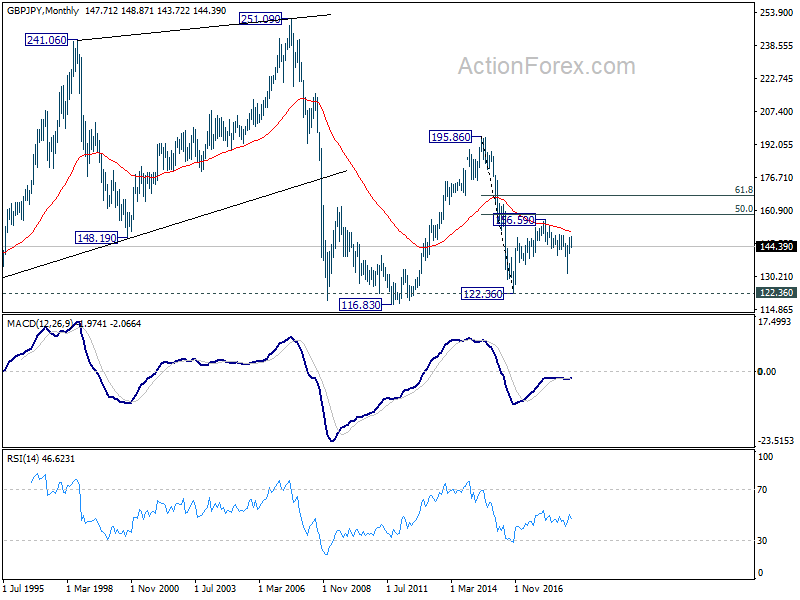
In the longer term picture, the rise from 122.36 (2016 low) to 156.59 (2018 high) doesn't display a clear impulsive structure. Thus, we're treating price actions from 122.36 as a corrective pattern. In case of an extension, strong resistance is likely to be seen at 50% retracement of 195.86 (2015 high) to 122.36 at 159.11 to limit upside. On the downside, break of 131.51 support will bring 122.26 low back into focus.
EUR/JPY Weekly Outlook
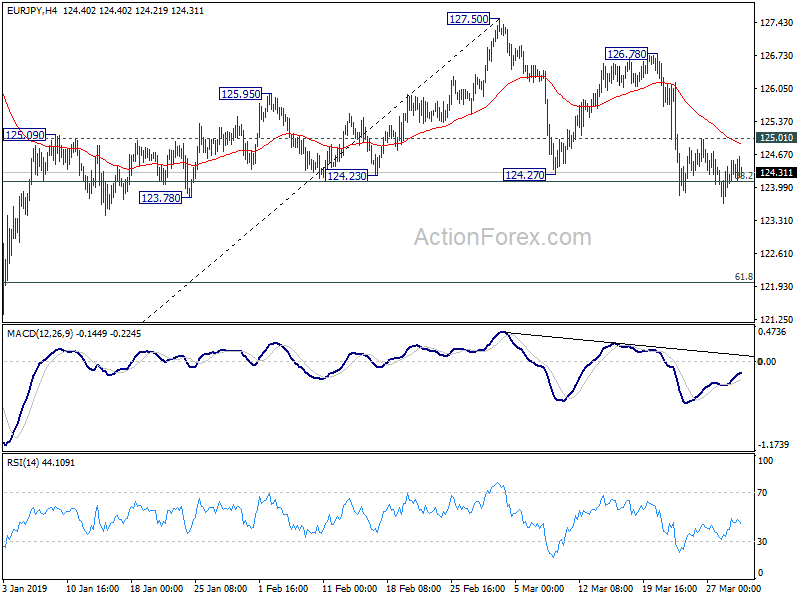
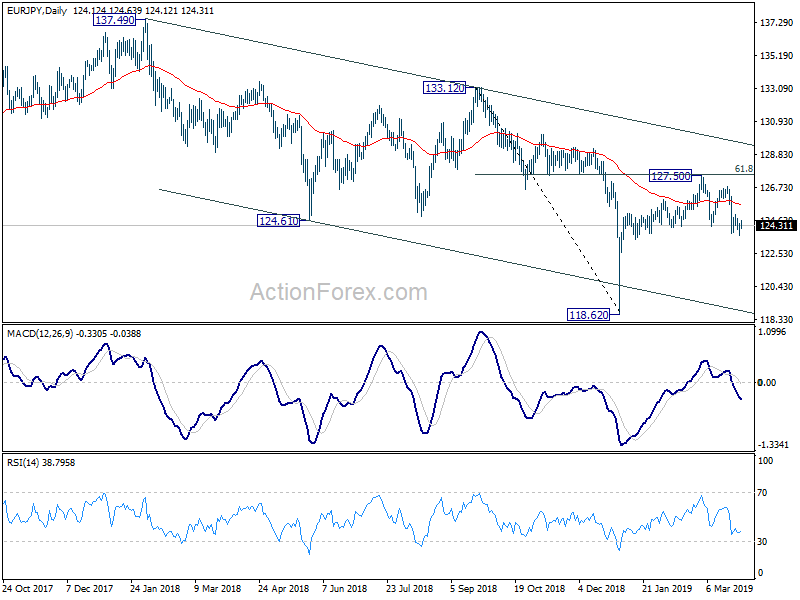
EUR/JPY edged lower to 123.65 last week but lacked follow through selling. Downside momentum is also weak as seen in 4 hour MACD. Nonetheless, further decline is expected as long as 125.01 resistance holds. Decline from 127.50 should extend to 61.8% retracement of 118.62 to 127.50 at 122.01. However, break of 125.01 will turn bias back to the upside for 126.78/127.50 resistance zone.
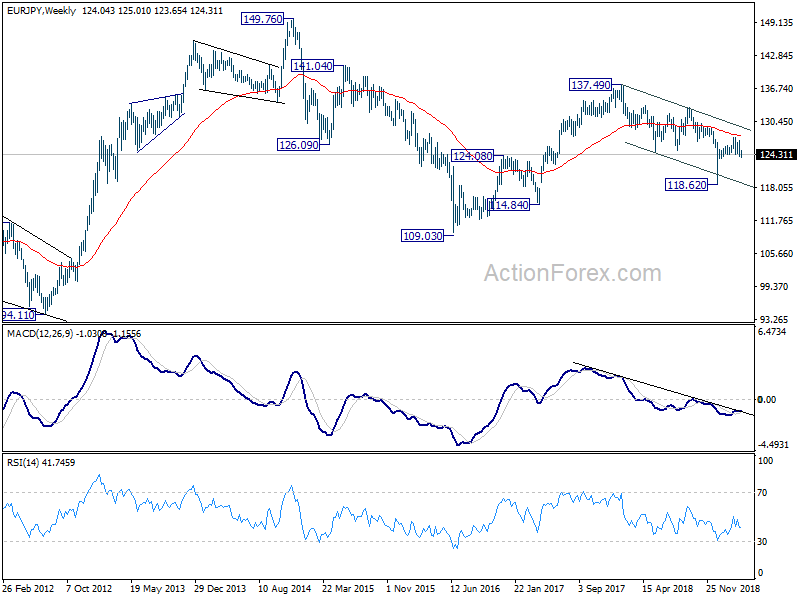
In the bigger picture, rebound from 118.62 might have completed earlier than expected at 127.50. EUR/JPY is held well inside medium term falling channel, and below 55 week EMA (now at 127.73). That is, the down trend from 137.49 (2018 high) might still be in progress. Break of 118.62 will target 109.03/114.84 long term support zone. On the upside, however, break of 127.50 will extend the rebound from 118.62 to 133.12 key resistance instead.
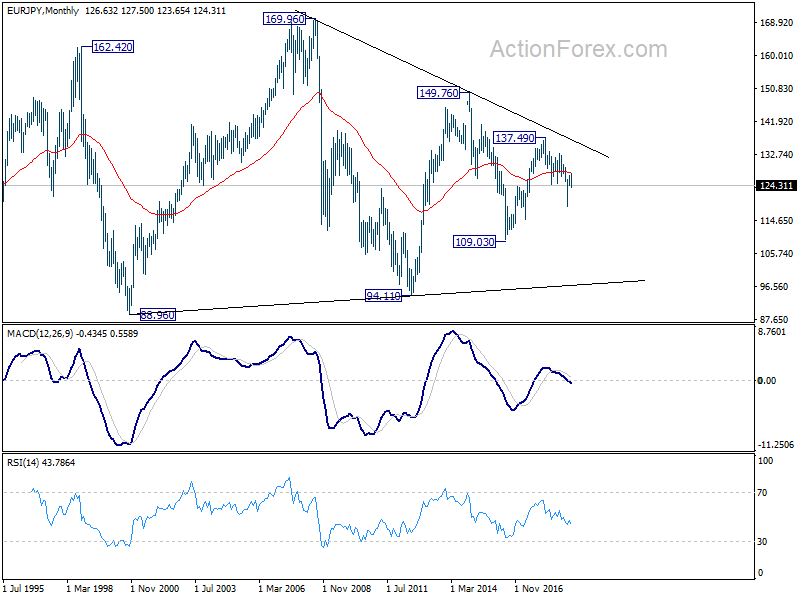
In the long term picture, EUR/JPY is staying in long term sideway pattern, established since 2000. Fall from 137.49 is seen as a falling leg inside the pattern. Break of 118.62 will extend this falling leg through 109.03 low. On the upside, break of 133.12 resistance bring retest of 149.76 (2014 high).
EUR/GBP Weekly Outlook
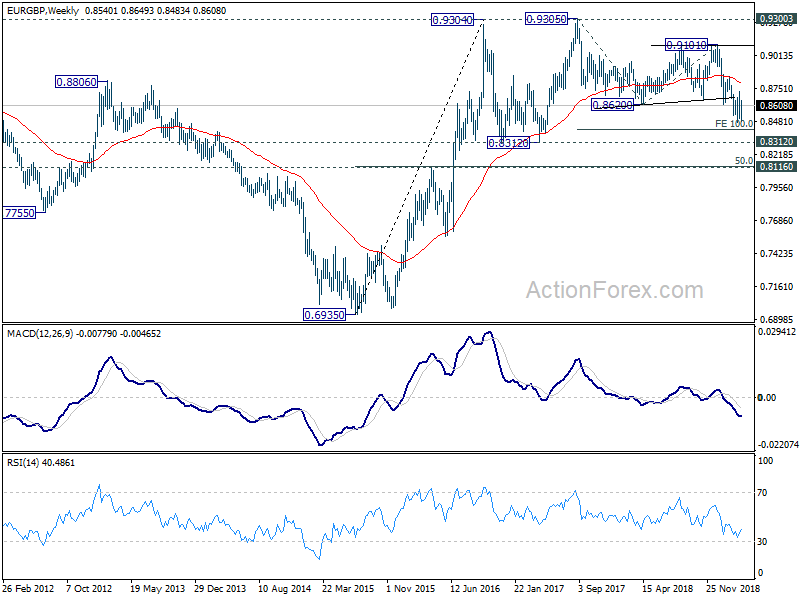
EUR/GBP stayed in consolidation between 0.8474/8722 last week and outlook is unchanged. Initial bias remains neutral this week first. Near term outlook remains bearish as long as 0.8722 resistance holds. On the downside, break of 0.8474 will resume larger down trend for 0.8416 long term projection next. On the upside, though, break of 0.8722 will resume the rebound from 0.8474 to 0.8840 resistance first.
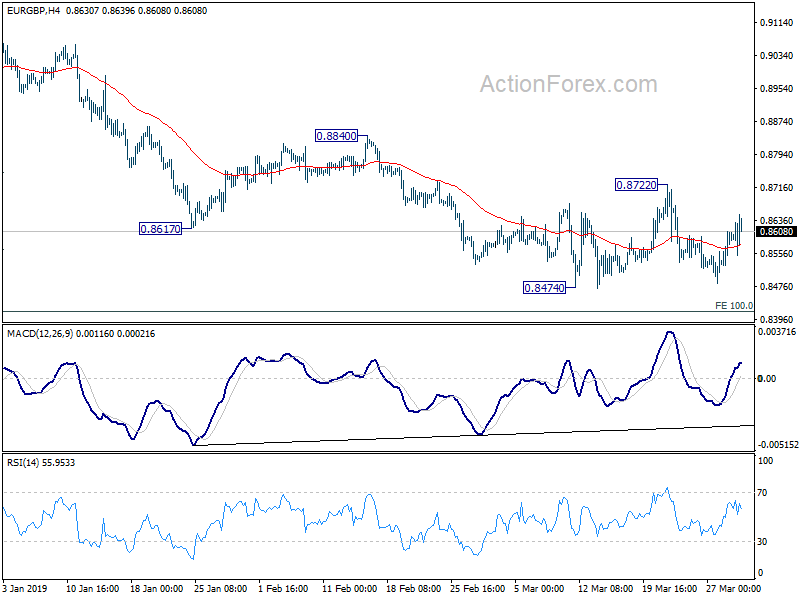
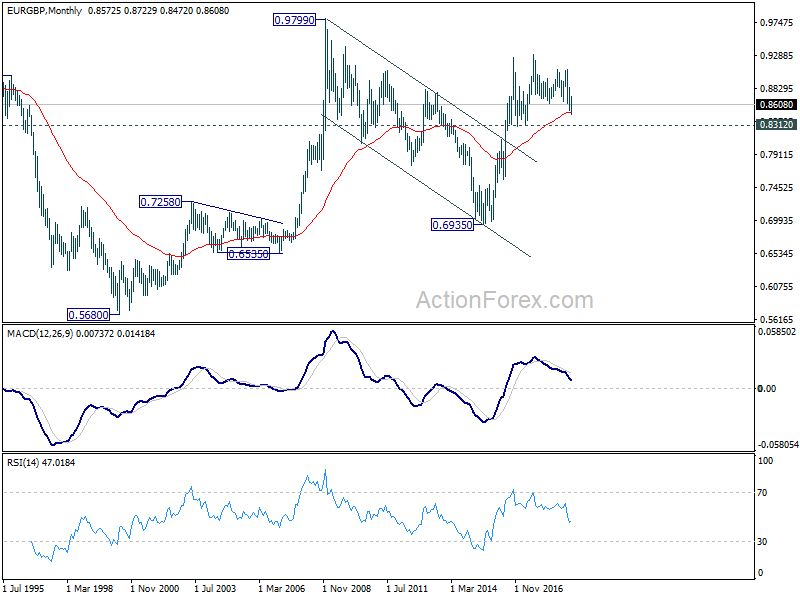
In the bigger picture, EUR/GBP is seen as staying in long term range pattern started at 0.9304 (2016 high). Current fall from 0.9305 (2017 high), is a falling leg inside the pattern. Such decline could extend to 100% projection of 0.9305 to 0.8620 from 0.9101 at 0.8416 and possibly below. But for now, we'd expect strong support around 0.8312 support to contain downside and bring rebound.
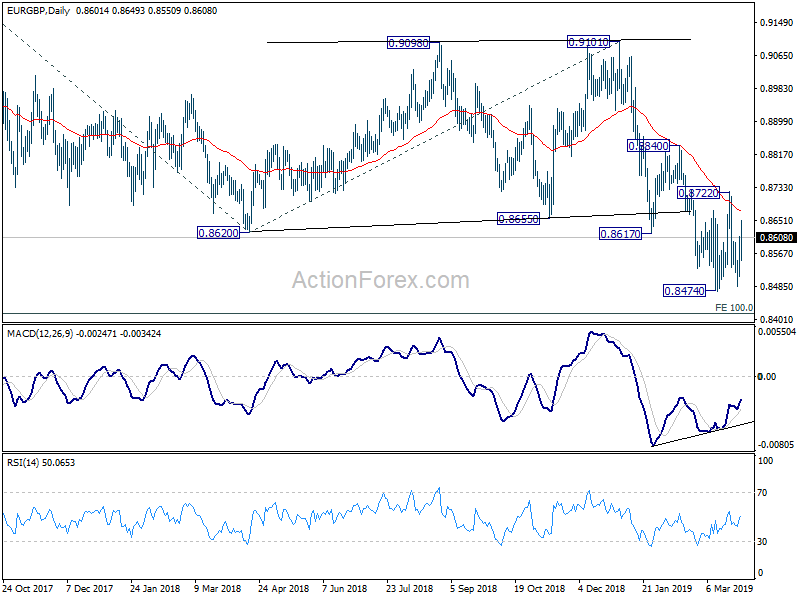
In the long term picture, we're holding on to the view that rise from 0.6935 (2015 low) is resuming the up trend from 0.5680 (2000 low). As long as 50% retracement of 0.6935 to 0.9304 at 0.8120 holds, further rise should be seen through 0.9305 to 0.9799 and above down the road.