Sample Category Title
AUD/USD Daily Outlook
Daily Pivots: (S1) 0.7064; (P) 0.7092; (R1) 0.7108; More...
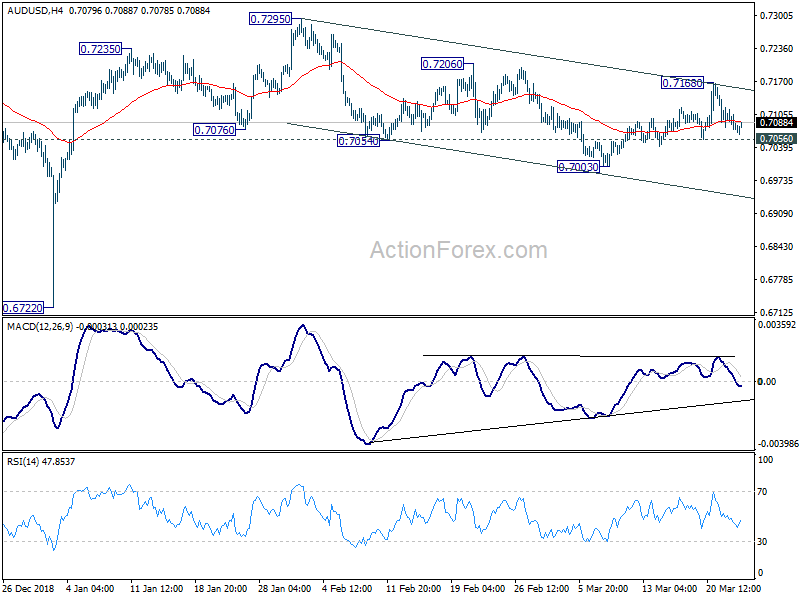
Intraday bias in AUD/USD remains neutral at this point, with focus on 0.7056 minor support. On the downside, break of 0.7056 minor support will turn bias to the downside for 0.7003 first. Break will resume the whole decline from 0.7295. On the upside above 0.7168 will resume the rebound from 0.7003 towards 0.7295 high instead.
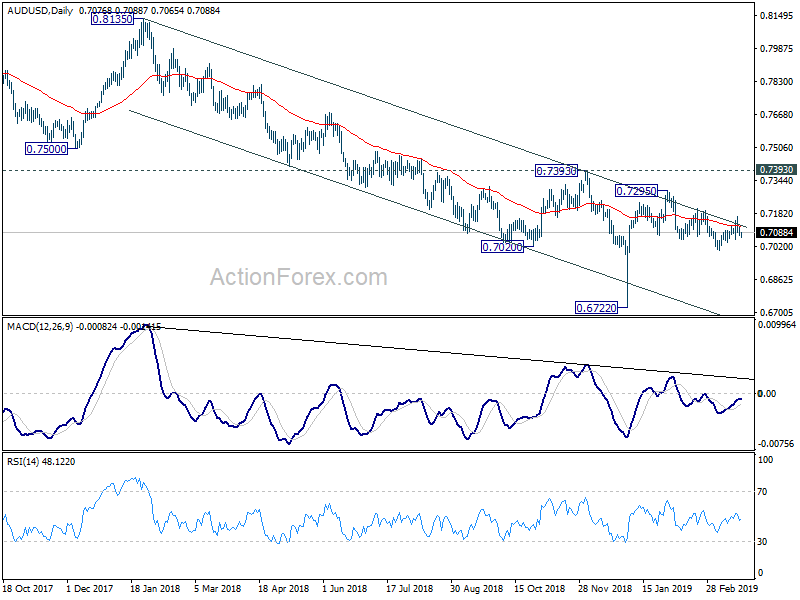
In the bigger picture, as long as 0.7393 resistance holds, we'd treat fall from 0.8135 as resuming long term down trend from 1.1079 (2011 high). Decisive break of 0.6826 (2016 low) will confirm this bearish view and resume the down trend to 0.6008 (2008 low). However, firm break of 0.7393 will argue that fall from 0.8135 has completed. And corrective pattern from 0.6826 has started the third leg, targeting 0.8135 again.
Gold: Yellow Metal Extends Its Gains In The Morning Session
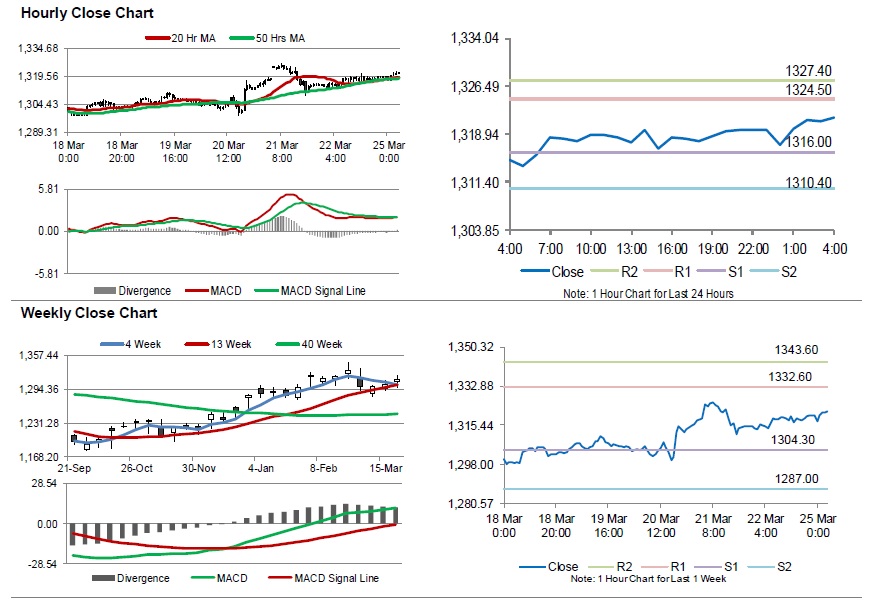
For the 24 hours to 23:00 GMT, Gold rose 0.28% against the USD and closed at USD1318.70 per ounce on Friday, as concerns over global economic slowdown, boosted demand for safe haven assets.
In the Asian session, at GMT0400, the pair is trading at 1321.60, with gold trading 0.22% higher against the USD from Friday’s close.
The pair is expected to find support at 1316.00, and a fall through could take it to the next support level of 1310.40. The pair is expected to find its first resistance at 1324.50, and a rise through could take it to the next resistance level of 1327.40.
The yellow metal is trading above its 20 Hr and 50 Hr moving averages.
Silver: White Metal Reverses Its Losses This Morning
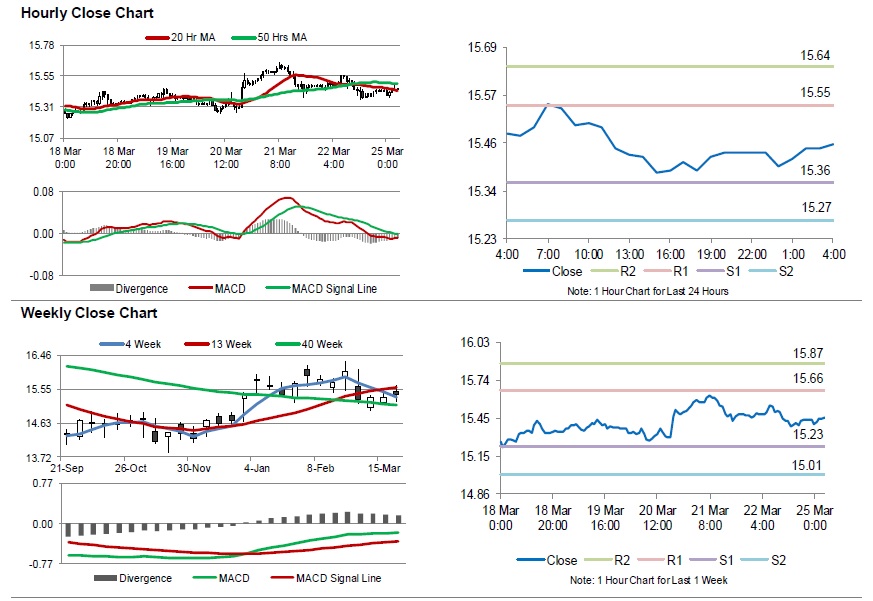
For the 24 hours to 23:00 GMT, Silver declined 0.23% against the USD and closed at USD15.44 per ounce on Friday.
In the Asian session, at GMT0400, the pair is trading at 15.46, with silver trading 0.13% higher against the USD from Friday’s close.
The pair is expected to find support at 15.36, and a fall through could take it to the next support level of 15.27. The pair is expected to find its first resistance at 15.55, and a rise through could take it to the next resistance level of 15.64.
The white metal is showing convergence with its 20 Hr moving average and trading below its 50 Hr moving average.
USD/CAD Daily Outlook
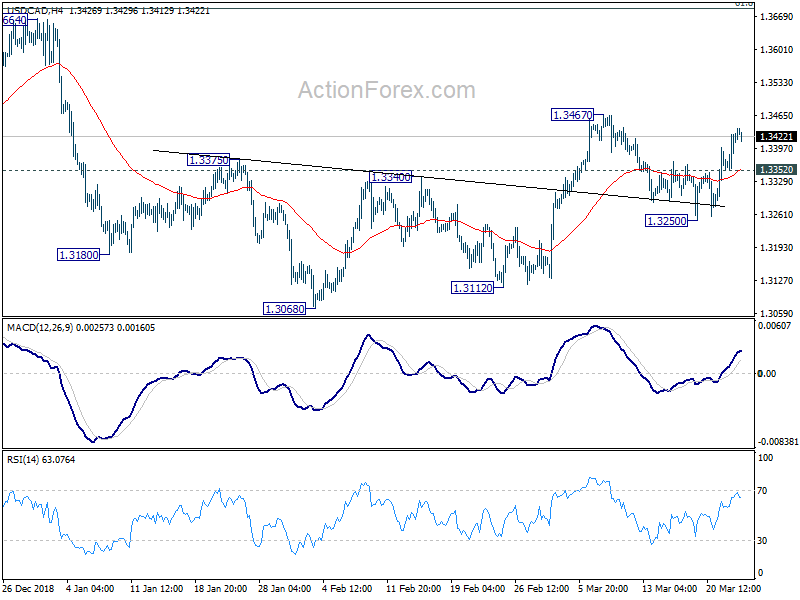
Daily Pivots: (S1) 1.3375; (P) 1.3405; (R1) 1.3457; More...
Intraday bias in USD/CAD remains on the upside for 1.3467 resistance. Break there will reinforce the case that corrective pull back from 1.3664 has completed at 1.3068. USD/CAD should then target a test on 1.3664. On the downside, break of 1.3352 minor support will turn intraday bias neutral again.
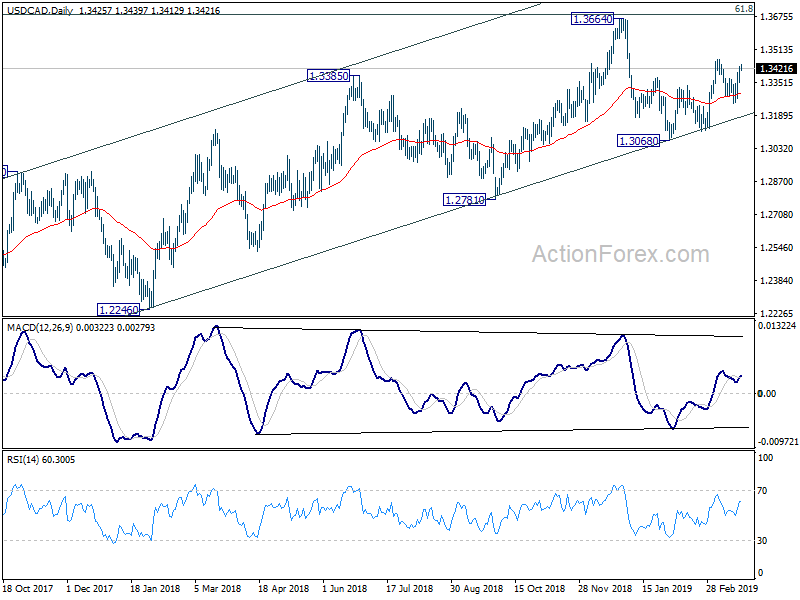
In the bigger picture, structure of the medium term rise from 1.2061 (2017 low) to 1.3664 is not clearly impulsive. Hence, we'd stay cautious on strong resistance from 61.8% retracement of 1.4689 (2016 high) to 1.2061 at 1.3685 and 1.3793 resistance to limit upside, and bring medium term topping. But in any case, medium term outlook will stay bullish as long as channel support (now at 1.3192) holds. Sustained break of 1.3793 will pave the way to retest 1.4689 (2015 high). However, firm break of the channel support should confirm reversal and target 1.2061 low again.
EUR/USD Daily Outlook
Daily Pivots: (S1) 1.1252; (P) 1.1322; (R1) 1.1372; More.....
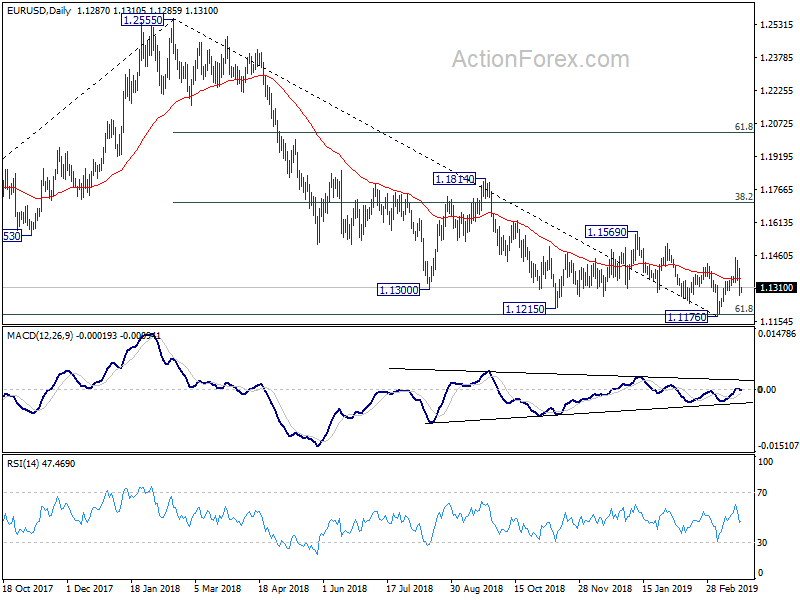
Intraday bias in EUR/USD is mildly on the downside for retesting 1.1176 low. Decisive break there will resume whole decline from 1.2555. On the upside, above 1.1448 will resume the rebound from 1.1176 to 1.1569 resistance instead.
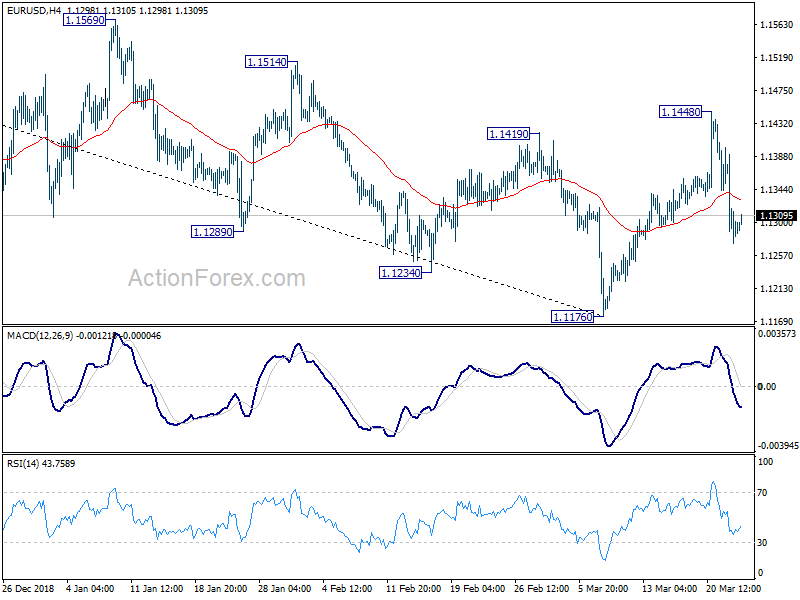
In the bigger picture, medium term outlooks is a bit mixed for now as there are conflicting signals. We'll turn neutral first. On the downside, decisive break of 61.8% retracement of 1.0339 (2016 low) to 1.2555 (2018 high) at 1.1186 will resume the whole down trend from 1.2555. Next target will be 1.0339 low. Nevertheless, break of 1.1569 resistance should confirm medium term bottoming. Stronger rebound should be seen back to 38.2% retracement of 1.2555 to 1.1176 at 1.1703. In that case, the structure of the rise from 1.1176 and reaction to 1.1703 fibonacci level will be watched for making an assessment on whether medium term trend has reversed, or rebound form 1.1176 is merely a correction.
Crude Oil: Oil Extends Its Losses In The Asian Session
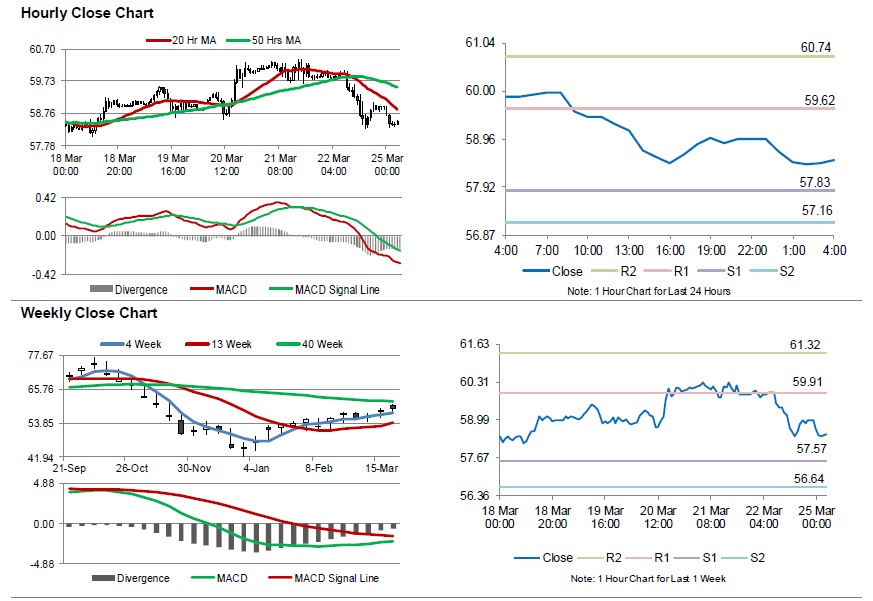
For the 24 hours to 23:00 GMT, Crude Oil declined 1.69% against the USD and closed at USD58.87 per barrel on Friday, amid worries over global energy demand.
Meanwhile, fresh figures from Baker Hughes disclosed that the number of active oil rigs fell by 9 to 824 in the week ended 22 March 2019.
In the Asian session, at GMT0400, the pair is trading at 58.50, with oil trading 0.63% lower against the USD from Friday’s close.
The pair is expected to find support at 57.83, and a fall through could take it to the next support level of 57.16. The pair is expected to find its first resistance at 59.62, and a rise through could take it to the next resistance level of 60.74.
Crude oil is trading below its 20 Hr and 50 Hr moving averages.
GBP/USD And EUR/GBP: Pound Could Recover
GBP/USD started an upward move from the 1.3000 support and it could recover above 1.3240. EUR/GBP declined recently and broke the key 0.8600 support area.
Important Takeaways for GBP/USD and EUR/GBP
- The British Pound is showing positive signs above the 1.3140 and 1.3160 levels.
- There was a break above a key bearish trend line with resistance at 1.3160 on the hourly chart of GBP/USD.
- EUR/GBP topped near the 0.8720 level and declined later sharply below the 0.8600 level.
- There was a break below a major bullish trend line at 0.8605 on the hourly chart.
GBP/USD Technical Analysis
The British Pound declined towards the 1.3000 support against the US Dollar, where buyers emerged. The GBP/USD pair traded as low as 1.3004 before the pair started a solid recovery.
The pair traded above the 1.3120 and 1.3140 resistance levels to move into a positive zone. Buyers gained control, resulting in a push above the 50% fib retracement level of the recent decline from the 1.3310 high to 1.3004 low.
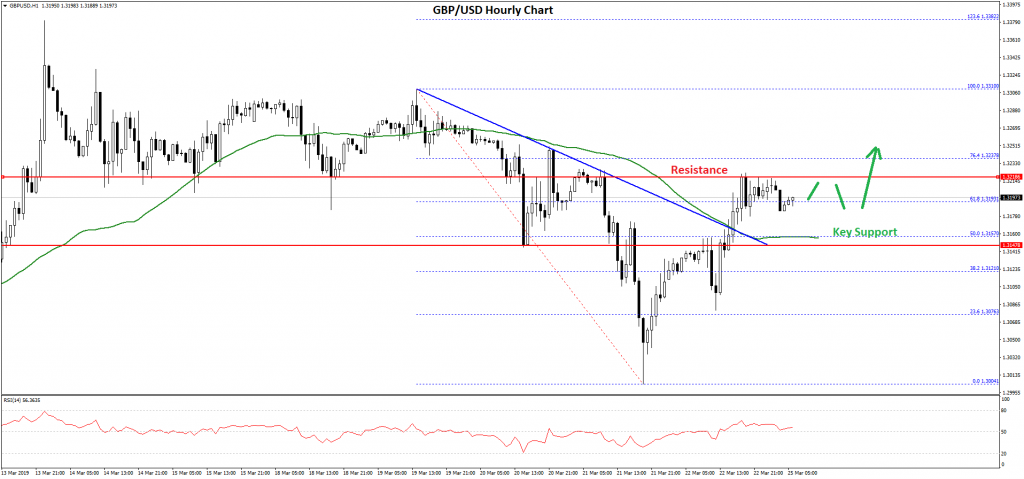
There was also a break above a key bearish trend line with resistance at 1.3160 on the hourly chart of GBP/USD. The pair is now trading nicely above 1.3150 on FXOpen and above the 50 hourly simple moving average.
The current price action is positive above the 61.8% fib retracement level of the recent decline from the 1.3310 high to 1.3004 low. An immediate resistance is near the 1.3220, where sellers are putting up a fight.
If there is an upside break above the 1.3220 level, the pair is likely to accelerate higher towards the 1.3250 and 1.3280 levels. On the downside, an initial support is near the 1.3150 level and the 50 hourly SMA.
Overall, dips remain supported in GBP/USD and there are high chances of more gains above the 1.3220 resistance in the near term.
EUR/GBP Technical Analysis
The Euro rallied this past week and traded above the 0.8640 and 0.8700 resistance levels against the British Pound. The EUR/GBP pair climbed towards the 0.8720 level, where sellers emerged.
Later, there was a sharp downside correction and the pair traded below the 0.8700 and 0.8650 support levels. There was also a break below a major bullish trend line at 0.8605 on the hourly chart, opening the doors for more losses below 0.8600.
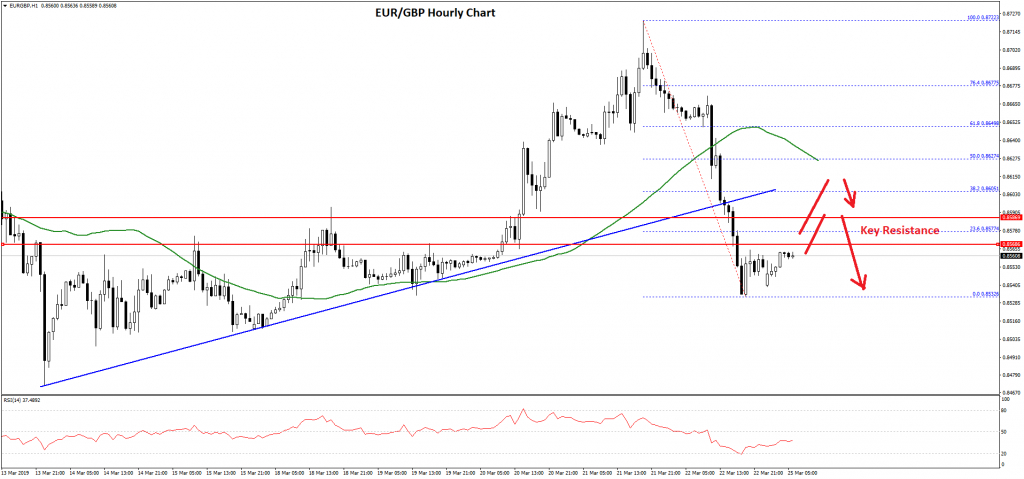
The pair even broke the 0.8580 support and settled well below the 50 hourly simple moving average. It traded as low as 0.8532 and it is currently correcting higher. An initial resistance is near the 0.8575 and the 23.6% Fib retracement level of the recent decline from the 0.8722 high to 0.8532 low.
However, a proper break above the 0.8600 resistance is need for buyers to gain momentum. The next key resistance above 0.8600 is near 0.8628 and the 50% Fib retracement level of the recent decline from the 0.8722 high to 0.8532 low.
The 50 hourly SMA is also positioned near the 0.8625 level. Therefore, upsides are likely to remain capped by the 0.8600 or 0.8625 levels.
On the downside, an initial support is near the 0.8540 level. If buyers fail to push EUR/GBP above the 0.8600 level, there are chances of a downside break towards the 0.8500 support level.
GBP/USD Daily Outlook
Daily Pivots: (S1) 1.3119; (P) 1.3172; (R1) 1.3262; More....
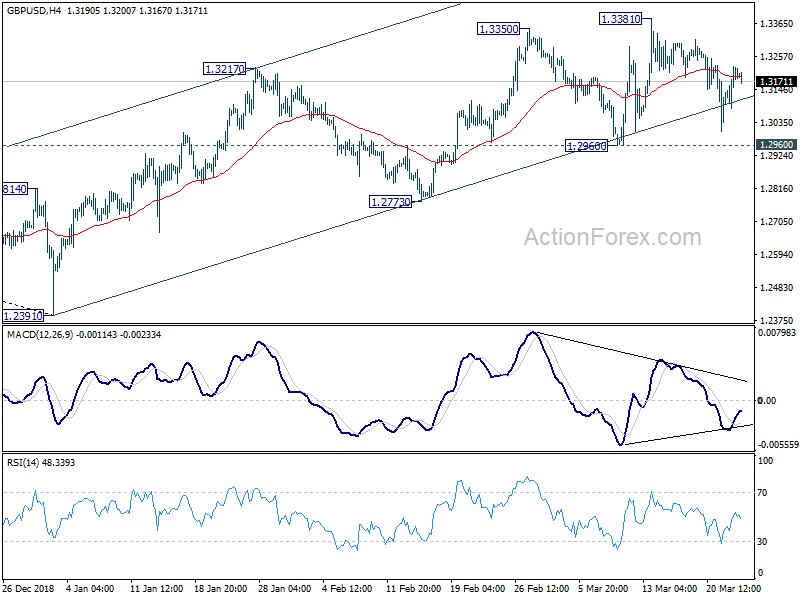
GBP/USD is still bounded in consolidation belo0w 1.3381 and intraday bias remains neutral for the moment. Further rise is expected with 1.2960 support intact. On the upside, firm break of 1.3381 will target 61.8% retracement of 1.4376 to 1.2391 at 1.3618 next. However, on the downside, firm break of 1.2960 will indicate that rebound from 1.2391 has completed earlier than expected. Deeper fall would then be seen to 1.2773 support for confirmation.
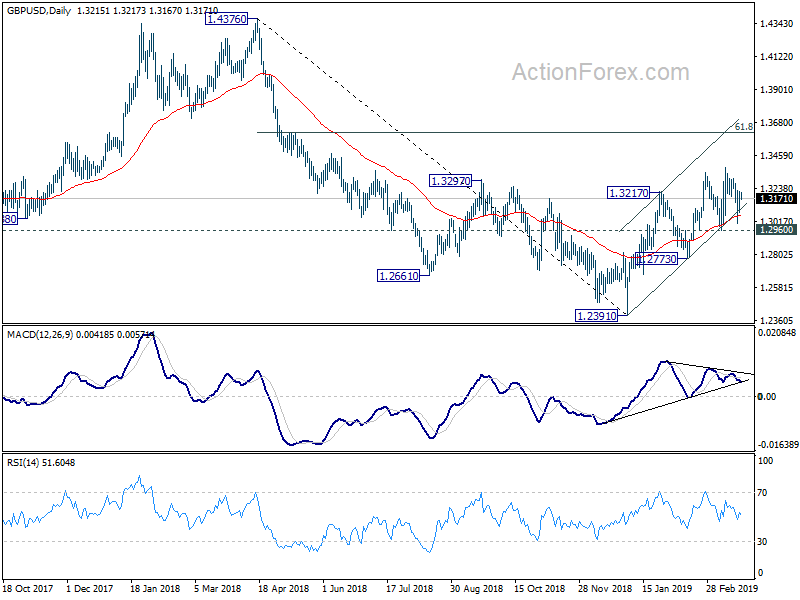
In the bigger picture, medium term decline from 1.4376 (2018 high) should have completed at 1.2391. Rise from 1.2391 is now seen as the third leg of the corrective pattern from 1.1946 (2016 low). Further rise could be seen through 1.4376 in medium term. On the downside, though, break of 1.2773 support will dampen this view. Focus will be turned back to 1.2391 low and break will resume the fall from 1.4376 to 1.1946.
USD/CHF Daily Outlook
Daily Pivots: (S1) 0.9909; (P) 0.9940; (R1) 0.9966; More.....
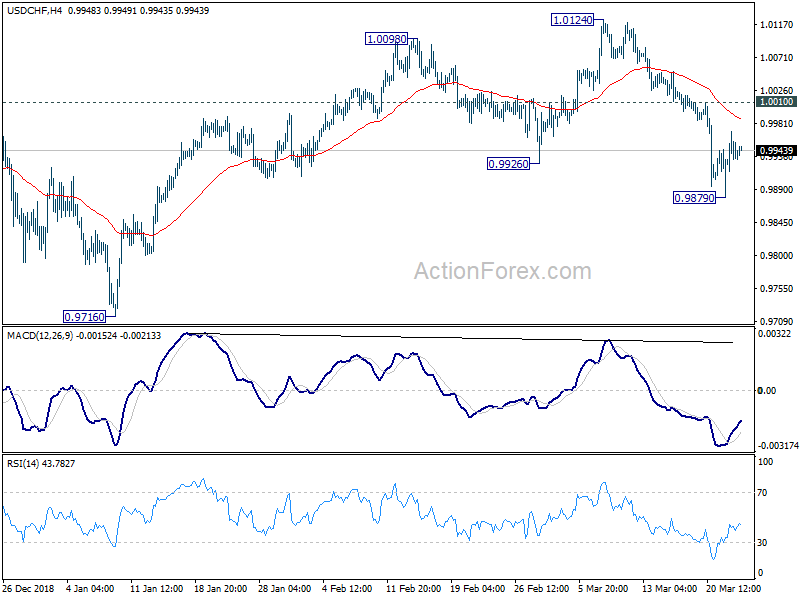
Intraday bias in USD/CHF remains neutral and some more consolidations could be seen above 0.9879 temporary low. But further decline remains in favor with 1.0010 minor resistance intact. On the downside, below 0.9879 will resume the fall from 1.0124 to 0.9716 key support. Nevertheless, break of 1.0010 will turn bias back to the upside for 1.0124/28 resistance zone.
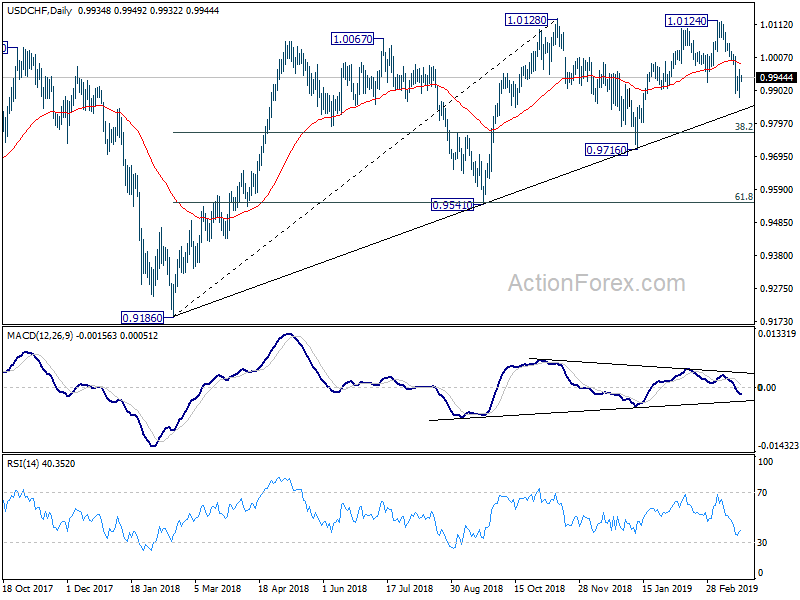
In the bigger picture, focus is back on medium term trend line (now at 0.9846). Decisive break there will argue that whole rise from 0.9186 has completed. Further break of 0.9716 will confirm reversal and target next support level at 0.9541. Nevertheless, there is still a chance that price action from 1.0128 are forming a consolidative pattern with fall from 1.0124 as third leg. If this is the case, stronger support should be seen between 0.9716 and the trend line to contain downside.
USD/JPY Daily Outlook
Daily Pivots: (S1) 109.45; (P) 110.18; (R1) 110.64; More...
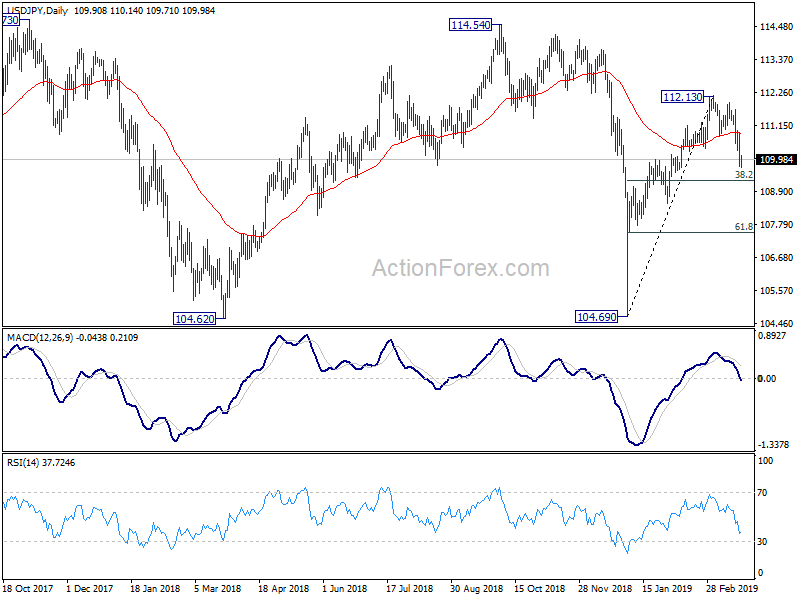
Intraday bias in USD/JPY remains on the downside at this point. Prior break of 110.35 support argues that rebound from 104.69 is completed at 112.13 already. Further decline should be seen to 38.2% retracement of 104.69 to 112.13 at 109.28 first. Break will target 61.8% retracement at 107.53 next. On the upside, break of 110.95 minor resistance will turn bias back to the upside for retesting 112.13 instead.
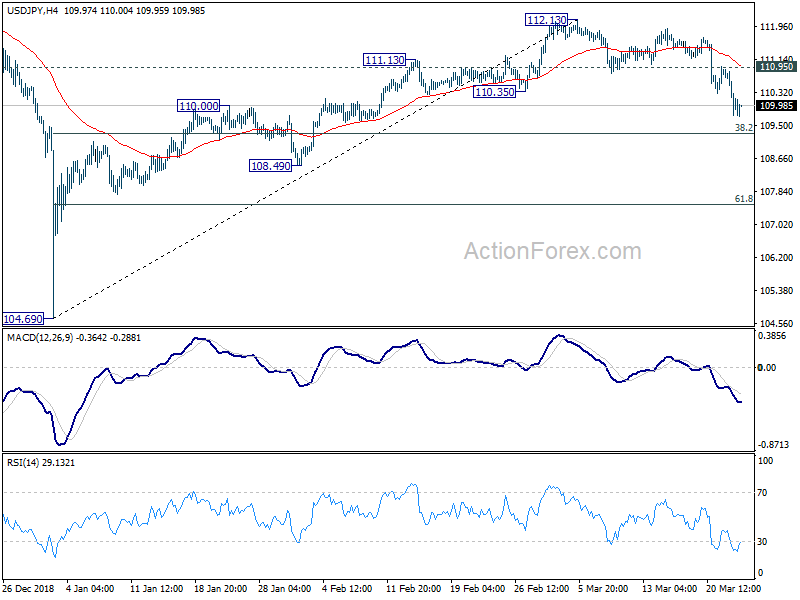
In the bigger picture, while the rebound from 104.69 was strong, USD/JPY failed to sustain above 55 week EMA (now at 110.91), and was kept well below 114.54 resistance. Medium term outlook is turned mixed and we'll wait for the structure of the fall from 112.13 to unveil to make an assessment later. For now, more range trading is expected between 104.69 and 112.13 first.