Sample Category Title
EUR/JPY Daily Outlook
Daily Pivots: (S1) 123.32; (P) 124.75; (R1) 125.68; More....
Intraday bias in EUR/JPY remains on the downside at this point. Prior break of 124.27 support firstly indicates resumption of fall from 127.50. Secondly it argues that rebound from 118.62 might be completed. Deeper decline would be seen to 61.8% retracement of 118.62 to 127.50 at 122.01. On the upside, above 125.08 minor resistance will turn intraday bias neutral first.
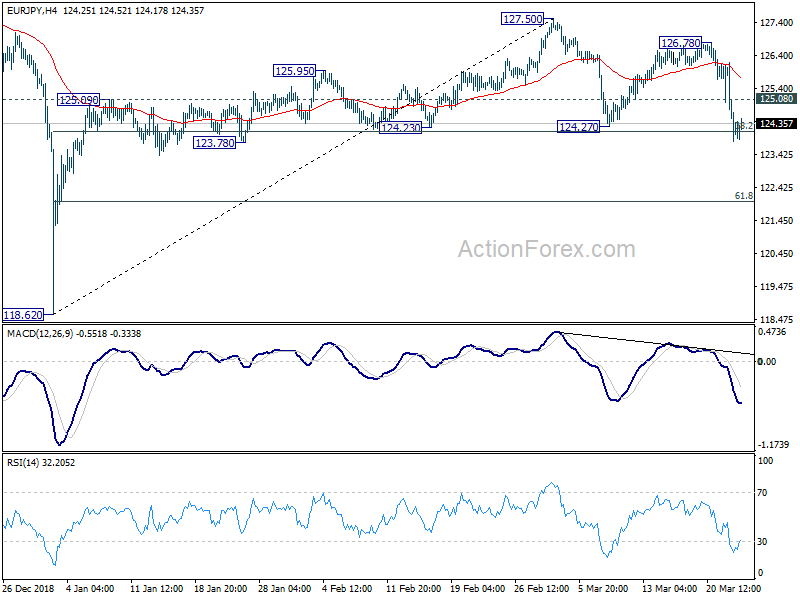
In the bigger picture, rebound from 118.62 might have completed earlier than expected at 127.50. EUR/JPY is held well inside medium term falling channel, and below 55 week EMA (now at 127.86). That is, the down trend from 137.49 (2018 high) might still be in progress. Break of 118.62 will target 109.03/114.84 long term support zone. On the upside, however, break of 127.50 will extend the rebound from 118.62 to 133.12 key resistance instead.
Gold Spot Further Advance
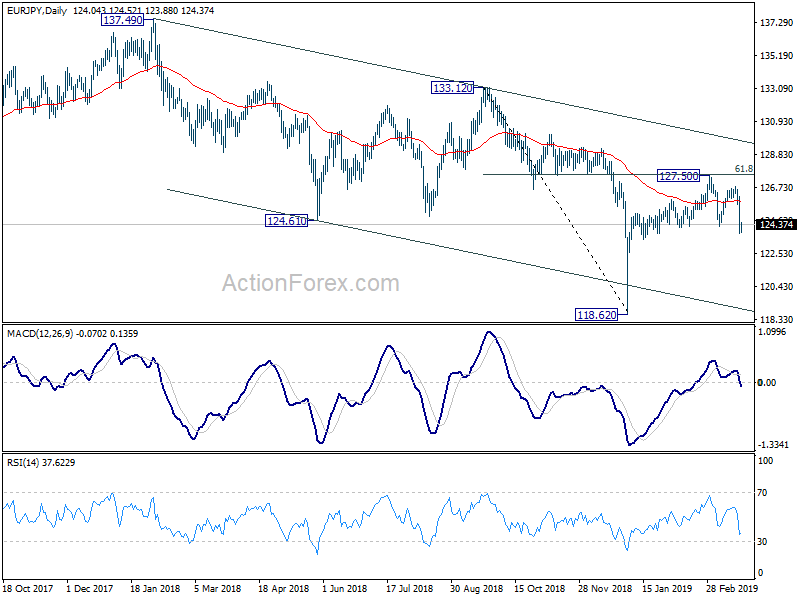
Pivot (invalidation): 1309.00
Our preference Long positions above 1309.00 with targets at 1320.00 & 1326.00 in extension.
Alternative scenario Below 1309.00 look for further downside with 1303.00 & 1298.50 as targets.
Comment The RSI is bullish and calls for further advance.
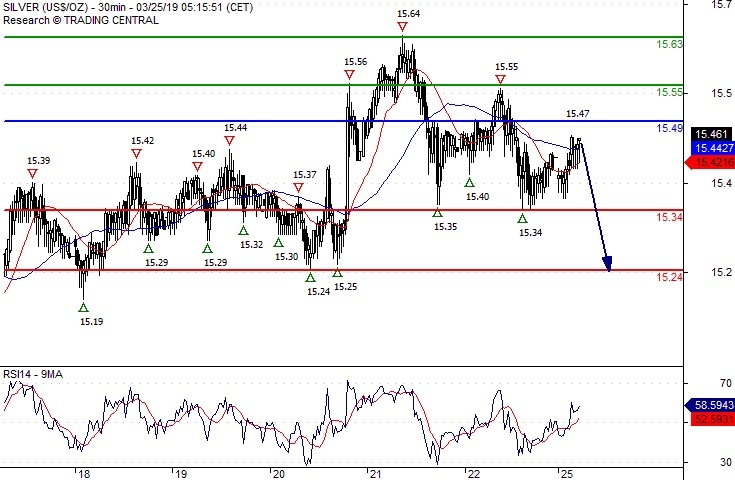
Silver Spot Caution
Pivot (invalidation): 15.4900
Our preference Short positions below 15.4900 with targets at 15.3400 & 15.2400 in extension.
Alternative scenario Above 15.4900 look for further upside with 15.5500 & 15.6300 as targets.
Comment The RSI is mixed and calls for caution.
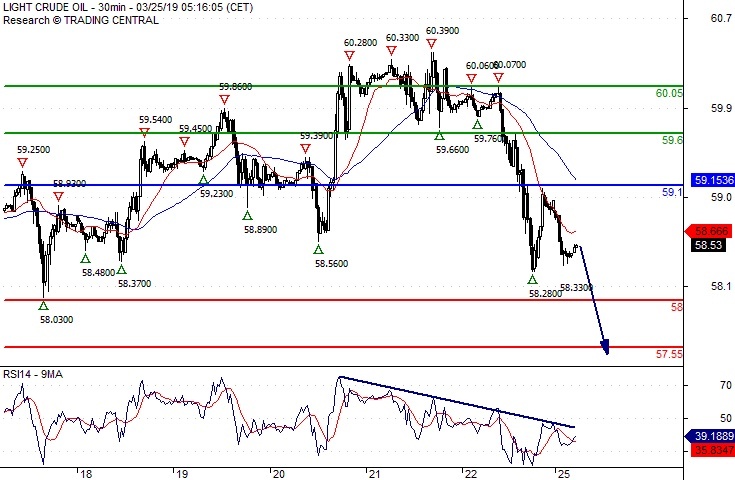
Crude Oil The Downside Prevails
Pivot (invalidation): 59.10
Our preference Short positions below 59.10 with targets at 58.00 & 57.55 in extension.
Alternative scenario Above 59.10 look for further upside with 59.60 & 60.05 as targets.
Comment The RSI shows downside momentum.
EUR/GBP Daily Outlook
Daily Pivots: (S1) 0.8499; (P) 0.8591; (R1) 0.8650; More...
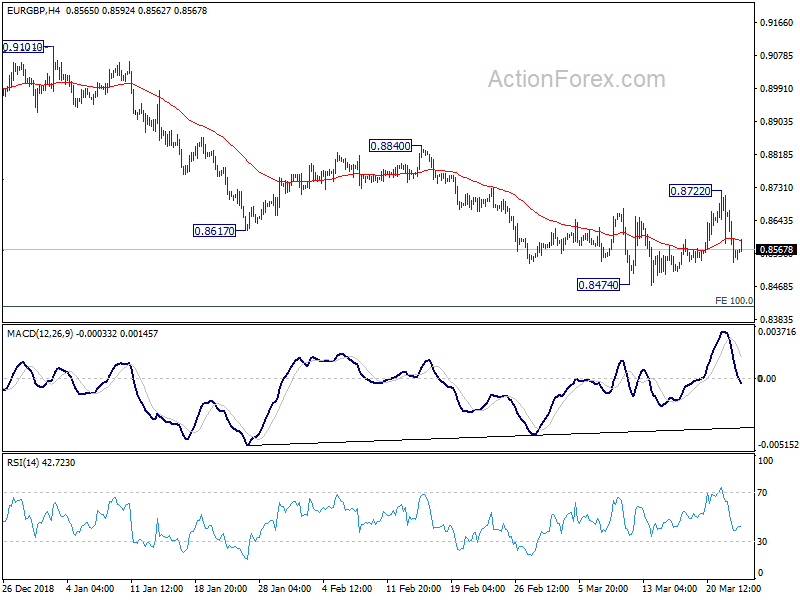
Intraday bias in EUR/GBP remains neutral at this point and more consolidation could be seen above 0.8474 low. On the downside, break of 0.8474 low will resume recent down trend and target 0.8416 long term projection next. On the upside, though, break of 0.8722 will resume the rebound from 0.8474 to 0.8840 resistance first.
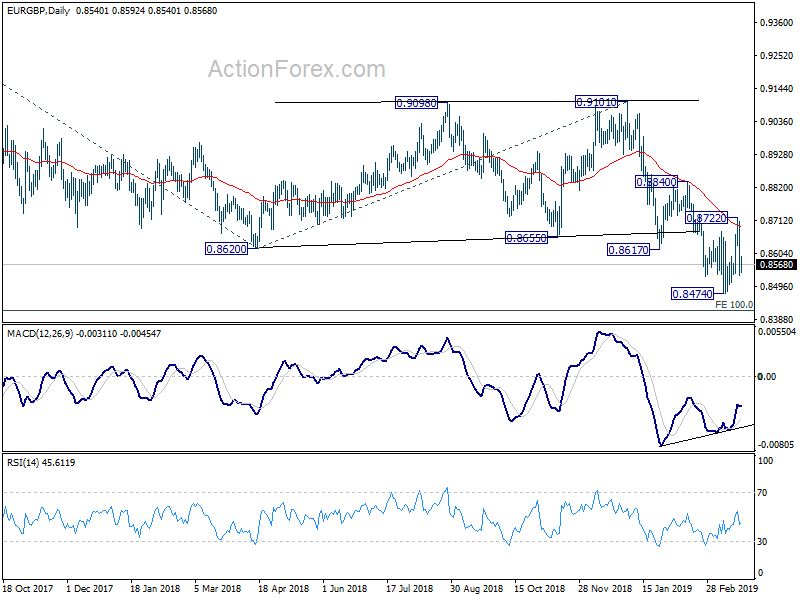
In the bigger picture, EUR/GBP is seen as staying in long term range pattern started at 0.9304 (2016 high). Current fall from 0.9305 (2017 high), is a falling leg inside the pattern. Such decline could extend to 100% projection of 0.9305 to 0.8620 from 0.9101 at 0.8416 and possibly below. But for now, we'd expect strong support around 0.8312 support to contain downside and bring rebound.
ETHUSD Range Break Needed
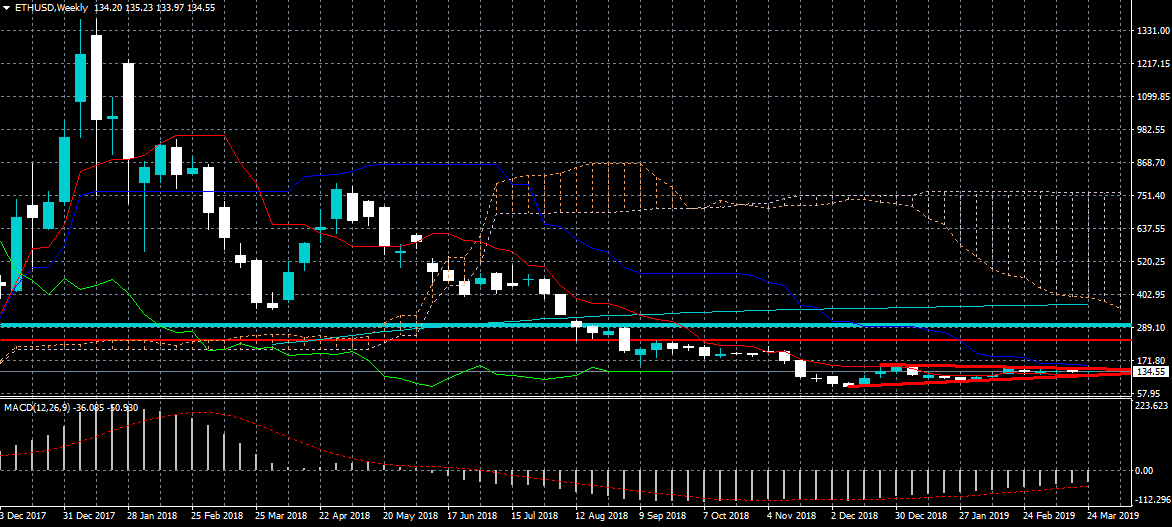
Ethereum is struggling to find direction in early Monday trading, with the second largest cryptocurrency trapped in its narrowest four-week trading range in over six months. The Ichimoku cloud on the daily time frame shows that critical support is found at the $124.00 level. Above the current monthly trading high, the Kinjin-sen line offers breakout resistance around the $158.00 level
The ETHUSD pair is only bullish while trading above the $145.00 level, key resistance is found at the $158.00 and $175.00 levels.
If the ETHUSD pair trades below the $130.00 level, key support is found at the $124.00 and $118.00 levels.
EUR/AUD Daily Outlook
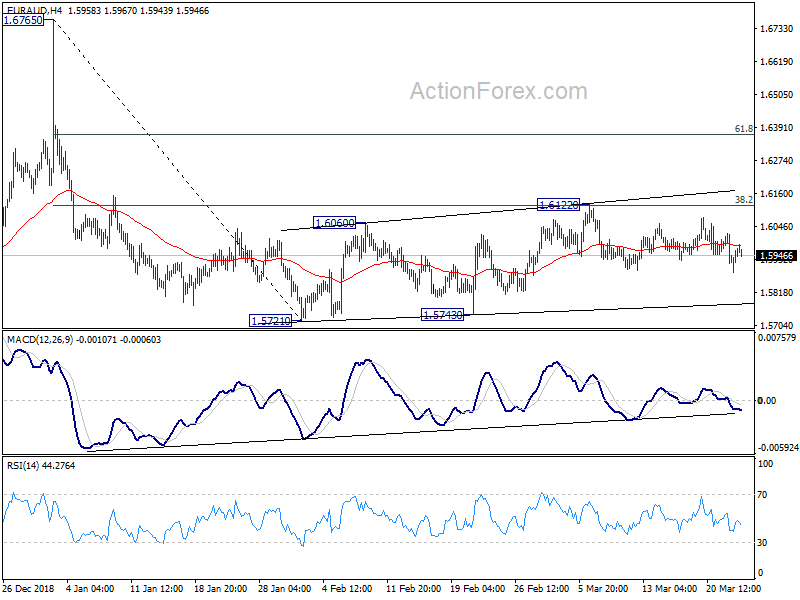
Daily Pivots: (S1) 1.5892; (P) 1.5959; (R1) 1.6029; More...
Intraday bias in EUR/AUD remains neutral and consolidation from 1.5721 could extends. Nevertheless, fall from 1.6765 is in favor to extend. On the downside, break of 1.5721 low will confirm this case and target 1.5346 support next. On the upside, though, break of 1.6122 will extend the pattern from 1.5721 with another rise.
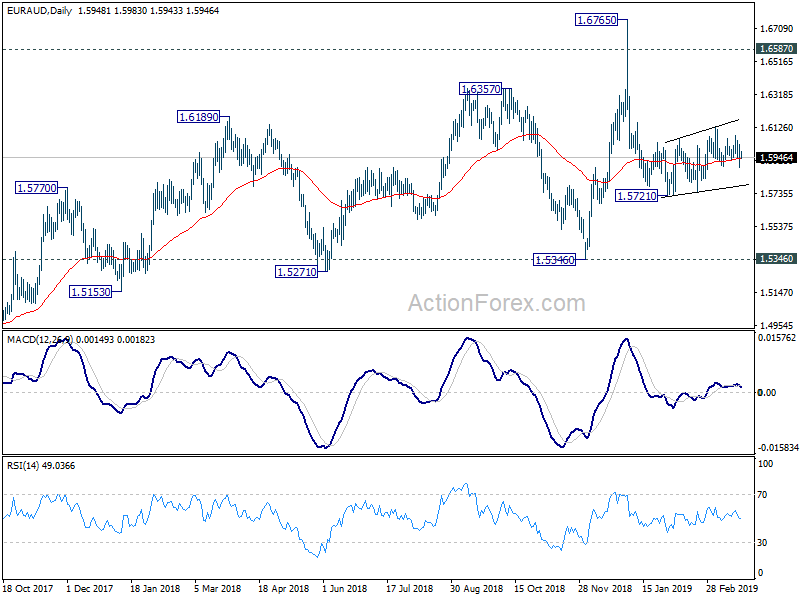
In the bigger picture, as long as 1.5346 support holds, outlook will remain bullish. Uptrend from 1.1602 (2012 low) is expected to resume sooner or later. Break of 1.6765 will target 61.8% retracement of 2.1127 (2008 high) to 1.1602 at 1.7488 next. However, firm break of 1.5346 key support will indicate trend reversal, with bearish divergence condition in weekly MACD, and turn outlook bearish.
EURUSD Bears Need To Break 1.1175
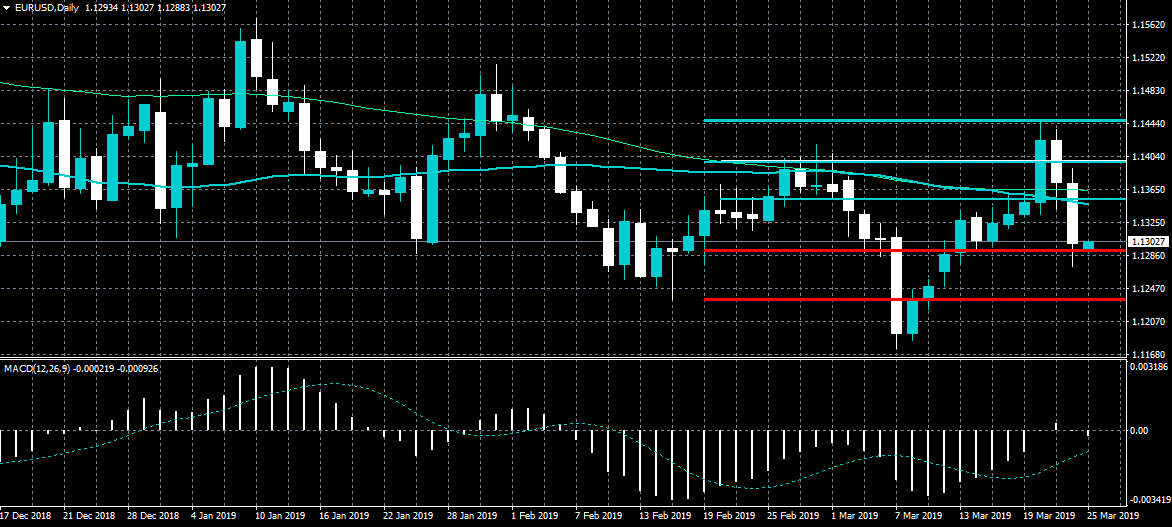
The euro currency has started the new trading week under pressure against the US dollar as fears grow that the German economy could be headed into a recession. Bearish pressure is likely to heighten while price trades below the 1.1290 level, although sellers need to break the 1.1175 level to increases selling pressures. Traders now await the release of key IFO survey data from the German economy.
The EURUSD pair bearish while trading below the 1.1290 level, key technical support is found at the 1.1237 and 1.1170 levels.
If the EURUSD pair trades above the 1.1290, buyers may test back towards the 1.1330 and 1.1360 resistance levels.
GBPUSD 1.3100 Still Key Support
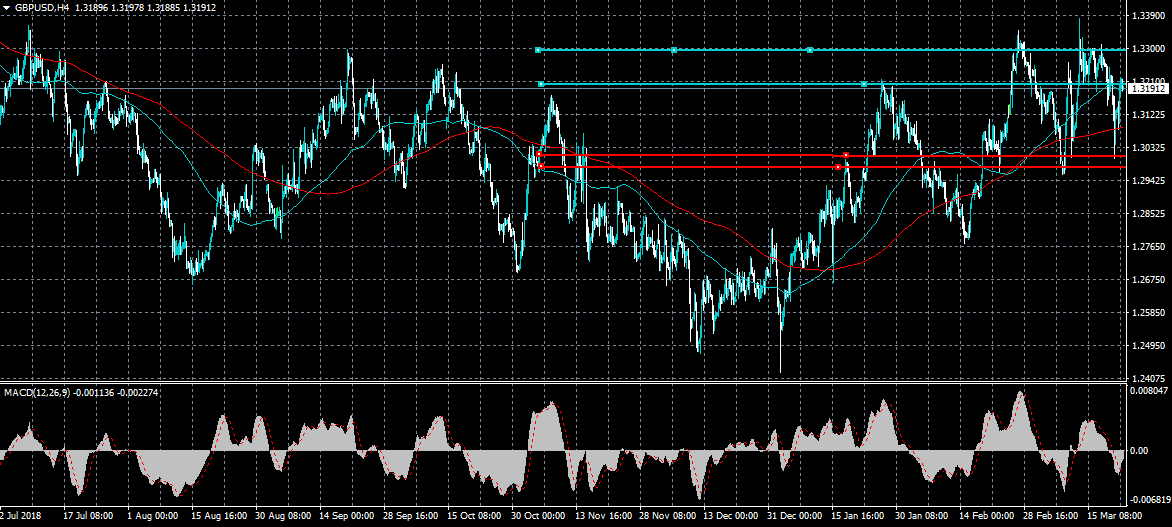
The British pound has opened the new trading week slightly lower against the US dollar as news reports surface that British PM Theresa May is coming under pressure to resign. The GBPUSD pair only has a weekly bearish bias while trading under the 1.3100 level, with critical technical support found at the 1.2970 level. If bulls move price above the 1.3200 level, the 1.3300 level remains the key weekly resistance area to watch.
The GBPUSD pair is only bearish while trading below the 1.3100 level, key technical support is found at the 1.3000 and 1.2970 levels
If the GBPUSD pair trades above the 1.3200 level, buyers may test towards the 1.3255 and 1.3300 resistance levels.
US Futures Decline As Robert Mueller Completes His Investigation
US futures pointed to a lower open after Robert Mueller completed his investigation on the Trump campaign. His highly-anticipated report was forwarded to the Justice Department on Friday, and yesterday the attorney general released the main conclusions. These conclusions were favorable to Donald Trump, who has spent the past two years calling the investigation a witch hunt. In his report, Mueller said that Trump and his campaign did not coordinate with Russia. He also found it difficult to exonerate the president on the charge of obstruction of justice. While the conclusions of Mueller’s probe are now public, the political circus in the US will continue as the country readies for the next election.
The price of crude oil declined in early trading as investors continued to worry about slow economic growth. This was after the weak PMI data released from Europe on Friday. The data showed that the Germany manufacturing PMI had declined to 44.7 in February, which was the lowest level in almost a decade. In France, the PMI declined to 49.8 while in the EU27, the PMI declined to 47.6. In the United States, the manufacturing PMI declined to 52.5, which was lower than the expected 53.5. The slowdown in the manufacturing activity is a major signal that the economy is slowing down, which tends to impact the crude price negatively. In addition to this, a report by Baker Hughes showed that oil rigs in the US continued to decline.
The euro was little moved after Italy moved ahead with its plan to sign-up to the China’s Belt and Road Initiative (BRI). The plan was signed in Rome, where Xi Jinping visited in his six-day trip to Europe. This decision comes at a time when many EU countries are deliberating on whether to defy Donald Trump again as it relates to awarding Huawei contracts on 5G implementation. It is expected that Washington, and other EU members will continue to criticise Italy for this decision. The BRI program has been accused as a way of trapping developing with toxic Chinese debt.
EUR/USD
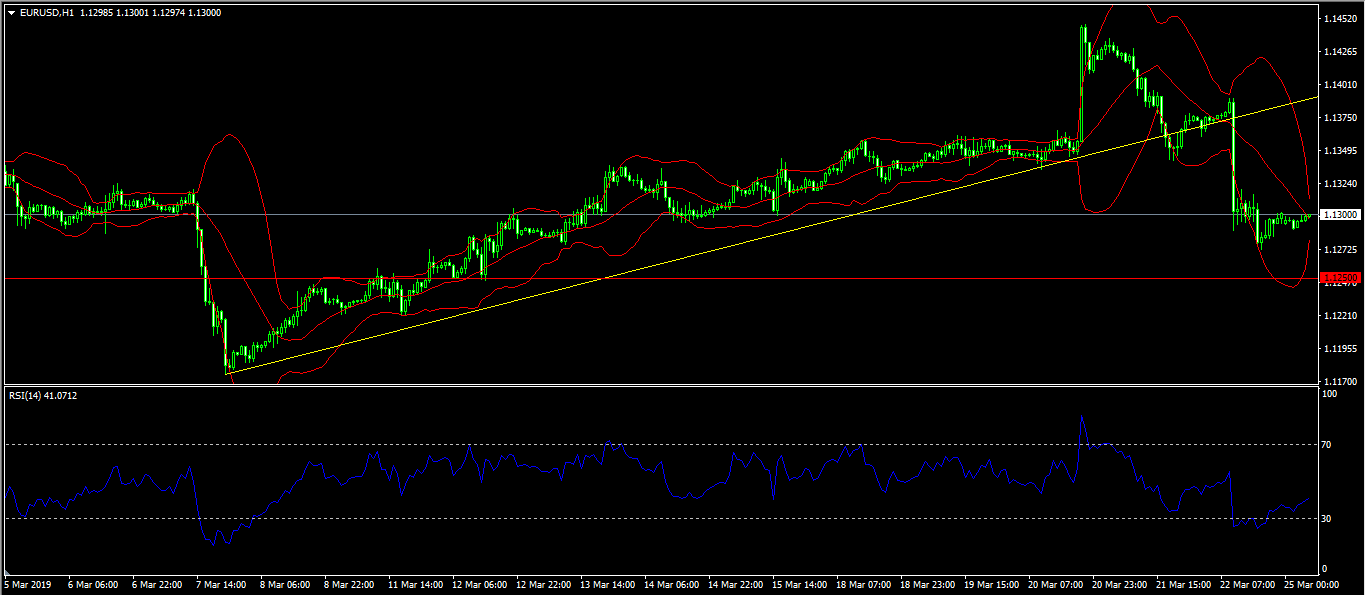
On Friday, the EUR/USD pair declined sharply after the release of EU’s PMI numbers. The pair reached a low of 1.1272, which was the lowest level since March 15. In the hourly chart, the price is in the middle line of the Bollinger Bands and below the important diagonal support shown below. The RSI has emerged from a low of below 30 to the current 40. The pair could continue the downward trend to test the important support of 1.1250.
XBR/USD
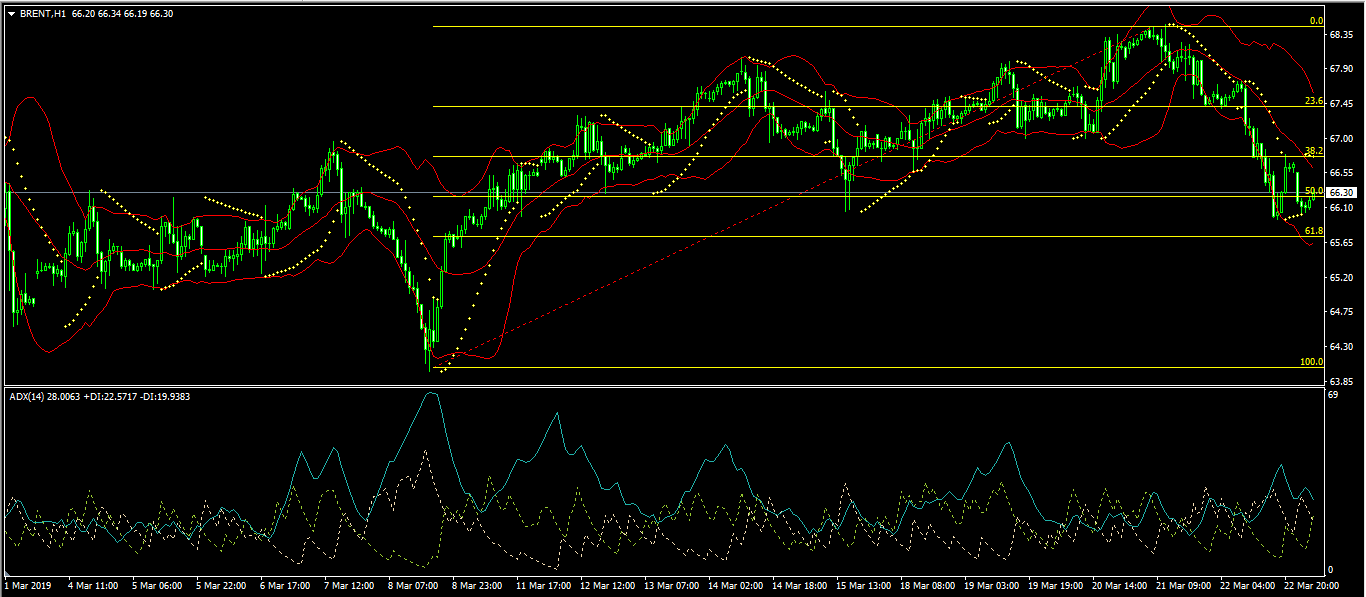
The price of Brent crude oil started to decline on Thursday, when it reached a high of $68.50. Today, the XBR/USD pair declined to 65.95. On the hourly chart, this price is between the lower line of the Bollinger Bands and the middle one while the average directional index has declined to 28. The Parabolic SAR is above the price. The current price is also along the 50% Fibonacci Retracement level. The pair will likely continue moving lower, to test the important support of 65.70.
GBP/USD
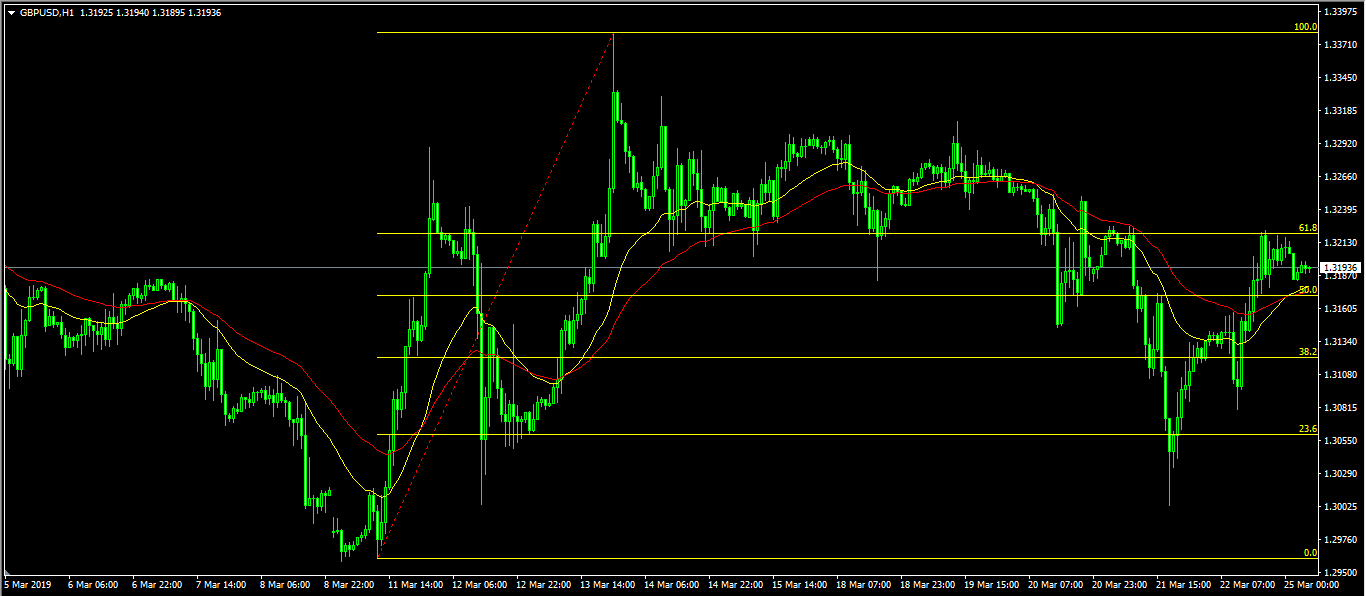
The GBP/USD pair was little moved in early trading ahead of an important week on Brexit. The pair is currently trading at 1.3193, which is slightly lower than the previous high of 1.3222. The current price is between the 61.8% and 50% Fibonacci Retracement level. The price is also slightly above the 50-day and 25-day moving averages. The pair will likely be volatile this week as the initial Brexit deadline looms.