Sample Category Title
Japan CPI core slowed to 0.7% yoy, drifting away from BoJ’s target
Japan national CPI core (all items less fresh food) slowed to 0.7% yoy in February, down from 0.8% yoy and missed expectation of 0.8% yoy. CPU core-core (all items less food and energy) remained sluggish at 0.4% yoy, unchanged from January. Headline all items CPI was unchanged at 0.2%.
Despite BoJ's massive monetary stimulus, there is no sign for CPI core to achieve the 2% target. And even worse, it's actually moving farther away from the goal. Sluggish core-core reading is providing no help too. Moreover, there are risks of drag by slowdown in overseas economy. For now, there is practically no case for BoJ to exit ultra-loose policy any time soon.
Japan’s National Consumer Price Index Rose Less-Than-Expected In February
For the 24 hours to 23:00 GMT, the USD rose 0.08% against the JPY and closed at 110.78.
In the Asian session, at GMT0400, the pair is trading at 110.77, with the USD trading slightly lower against the JPY from yesterday's close.
On the data front, Japan's national consumer price index (CPI) advanced 0.2% on an annual basis in February, falling short of market expectations for an advance of 0.3%. In the prior month, the CPI had registered a similar rise. Moreover, the nation's Nikkei flash manufacturing PMI remained steady at 48.9 in March.
Early morning data showed that Japan's final leading economic index eased to a level of 96.5 in January, compared to a level of 97.5 in the previous month. The preliminary figures had indicated a drop to a level of 95.9. Furthermore, the nation's final coincident index dropped to a level of 98.1 in January, compared to a level of 101.8 in the prior month. The preliminary figures had recorded a decline to a level of 97.9.
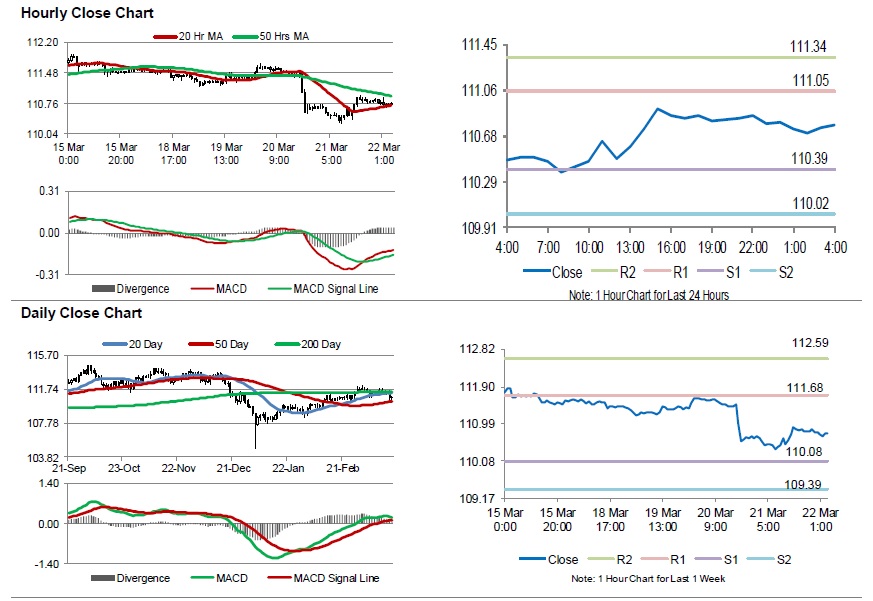
The pair is expected to find support at 110.39, and a fall through could take it to the next support level of 110.02. The pair is expected to find its first resistance at 111.05, and a rise through could take it to the next resistance level of 111.34.
Moving ahead, investors would keep an eye on Japan's jobless rate, industrial production, retail trade, large retailers' sales and housing starts, all set to release next week.
The currency pair is showing convergence with its 20 Hr moving average and trading below its 50 Hr moving average.
SNB Left Its Benchmark Interest Rate Unchanged And Cut Its Inflation Forecast
For the 24 hours to 23:00 GMT, the USD rose 0.08% against the CHF and closed at 0.9919.
In economic news, Switzerland’s M3 money supply advanced 3.5% on a yearly basis in February, following a revised rise of 3.2% in the previous month.
The Swiss National Bank in its monetary policy meeting, decided to leave its benchmark interest rate unchanged at -0.75%, as widely expected and highlighted concerns over global political and economic uncertainty. Further, the central bank slashed its 2019 inflation outlook to 0.3% from 0.5% and 0.4% from 0.6% for 2020.
In the Asian session, at GMT0400, the pair is trading at 0.9928, with the USD trading 0.09% higher against the CHF from yesterday’s close.
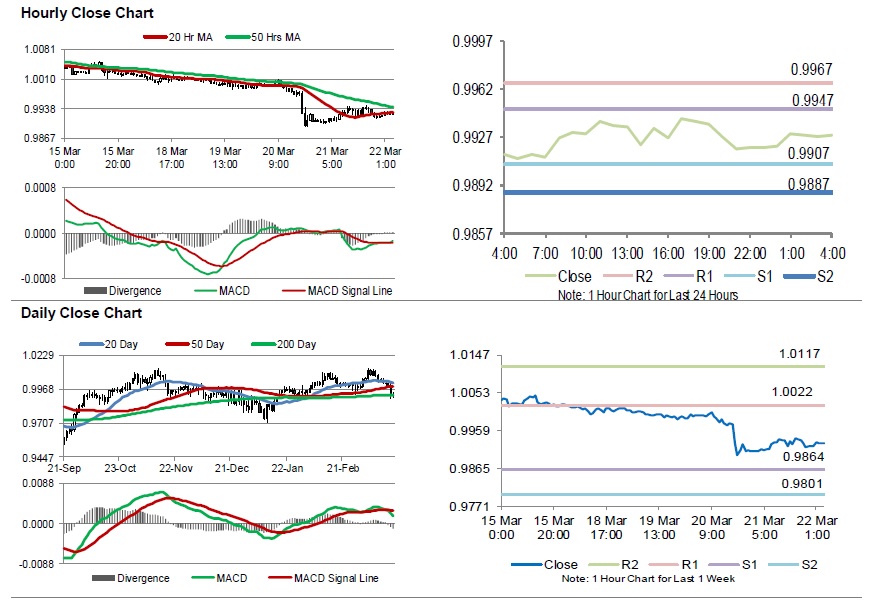
The pair is expected to find support at 0.9907, and a fall through could take it to the next support level of 0.9887. The pair is expected to find its first resistance at 0.9947, and a rise through could take it to the next resistance level of 0.9967.
The currency pair is showing convergence with its 20 Hr moving average and trading below its 50 Hr moving average.
Loonie Trading Slightly Higher In The Asian Session
For the 24 hours to 23:00 GMT, the USD rose 0.56% against the CAD and closed at 1.3366.
In the Asian session, at GMT0400, the pair is trading at 1.3365, with the USD trading a tad lower against the CAD from yesterday’s close.
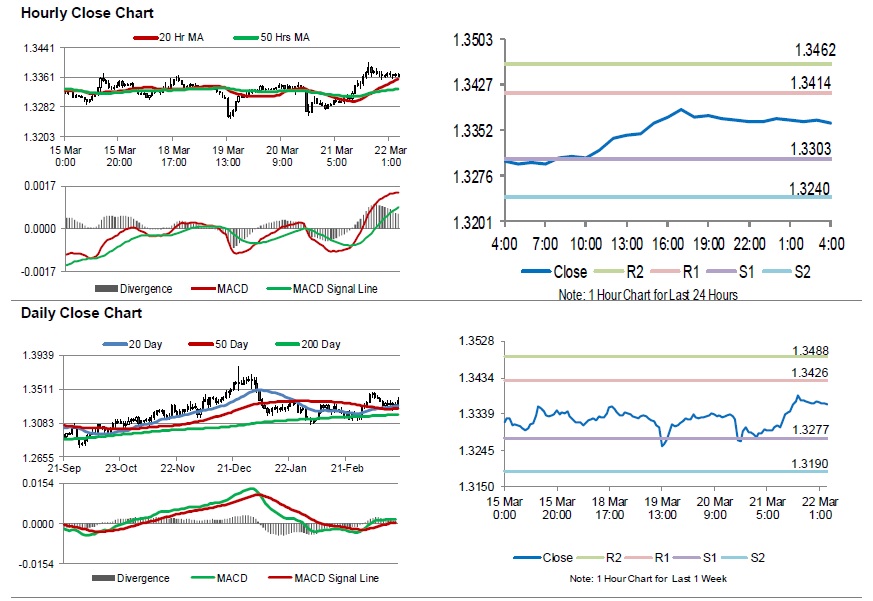
The pair is expected to find support at 1.3303, and a fall through could take it to the next support level of 1.3240. The pair is expected to find its first resistance at 1.3414, and a rise through could take it to the next resistance level of 1.3462.
Trading trend in the Loonie today, is expected to be determined by Canada’s retail sales for January and consumer price index for February, scheduled to release later in the day.
The currency pair is trading above its 20 Hr and 50 Hr moving averages.
Australia’s Manufacturing PMI Fell In March, While The Services PMI Rose In The Same Month
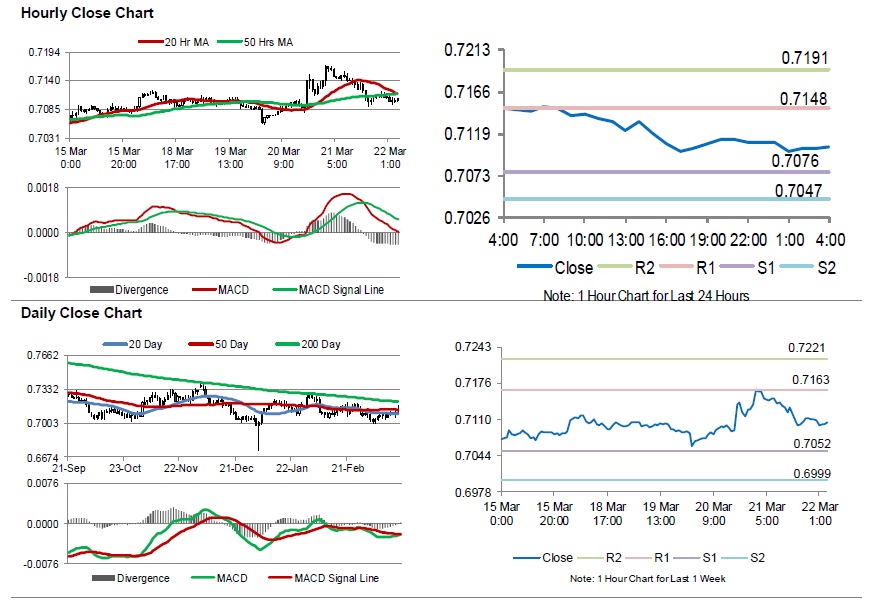
For the 24 hours to 23:00 GMT, the AUD declined 0.25% against the USD and closed at 0.7110.
LME Copper prices rose 0.5% or $33.0/MT to $6520.0/MT. Aluminium prices rose 1.7% or $32.0/MT to $1891.0/MT.
In the Asian session, at GMT0400, the pair is trading at 0.7105, with the AUD trading 0.07% lower against the USD from yesterday's close.
Overnight data showed that Australia's CBA flash manufacturing PMI fell to a level of 52.0 in March, compared to a reading of 52.9 in the previous month. Meanwhile, the nation's preliminary services PMI rose to a level of 49.8 in March, following a reading of 48.7 in the prior month.
The pair is expected to find support at 0.7076, and a fall through could take it to the next support level of 0.7047. The pair is expected to find its first resistance at 0.7148, and a rise through could take it to the next resistance level of 0.7191.
Amid lack of macroeconomic releases in Australia today, traders would closely monitor the global macroeconomic events for further direction.
The currency pair is trading below its 20 Hr and 50 Hr moving averages.
Gold: Yellow Metal Trading Marginally Lower In The Morning Session
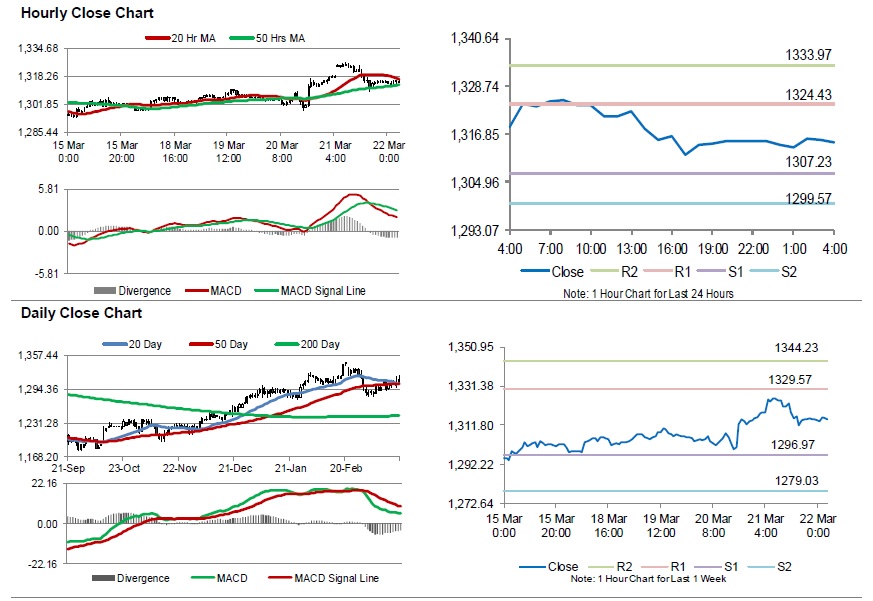
For the 24 hours to 23:00 GMT, Gold slightly rose against the USD and closed at USD1315.00 per ounce, following the US Federal Reserve’s dovish stance on future rate hikes.
In the Asian session, at GMT0400, the pair is trading at 1314.90, with gold trading slightly lower against the USD from yesterday’s close.
The pair is expected to find support at 1307.23, and a fall through could take it to the next support level of 1299.57. The pair is expected to find its first resistance at 1324.43, and a rise through could take it to the next resistance level of 1333.97.
The yellow metal is trading between its 20 Hr and 50 Hr moving average.
Silver: White Metal Reverses Its Losses This Morning
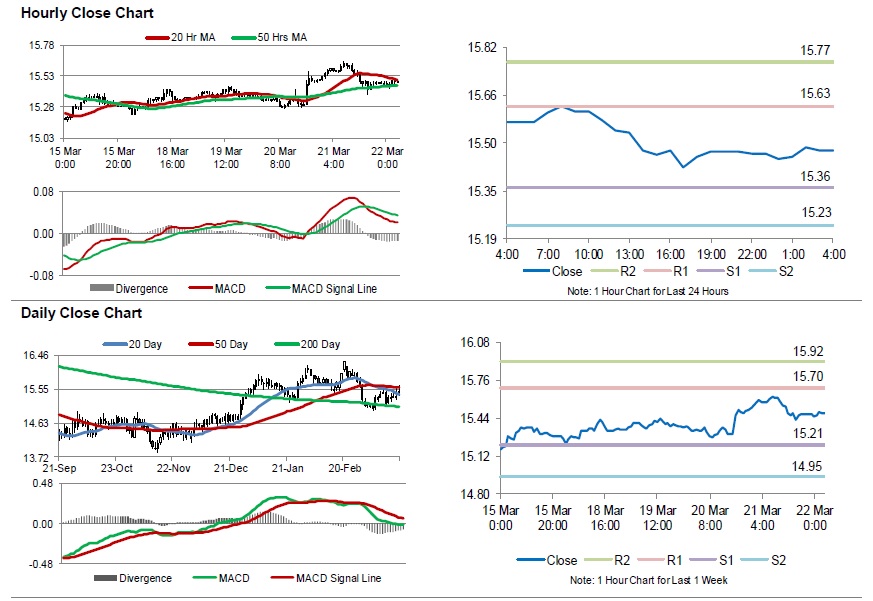
For the 24 hours to 23:00 GMT, Silver declined 0.23% against the USD and closed at USD15.47 per ounce.
In the Asian session, at GMT0400, the pair is trading at 15.48, with silver trading 0.06% higher against the USD from yesterday’s close.
The pair is expected to find support at 15.36, and a fall through could take it to the next support level of 15.23. The pair is expected to find its first resistance at 15.63, and a rise through could take it to the next resistance level of 15.77.
The white metal is trading between its 20 Hr and 50 Hr moving averages.
Crude Oil: Oil Trading Slightly Lower, Ahead Of Baker Hughes Weekly Rig Count Data
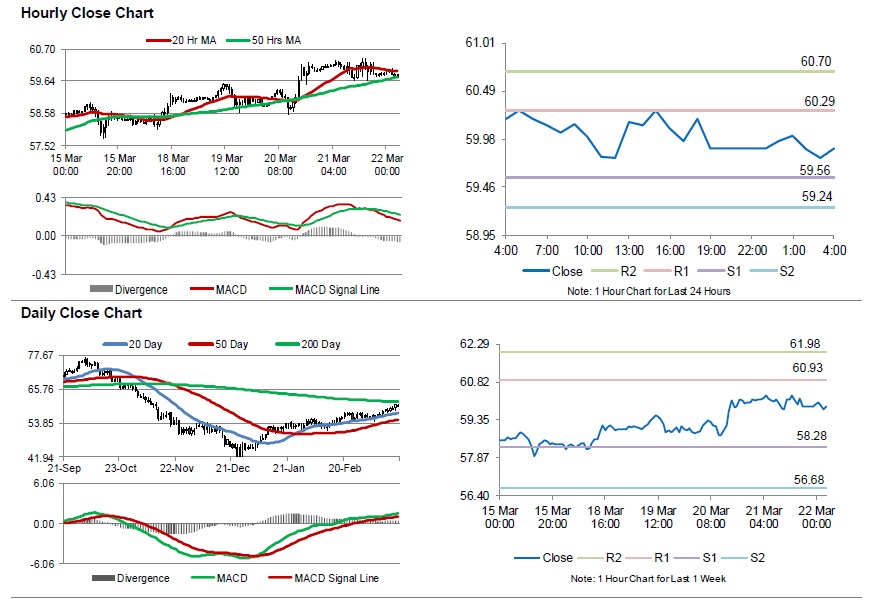
For the 24 hours to 23:00 GMT, Crude Oil declined 0.27% against the USD and closed at USD59.88 per barrel, amid global trade tensions.
In the Asian session, at GMT0400, the pair is trading at 59.87, with oil trading marginally lower against the USD from yesterday’s close.
The pair is expected to find support at 59.56, and a fall through could take it to the next support level of 59.24. The pair is expected to find its first resistance at 60.29, and a rise through could take it to the next resistance level of 60.70.
Crude oil is trading below its 20 Hr moving average and showing convergence with its 50 Hr moving average.
JGB Futures Track Recent Gains In US Treasuries
General Trend:
- Asian equity markets trade generally lower
- Japanese markets return from holiday, financials under perform after Fed decision
- Eisai expected to decline in Japan after plan to discontinue Alzheimer’s study
- IT and Property shares decline in Shanghai
- Tencent trades flat in early trade post earnings
- Sportswear company Li Ning rises after earnings
- China Mobile extends post earnings decline in HK
- Nike declines over 4% in afterhours trading post earnings
- Energy and Financial shares rise in Australia
- Japan Manufacturing PMI remained in contraction during March
- Australia 3-year bond yield moved further below RBA’s 1.50% cash rate
- Japan JGB Futures rise amid recent Fed decision
- Thailand is expected to hold general elections on March 24th (Sunday)
- China Commerce Ministry (MOFCOM): Confirms USTR Lighthizer and US Treasury Sec Mnuchin to visit China on March 28-29th (Thurs-Friday), China Vice Premier Liu He to visit the US in early April for trade talks
Headlines/Economic Data
Australia/New Zealand
- ASX 200 opened +0.4%
- (AU) Australia Mar Preliminary PMI Manufacturing 52.0 v 52.9 prior
China/Hong Kong
- Hang Seng opened +0.4%, Shanghai Composite flat
- (CN) Pres Trump reportedly is pushing negotiators to get China to raise its offer to buy US goods - CNBC
- (CN) China Ministry of Commerce (MOFCOM): Exports have good momentum in March
- (CN) China Finance Ministry: VAT cuts to be effective April 1st
- (CN) China Agriculture Ministry: Compensation for pigs culled due to African Swine Fever must be issued in timely manner; to stabilize hog production to control price rise
- (CN) Rating agency DBRS confirms China sovereign rating at 'A' high, trend revised to 'Negative' from 'Stable'
- (CN) China PBoC Open Market Operation (OMO): Skips for 3rd consecutive session
- (CN) China PBoC sets yuan reference rate: 6.6944 v 6.6580 prior
Japan
- Nikkei opened +0.5%
- (JP) Japan National CPI Y/Y: 0.2% v 0.3%e; CPI Ex Fresh Food (Core) Y/Y: 0.7% v 0.8%e
- (JP) JAPAN MAR PRELIMINARY PMI MANUFACTURING 48.9 V 48.9 PRIOR
- (JP) Japan Investors Weekly Net Buying of Foreign Bonds: -¥571.6B v ¥254.2B prior; Foreign Buying of Japan Stocks: -¥1.59T v -¥1.16T prior
- (JP) Japan Jan Final Leading Index: 96.5 v 95.9 prelim; Coincident Index: 98.1 v 97.9 prelim
Korea
- Kospi opened +0.4%
- (CN) Dept of Treasury issues sanctions on China-based companies over North Korea ties
- (KR) South Korea proposed to hold military talks with North Korea - South Korean Press
North America
- (US) US President Trump said to consider Stephen Moore for Federal Reserve Board
- (US) SEMI: Feb North America Billings: $1.86B, -1.7% m/m and -23% y/y
Europe
- (EU) EU Tusk: Offers Brexit delay, postponing no-deal risk from March 29th; Confirms if UK lawmakers back deal, UK will leave in 'orderly' way by May 22nd; Confirms if UK lawmakers do not agree to deal, UK will leave EU on April 12th.
- (UK) UK PM May: Welcomes council approval of assurances on backstop, confirms terms of extension; To build support for deal from tomorrow.
Levels as of 1:20 ET
- Nikkei 225, -0.4%, ASX 200 %, Hang Seng -0.3%; Shanghai Composite -0.4%; Kospi -0.2%
- Equity Futures: S&P500 -0.1%; Nasdaq100 -0.2%, Dax -0.3%; FTSE100 -0.4%
- EUR 1.1381-1.1361 ; JPY 110.89-110.65 ; AUD 0.7120-0.7094 ;NZD 0.6895-0.6874
- Gold +0.1% at $1,308/oz; Crude Oil -0.2% at $59.86/brl; Copper -0.2% at $2.905/lb
Elliott Wave View: S&P 500 (SPX) Testing 2018 High
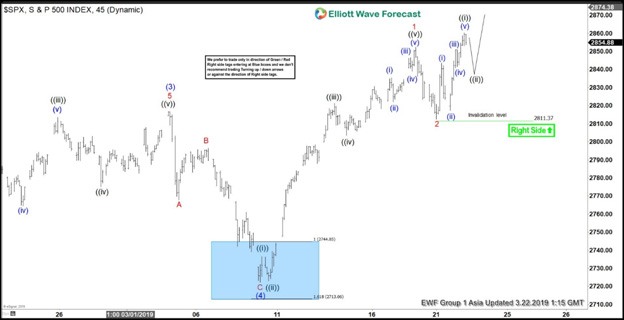
The rally from December 26, 2018 low in S&P 500 (SPX) remains in progress. We are labeling this rally as an impulse Elliott Wave structure, which is 5 waves structure. In the chart below, we can see wave (3) ended at 2816.88 and wave (4) ended at 2722.27. The internal of wave (4) unfolded as a zigzag Elliott Wave structure. Wave A of (4) ended at 2767.66, wave B of (4) ended at 2796.44, and wave C of (4) ended at 2722.27. Wave (4) pullback ended at our blue box inflection area where wave C = wave A. This blue box area is a high frequency area where both buyers and sellers agree in direction of the next move for 3 waves at least. Anyone who bought the dips at the blue box should now have a risk free trade where stop is at break even level.
The Index is currently in the last wave (5) rally which subdivides in 5 waves of lesser degree. Up from 2722.27, wave 1 ended at 2852.42 and wave 2 ended at 2811.37. Near term, while pullback stays above 2811.37, and more importantly above 2722.27, expect the Index to extend higher. Shorter cycle trend and momentum still points higher and we expect Index to find support in the dips in 3, 7, or 11 swing.
1 Hour SPX Elliott Wave Chart