

Sample Category Title
EU approved short Brexit extension, cliff edge delayed to April 12
At the European Council meeting in Brussels, EU approved a short Brexit extension for UK to decide which way they'd choose to go. If not Brexit deal is approved by the House of commons, The extension will be until April 12, when UK has to indicate a way forward. If a Brexit deal is approved, the extension will be until May 22. The offer is accepted by UK Prime Minister Theresa May.
EU President Donald Tusk said "the cliff edge will be delayed", adding that "I was really sad before our meeting, now I'm much more optimistic." He also noted, until April 12, "all options will remain open" and "the UK government will still have a choice between a deal, no deal, a long extension or revoking Article 50 "
May said after the summit that "what the decision today underlines is the importance of the House of Commons passing a Brexit deal next week so that we can bring an end to the uncertainty and leave in a smooth and orderly manner". She added "tomorrow morning, I will be returning to the U.K. and working hard to build support for getting the deal through."
Text of EU summit agreement on Brexit
1. The European Council takes note of the letter of Prime Minister Theresa May of 20 March 2019.
2. In response, the European Council approves the Instrument relating to the Withdrawal Agreement and the Joint Statement supplementing the Political Declaration agreed between the European Commission and the government of the United Kingdom in Strasbourg on 11 March 2019.
3. The European Council agrees to an extension until 22 May 2019, provided the Withdrawal Agreement is approved by the House of Commons next week. If the Withdrawal Agreement is not approved by the House of Commons next week, the European Council agrees to an extension until 12 April 2019 and expects the United Kingdom to indicate a way forward before this date for consideration by the European Council.
4. The European Council reiterates that there can be no opening of the Withdrawal Agreement that was agreed between the Union and the United Kingdom in November 2018. Any unilateral commitment, statement or other act should be compatible with the letter and the spirit of the Withdrawal Agreement.
5. The European Council calls for work to be continued on preparedness and contingency at all levels for the consequences of the United Kingdom's withdrawal, taking into account all possible outcomes.
6. The European Council will remain seized of the matter.
GOLD And Crude Oil Price Remain Supported On Dips
Gold price climbed towards the $1,320 level recently before correcting lower. Crude oil price is currently consolidating gains and remains supported on dips near $59.50.
Important Takeaways for Gold and Oil
- Gold price is placed nicely in an uptrend above the $1,300 support level against the US Dollar.
- There is a major bullish trend line in place with support at $1,305 on the hourly chart of gold.
- Crude oil price spiked above the $60.00 level before it ran into a connecting resistance trend line at $60.40 on the hourly chart of XTI/USD.
- The price is correcting lower, but it remains supported near the $59.50 and $59.20 support levels.
Gold Price Technical Analysis
Gold price started a solid upward move from well below the $1,295 level against the US Dollar. The price climbed above the $1,300 and $1,305 resistance levels to move into a positive zone.
The price even broke the $1,310 resistance and the 50 hourly simple moving average. It traded as high as $1,320 on FXOpen before sellers initiated a fresh downside correction. They pushed the price below the $1,310 support and the 50 hourly SMA.
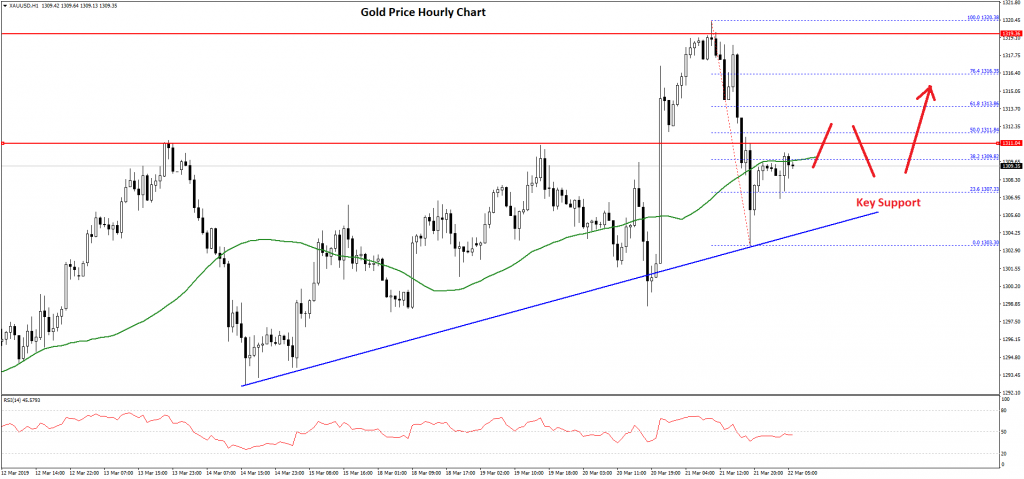
However, the price remained supported above the $1,300 level. A low was formed near $1,303 and recently the price corrected higher. It is currently testing the $1,310 resistance and the 50 hourly SMA.
Besides, the 38.2% Fib retracement level of the recent decline from the $1,320 high to $1,303 low is also near the $1,309 level. The next key resistance is near the $1,312 level, which acted as a hurdle for buyers on many occasions earlier.
The 50% Fib retracement level of the recent decline from the $1,320 high to $1,303 low is also near the $1,312 level. Therefore, a successful break above the $1,310 and $1,312 levels is must for the price to extend the current upward move.
If it declines once again, an initial support is near the $1,307 level. There is also a major bullish trend line in place with support at $1,305 on the hourly chart of gold.
Oil Price Technical Analysis
Crude oil price followed a slow and steady rise from the $57.50 support zone against the US Dollar. The price traded higher and broke the $58.00 and $58.80 resistance levels.
The price even settled above the $59.50 level and the 50 hourly simple moving average. Finally, there was a break above the $60.00 resistance area. However, the price faced a strong barrier near a connecting resistance trend line at $60.40 on the hourly chart of XTI/USD.
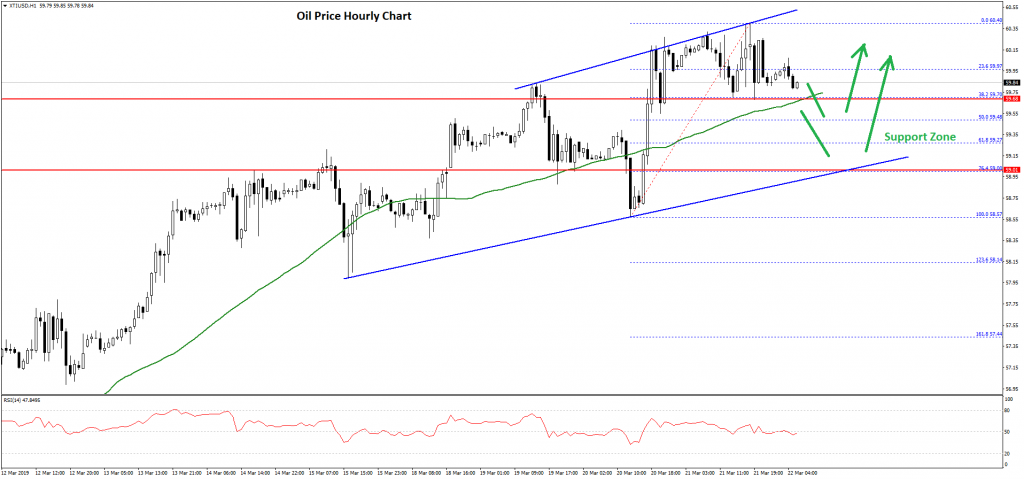
The price started a downside correction and traded below the $60.00 level. There was a break below the 23.6% Fib retracement level of the recent wave from the $58.57 low to $60.40 high.
However, there is a strong support formed near the $59.70 level and the 50 hourly SMA. The next key support is near $59.50 and the 50% Fib retracement level of the recent wave from the $58.57 low to $60.40 high.
If the price continues to move down, it is likely to find a strong support near the $59.20 level. On the upside, an initial resistance is at $60.20, above which the price is likely to clear the $60.40 high and trade further higher.
USD/JPY Could Correct Lower In Medium Term
Key Highlights
- The US Dollar found a strong resistance above 112.00 and recently declined against the Japanese Yen.
- Two important bearish trend lines are in place near 111.60 and 112.50 on the daily chart of USD/JPY.
- The US Initial Jobless Claims for the week ending March 16, 2019 declined from 230K to 221K.
- The US Manufacturing PMI for March 2019 (Preliminary) could rise from 53.0 to 53.6.
USDJPY Technical Analysis
In January and February 2019, the US Dollar followed a solid bullish path above 108.00 against the Japanese Yen. The USD/JPY pair traded above 110.00, but it found a strong resistance above 112.00 and later started a downside correction.
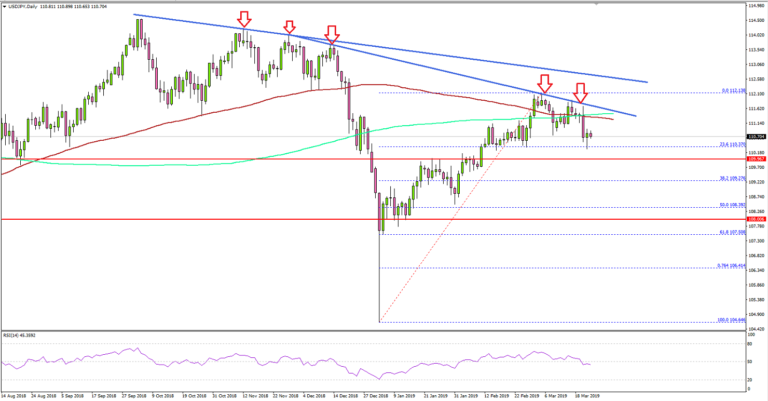
Looking at the daily chart, the pair traded as high as 112.13 and later corrected lower. The pair failed to hold gains above 111.60, the 200-day simple moving average (green), and 100-day simple moving average (red).
The pair tested the 23.6% Fib retracement level of the last wave from the 104.64 low to 112.13 high. An immediate support is near the 110.00 level, below which the pair could extend the downside correction.
The next key support is at 108.20-108.40, which also coincides with the 50% Fib retracement level of the last wave from the 104.64 low to 112.13 high. On the upside, there are two important bearish trend lines in place near 111.60 and 112.50 on the daily chart.
To remain in an uptrend, the pair must break both trend lines and settled above the 112.50 resistance level. If not, there is a risk of a downside correction towards the 110.00 or 108.20 support.
Fundamentally, the US Initial Jobless Claims figure for the week ending March 16, 2019 was released recently by the US Department of Labor. The market was looking for a decline in claims from 229K to 225K.
However, the actual result was better as the US Initial Jobless Claims declined to 221K. However, the last reading was revised up from 229K to 230K.
The report added:
The 4-week moving average was 225,000, an increase of 1,000 from the previous week’s revised average. The previous week’s average was revised up by 250 from 223,750 to 224,000.
Overall, the USD/JPY pair is facing a solid resistance near 112.00 on the daily chart, which may spark a solid decline in the near term.
Economic Releases to Watch Today
- Germany’s Manufacturing PMI for March 2019 (Preliminary) – Forecast 48.0, versus 47.6 previous.
- Germany’s Services PMI for March 2019 (Preliminary) – Forecast 54.8, versus 55.3 previous.
- Euro Zone Manufacturing PMI March 2019 (Preliminary) – Forecast 49.5, versus 49.3 previous.
- Euro Zone Services PMI for March 2019 (Preliminary) – Forecast 52.7, versus 52.8 previous.
- US Manufacturing PMI for March 2019 (Preliminary) – Forecast 53.6, versus 53.0 previous.
- US Services PMI for March 2019 (Preliminary) – Forecast 56.0, versus 56.0 previous.
- Canadian Consumer Price Index Feb 2019 (MoM) – Forecast +0.6%, versus +0.1% previous.
- Canadian Consumer Price Index Feb 2019 (YoY) – Forecast +1.4%, versus +1.4% previous.
Market Morning Briefing: Aussie Is Headed Towards Resistance At 0.72
STOCKS
Global indices looks mixed in the near term. The bias remains bullish. But a sideways consolidation is possible in the near term before we see fresh rallies in them. The Indian indices, Sensex and the Nifty 50 continues to look stronger than the global equities and can move further higher to revisit the record highs in the coming days.
Dow (25962.51, +216.84, +0.84%) remains mixed and has been oscillating around the 21-day moving average (25817) over the last few days. A range-bound move between 25650 and 26125 is possible for some time. A breakout on either side of 25650 or 26125 will decide the next move.
DAX (11549.96, -53.93, -0.46%) has come-off in the last couple of days after testing 11800. Support for it is at 11450 which can be tested in the near term. A bounce thereafter can take the index higher again to 11600 and higher levels.
Nikkei (21563.09, -45.83, -0.21%), though stuck in a narrow range over the last few days, is managing to sustain above the 21-day moving average support level of 21470. This keeps the bullish bias intact for a rise to 21900-22000 in the short term.
Shanghai (3068.37, -33.08, -1.07%) continuing to hover near 3100. The index seems to be waiting for some trigger to breach 3100 and rally to 3150-3180.
Sensex (38386.75, +23.28, +0.06%) and Nifty (11521.05, -11.35, -0.10%) which were closed yesterday on account of public holiday are likely to open positive today. Sensex is likely to breach 38500 and target 39000 in the coming days. Support for it is in between 38150 and 38000. Nifty 50 can surge to 11700-11750 while it sustains above 11500.
COMMODITIES
Gold and Silver is turning bullish in the near term and could see some further upticks in the coming sessions. Copper continues to consolidate within its uptrend. Brent continues to trade mixed with a bullish bias. WTI looks relatively more positive than Brent and can move higher in the near term.
Gold (1309) and Silver (15.48) has come-off sharply after testing 1320 and 15.63 respectively. However, the bias remains bullish. Gold has cluster of supports between 1305 and 1300. Gold can revisit 1320. An eventual break above 1320 can then take it further higher to 1330-1333. Silver on the other hand can test 15.7 on a decisive break above 15.55
Copper (2.91) spiked to 2.97 and has come-off from there. The 2.88-2.95 sideways consolidation is likely to continue for some more time. The bias however continues to remain bullish for copper to break 2.95 and test 2.98 and 3.0.
Brent (67.75) has been struggling to breach the resistance around 68.50 over the last few days. But as long as it sustains above 67, the chances are high of it to break 68.5 and target 70 in the coming days. Supports below 67 are at 66.6 and 66.15.
WTI (59.9) has risen above the key resistance at 59.5 and continues to trade stronger than Brent. While above 59.5, an upmove to 61.2 and 61.8 is possible in the near term.
FOREX
Dollar-Index (96.33) saw a sharp fall to 95.75 yesterday after the FED reaffirmed its dovish policy stance. The FED also mentioned that the unwinding of its balance sheet would end in September. Although the index is trading higher just now, there is scope of testing 95.25 on the downside before again rising back to higher levels above 96.50.
Euro (1.1374) has come off from 1.1450 in the last 2-sessions and could possibly fall to test 1.1340-1.1330 levels just now. Thereafter, if the pair does not break below 1.13 immediately, we could see another attempt of rising towards 1.1450 or higher.
Euro-Yen (125.94) has fallen as expected. A test of 125.20 is on the cards for the next 1-2 sessions. Thereafter, we need to see if the pair bounces back from 125.20 or falls below to initiate further bearishness.
Dollar Yen (110.73) has clearly broken below 111 and could target 110.0-109.5 in the near term.
Aussie (0.71) is headed towards resistance at 0.72 and could face rejection from there which could push Aussie towards 0.71 again in the near term.
Pound (1.3141) tested support at 1.30 yesterday and has opened with a gap up. It could move up in the next few sessions targeting 1.32-1.33 again.
USDCNY (6.70) could move up to test 6.7330 in the near term before coming down from there sharply. Overall medium term charts show possible strength in the Yuan towards 6.65 or even lower.
Dollar-Rupee (68.83) could test 68.70/60 on the downside. Overall trade today is expected to be below 69. Next week could possibly see a bounce back to levels above 69, targeting 69.50.
INTEREST RATES
The US yields have fallen sharply contrary to our expectation of a rise. The 2YR (2.40%), 5Yr (2.33%), 10Yr (2.53%) and the 30YR (2.96%) are trading lower. Near term looks bearish while the yields may continue to fall over the next few sessions before a corrective upmove is seen.
The German-Japan 10Yr spread (0.11%) has dipped and could fall further towards 0.08% in the near term. This could pull down EURJPY also.
The US-JGB 10Yr (2.59%) is also trading lower and could fall to 2.47% in the near term.
USDCAD Eyes More Upside Pressure On Corrective Recovery
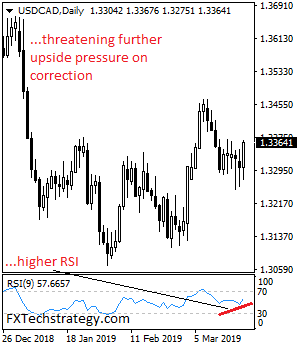
USDCAD eyes more upside pressure on corrective recovery as it saw a rally on Thursday. Support comes in at the 1.3300 level where a break will aim at the 1.3250 level. Further down, support comes in at the 1.3200 level where a turn lower may occur. But if further weakness is triggered support comes in at the 1.3150 level. Conversely, resistance lies at the 1.3400 level where a violation will target the 1.3450 level. Further up, resistance resides at the 1.3500 level and then the 1.3550 level. Its daily RSI is bullish and pointing higher suggesting further upside pressure. All in all, USDCAD looks to strengthen further higher on more correction.
Eco Data 3/22/19
[php_everywhere instance="1"]
Stop Brexit petition breaks 1M, Leadsom said there’s case to act if it breaks 17.4m
A petition calling for UK government to revoke Article 50 Brexit request and stay in the EU gains traction today. At the time of writing, it has already collected more than 1M signatures. According to the Parliament website, would consider the petition for debate if it surpassed 100,000 signatures.
House of Commons Leader Andrea Leadsom said earlier that "should it reach more than 17.4 million respondents then I'm sure there would be a very clear case for taking action".
https://twitter.com/BBCPolitics/status/1108708533019832323
IMF supports Fed’s pause in rate hikes
The IMF expresses its support for Fed to halt it rate hike cycle.
IMS spokesman Gerry Rice said: "Given the range of global uncertainties facing the U.S. economy, we support the Fed's decision to be patient in determining future changes to the Federal Funds rate".
Also, "the Federal Reserve's continued adherence to the principles of data dependence and clear communication, we believe, will help to minimize any market disruptions and spillovers from its policy decisions."
France Macron warns: Pass the Brexit deal and get short extension, or no deal
EU officials are generally raising the pressure on UK for passing the Brexit deal. French President Emmanuel Macron said in Brussels that "I am quite open to a technical extension - it should be as short as possible - in the case of a positive vote." However, "in the case of a negative vote in the British parliament, we will be going to a no-deal. We all know that."
He emphasized: "It is absolutely essential to be clear in these days and these moments, because it is a matter of the good functioning of the EU. We cannot have what I would call an excessive extension which would harm our capacity to decision and to act."
Eurozone PMIs Could Dictate Euro’s Near-Term Path
The Eurozone will be on the receiving end of preliminary PMIs for March on Friday, at 09:00 GMT. Economic growth has slowed drastically lately, leading the ECB to redeploy its ‘shock and awe’ tactics, and push back the timing of its first planned rate increase. Against this backdrop, these data could prove crucial for the euro, as they will provide an early glimpse of how the bloc’s economy ended Q1.
The euro area lost considerable momentum in recent quarters, with yearly GDP growth slowing from a peak of 2.7% in Q4 2017, to an anemic 1.1% in Q4 2018. Much of this weakness emanates from the traditional ‘engine’ of European growth, Germany, though other key economies like France and Italy aren’t faring much better. In particular, the manufacturing sector has been at the epicenter of the softness, as a slowdown in global growth combined with the threat of US tariffs on European cars are clouding the outlook for exports.
After a long period of considering this deceleration ‘temporary’, the European Central Bank (ECB) finally came to terms with reality at its latest meeting in early March. Policymakers decided to shock markets by taking action over and above what was expected, namely by pushing back the timing of their first planned rate increase, effectively loosening financial conditions in an effort to stimulate the economy.
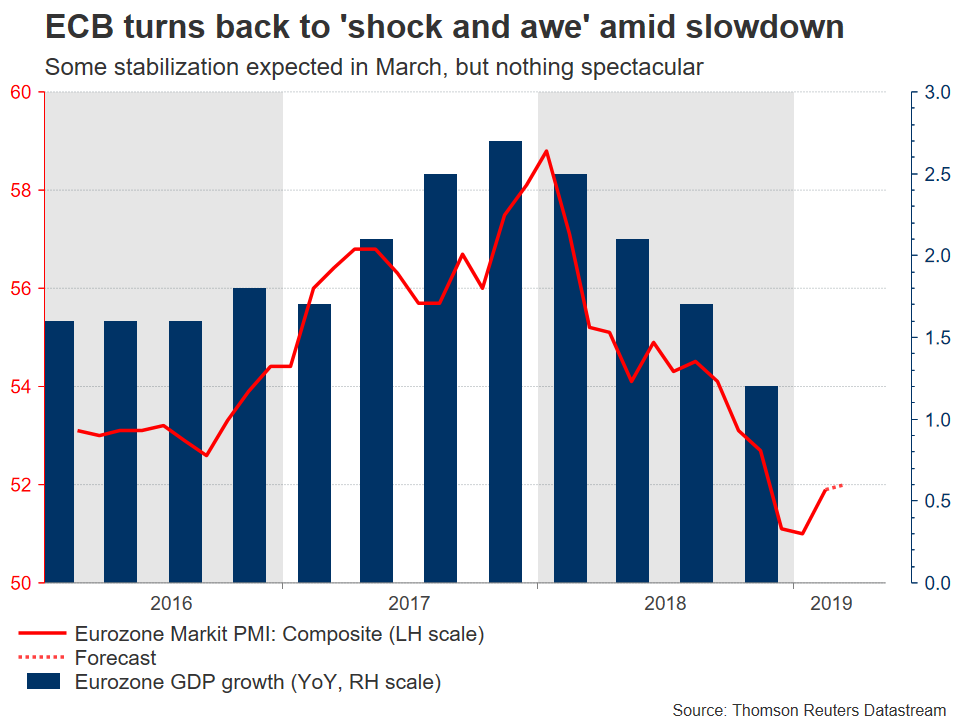
Against this backdrop, the upcoming PMIs could be crucial in shaping expectations around future ECB policy and by extent, for the euro’s direction. Mainly because they are released ahead of official data, and therefore provide an early snapshot of economic performance. In March, the manufacturing index is expected to rise to 49.5, from 49.3 previously – though that would still leave the print in contractionary territory below 50. Meanwhile, the services PMI is forecast to tick down to 52.7 from 52.8 earlier. Hence, the composite index that blends the two measures is seen rising marginally to 52.0, from 51.9 in February.
If the actual prints meet expectations, that would indicate some stabilization in economic activity, which could be seen as a soft signal that a rebound may lie ahead. On the margin that could prove positive for the euro, though admittedly, for the single currency to truly make a substantial break higher, traders would probably need to see a much more significant rebound in these figures.
The French and German prints will be released ahead of the euro area-wide data, specifically at 08:00 GMT and 08:30 GMT respectively – any market reaction could begin with them.
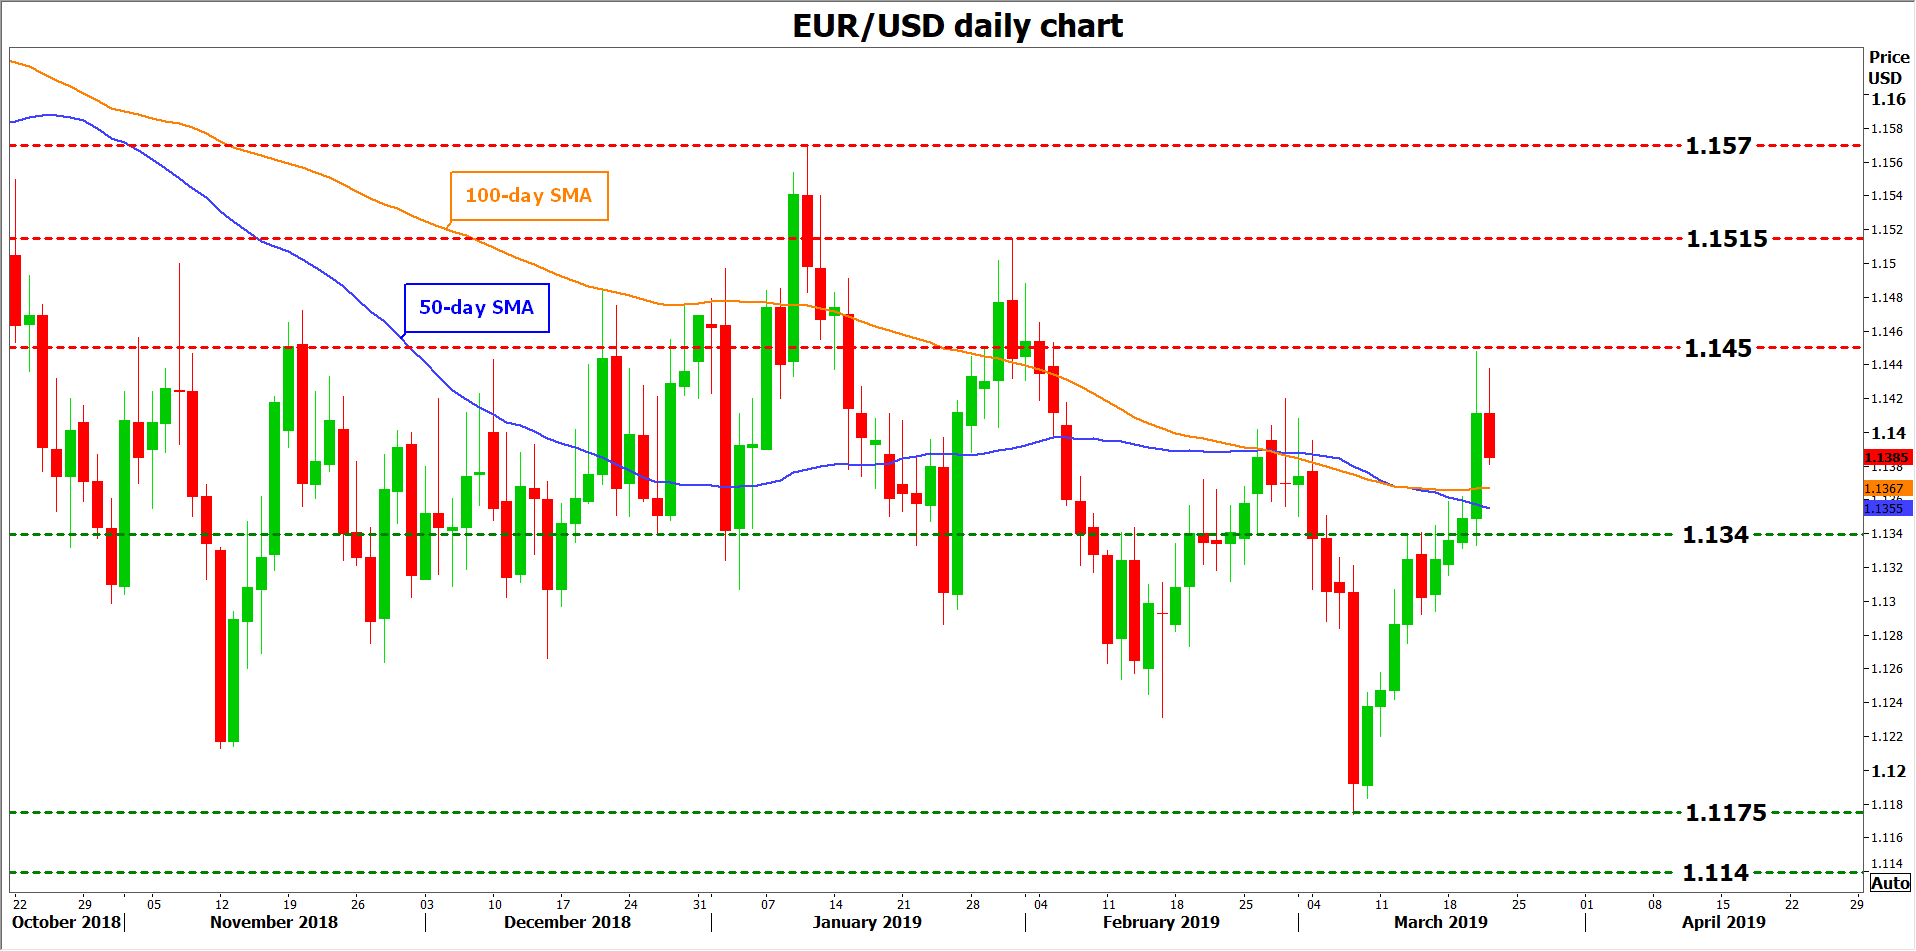
Technically, potential resistance to advances in euro/dollar may be found near 1.1450, the area that capped that rally on March 20, with an upside break opening the door for 1.1515. On the flipside, declines in the pair – perhaps on a disappointing set of PMIs – could stall initially around the 1.1340 territory, where both the 50- and 100-day simple moving averages (SMAs) are roughly located as well.
As a final note, any developments in the ever-evolving Brexit saga could also impact the euro, given the bloc’s exposure to the damaging effects of a potential no-deal outcome. Of course, to a lesser extent than the pound itself.