Sample Category Title
Bears Control USD/JPY After Break Below Uptrend Channel
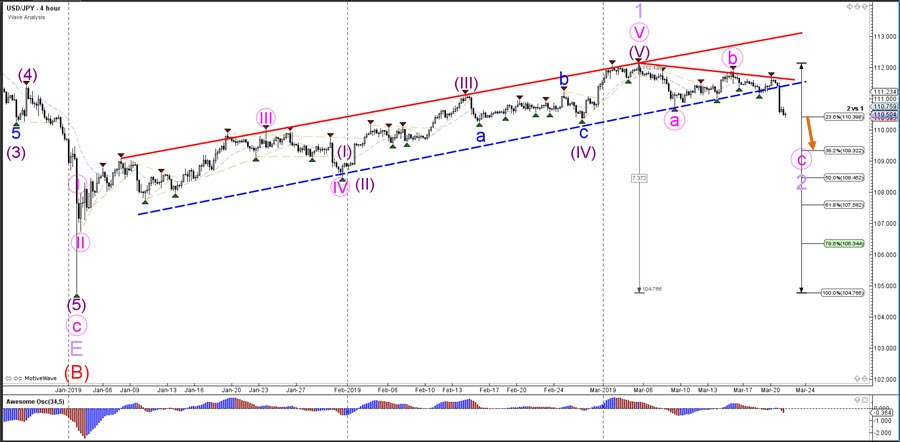
The previous USD/JPY wave outlook was invalidated with the bearish breakout. The wave pattern has therefore been changed and now the wave 1 (purple) has been placed on the most current top. The current pullback could be a wave 2 (purple) and price could fall towards the Fibonacci retracement levels of wave 2 vs 1.
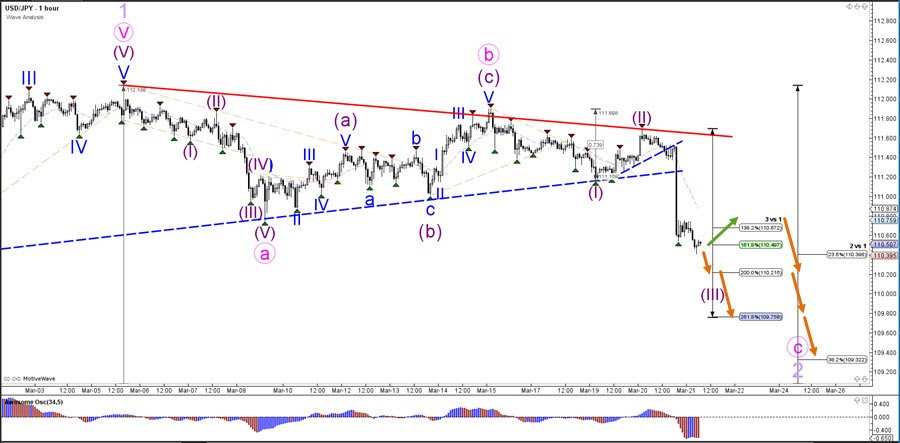
The USD/JPY bearish breakout is showing strong impulsive price action. An extension of the momentum towards the Fibonacci targets of wave 3 vs 1 is possible. A light pullback could also take place before price continues lower within the wave C (pink) of the zigzag.
AUD/USD Surges After US Federal Reserve Meeting
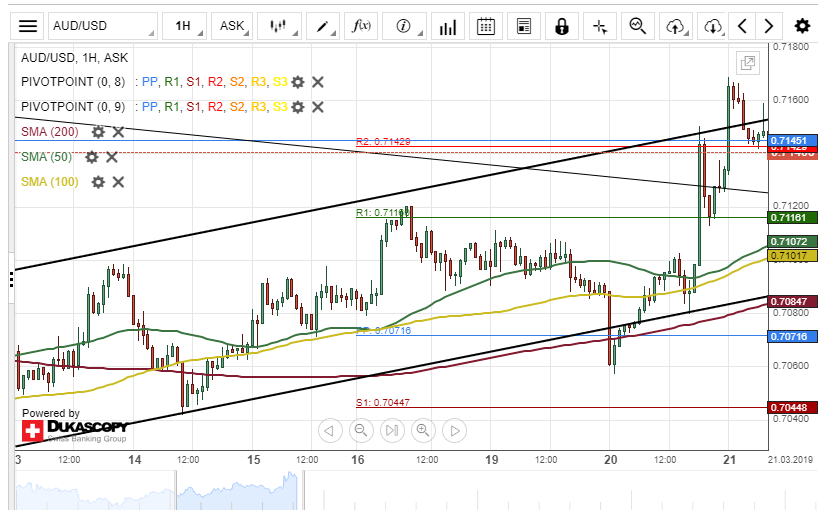
Upside risks dominated the Australian Dollar versus the US Dollar on Wednesday. The currency pair has gained about 1.58% in value since Wednesday's trading session.
Most likely, downside sentiment might be introduced in the market within this session. The possible targets for bearish traders will be near a support cluster formed by the combination of the 50– and 100-hour SMAs at 0.7105.
However, technical indicators suggest otherwise on the 4(H) chart. The sentiment demonstrates that the surge could continue during the following trading session.
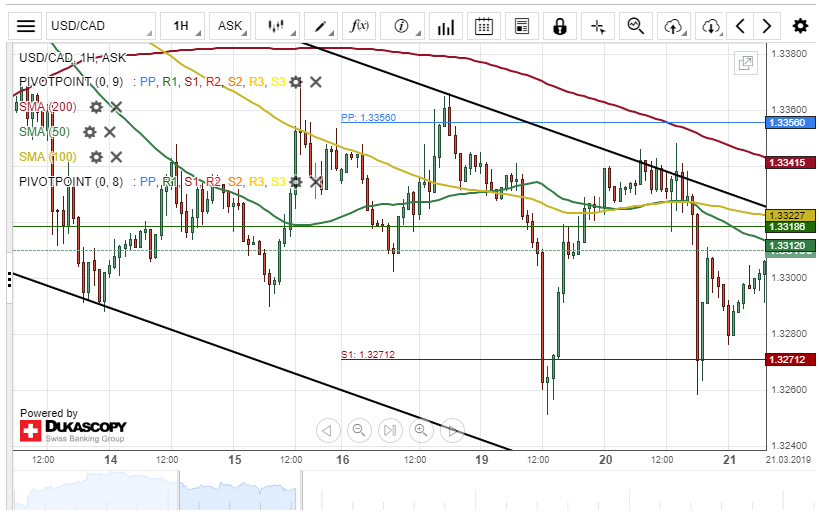
USD/CAD Decline After FOMC Decisions
Downside risks prevailed in the market on Wednesday, thus sending the US Dollar to declined about 90 base points against the Canadian Dollar. The cause of the drop was mostly related to the US FOMC meeting.
Everything being equal, it is likely that the USD/CAD currency pair will regain some of its lost position within this trading day. Bullish traders could push the exchange rate towards a resistance line formed by the 200-hour simple moving average at the 1.3342 area.
However, the monthly pivot point at 1.3318 could hinder the currency exchange rate to hit the predicted numbers within this session.
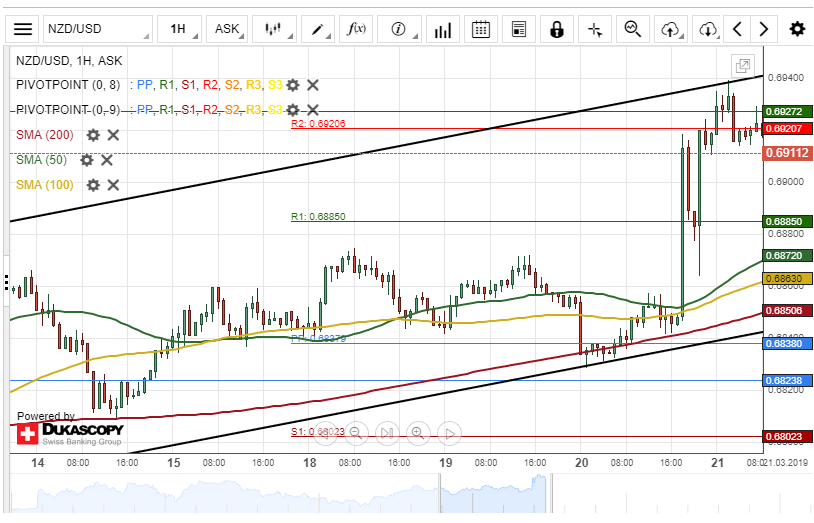
NZD/USD Surge After Federal Fund Rate
Upside momentum pressured the New Zealand Dollar higher against the US Dollar on Wednesday. The reason for the surge was mostly related to the US FOMC meeting. The currency pair gained about 107 base points during yesterday's trading session.
Most likely, bears could drag the exchange rate towards the weekly pivot point at 0.6885 within this session.
If the support level holds, the currency exchange rate will continue its movement in the medium-term ascending channel during the following trading session.
Meanwhile, technical indicators flash buy signals on both the smaller and the larger time frames chart.
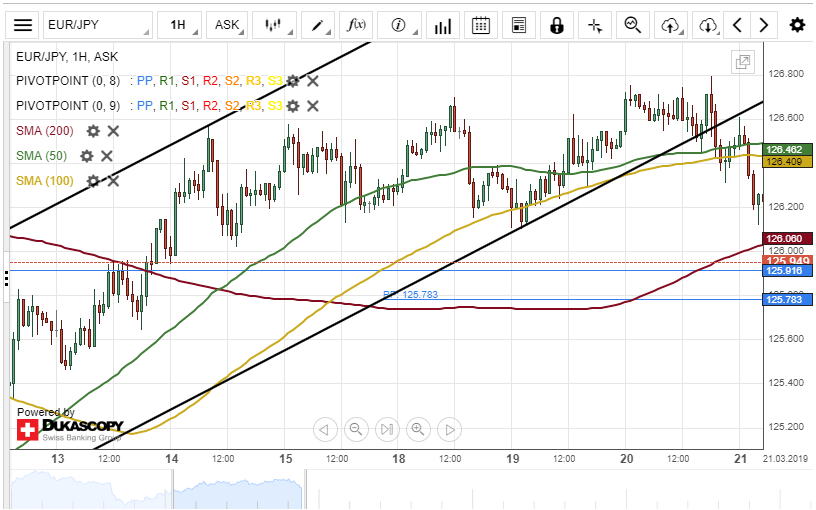
EUR/JPY Breakout Occurs
Downside risks have dominated the common European currency against the Japanese Yen since Wednesday's trading session. The currency pair has lost about 0.75% in value during the last 24 hours.
Everything being equal, it is likely that the EUR/JPY exchange rate will regain some of its lost position during the following trading session. The potential upside target will be near a resistance cluster at 126.47.
However, given that a breakout had occurred through the lower boundary of an ascending channel pattern, the decline of the currency exchange rate could continue today.
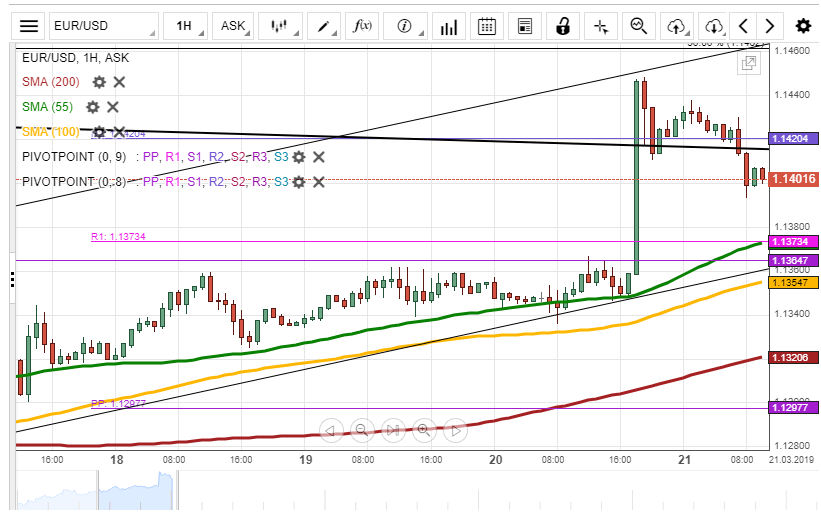
EUR/USD Breaks Most Of Technical Indicators
During Wednesday's trading session, the European Single Currency jumped to the 1.1440 level breaking most of the technical indicators to end the trading session at R2 at the 1.1420 mark. On Thursday morning, the rate depreciated to the previously drawn small pattern at the 1.1395 mark.
In regards to the near-term future, most likely, the medium pattern line will support the rate to push it to break the resistance of the R2 at the 1.1420. It is expected that the rate will end the trading session at the 1.1450 level.
Besides, the 55-hour simple moving average will try to catch up the rate to support it during the trading session.
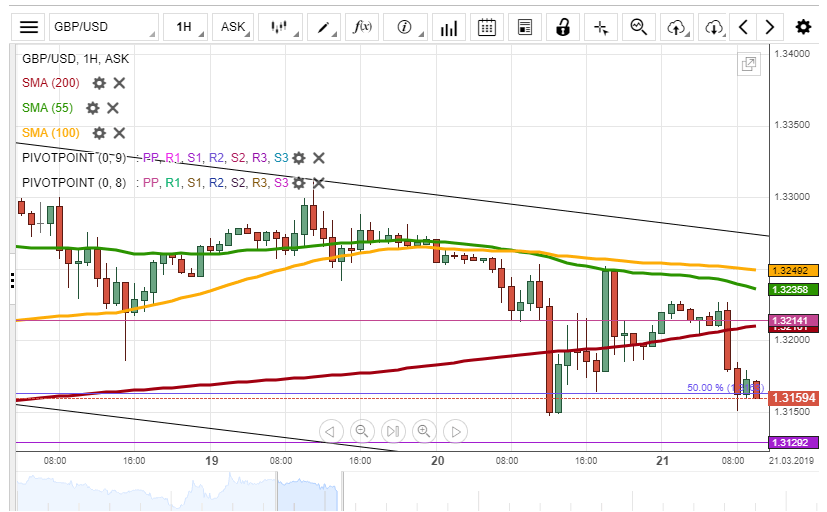
GBP/USD Might Pass Monthly PP At 1.3129
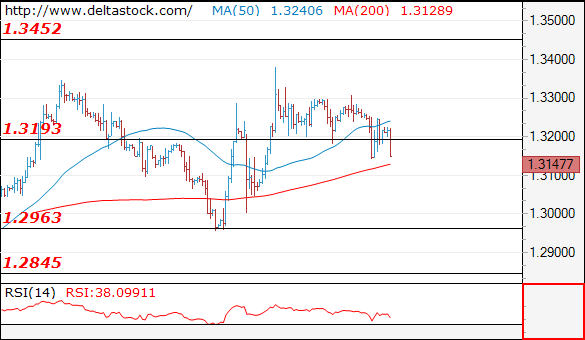
During Wednesday's trading session, the currency exchange rate passed the support level of the 200-hour simple moving average to end the trading session at 1.3200. On Thursday morning, the rate was located at the 50.00% Fibo at 1.3163. Note, the chart was fully reviewed to draw a new pattern!
In regards to the near-term future, it is expected that the British Pound will be trading below the 50.00% Fibonacci retracement level to stay at the 1.3100 level.
On the other hand, today's UK Retail Sales at 9:30 GMT might push the British Pound to appreciate against the US Dollar to the 1.3200 level.
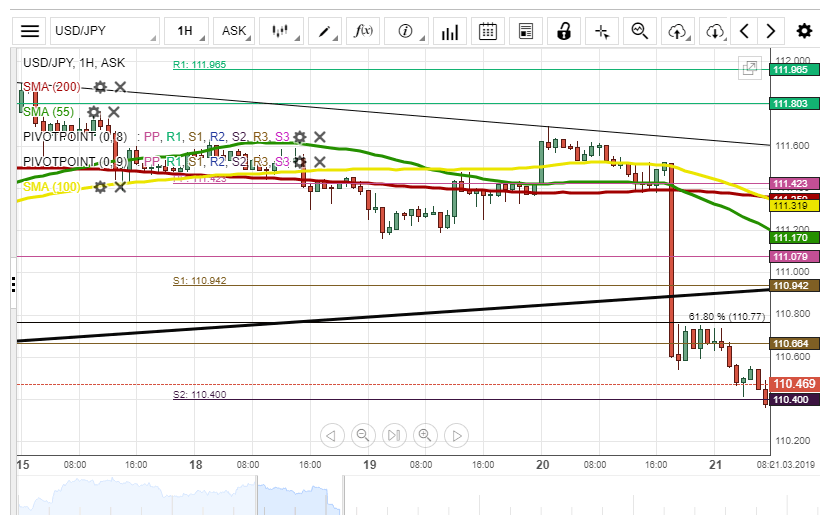
USD/JPY Slumps To 110.20
During Wednesday's trading session, the US Dollar depreciated against the Japanese Yen by 102 pips or 0.91 base point to end the trading session at 110.60. On Thursday morning, the US Dollar kept depreciating against the Japanese Yen to be located at the 110.44 mark.
In regards to the near-term future, most likely, the rate will trade sideways between the weekly S2 at 110.40 and the weekly S3 at 109.91 to stay at the 110.20 level.
However, the weekly S2 could retrace the rate to push it to break the resistance level of the monthly pivot point at 110.53 to trade near the 61.80% Fibonacci retracement level at the 110.77 mark.
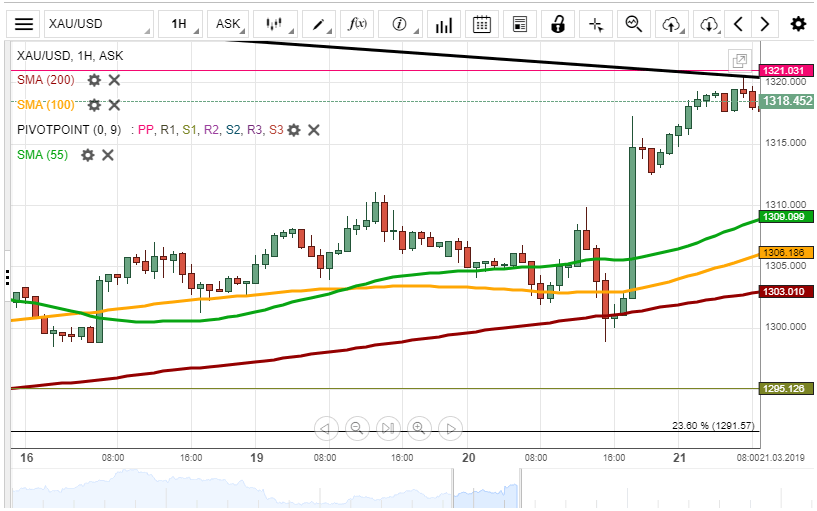
XAU/USD Surged To 1,315.00
During Wednesday's trading session, the yellow metal appreciated against the US Dollar to 1,315.00 level breaking the pattern line at 1,310.00. On Thursday morning, gold was trading sideways at the 1,318.54 mark.
In regards to the near-term future, most likely, the rata will be trading sideways to end the trading session at the 1,310.00 level.
Besides, the simple moving averages will try to catch up on the rate during the day.
Forex Technical Analysis: EUR/USD, USD/JPY, GBP/USD
EUR/USD
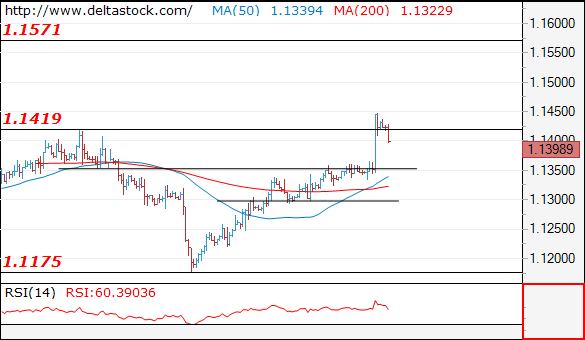
Current level - 1.1398
The massive rise through 1.1350 resistance and the violation of 1.1420 high signal a major reversal and the whole slide since 1.1570 peak should be considered complete. The outlook is positive above 1.1360, for another leg upwards, to 1.1570. Crucial on the dowsnide is 1.1290 low.
| Resistance | Support | ||
| intraday | intraweek | intraday | intraweek |
| 1.1450 | 1.1570 | 1.1360 | 1.1175 |
| 1.1570 | 1.1830 | 1.1290 | 1.0860 |
USD/JPY
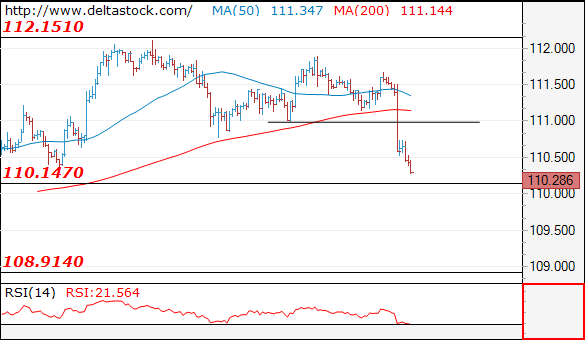
Current level - 110.28
The impulside break through 111.00 area signals a stong negative bias and after a brief consolidation here, another leg downwards should be expected, toward 108.90.
| Resistance | Support | ||
| intraday | intraweek | intraday | intraweek |
| 111.00 | 113.00 | 110.20 | 110.20 |
| 112.15 | 114.50 | 108.90 | 108.50 |
GBP/USD
Current level - 1.3147
The violation of 1.3190 support risks a deeper drowning, towrads 1.3040 area. Crucial on the upside is 1.3300 and only a return above that area will renew the challenge of 1.3450.
| Resistance | Support | ||
| intraday | intraweek | intraday | intraweek |
| 1.3300 | 1.3450 | 1.3040 | 1.2800 |
| 1.3450 | 1.3450 | 1.2960 | 1.2610 |