Sample Category Title
GBP/USD Outlook: GBP/USD Hit Three-Week Low On Probe Below 200SMA Ahead Of Brexit Vote
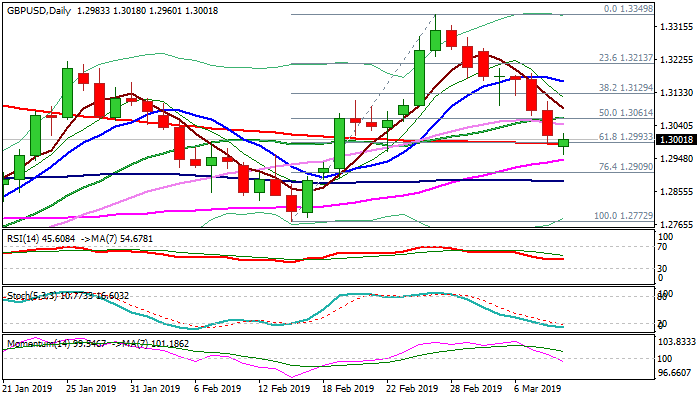
Cable ticked higher in early European trading on Monday, following gap-lower weekly opening and probe below significant supports at 1.30/1.2993 (psychological/200SMA/Fibo 61.8% of 1.2772/1.3349).
Uncertainty ahead of last parliamentary vote on PM May's Brexit plan keeps sterling under pressure, which increased on comments from top UK officials over the weekend that Brexit could be reversed if the deal will be rejected on Tuesday's vote.
The pair was in red for the seven straight sessions, ending previous week with 1.8% loss (the biggest weekly fall since late Oct).
Bears may show stronger hesitation at 200SMA support after probe below and dip to three-week low (1.2960) found footstep just ahead of top of thick daily cloud / 55SMA (1.2944), as daily stochastic is oversold.
Rising bearish momentum keeps the downside in focus, with limited upticks seen as positioning ahead of final push through 1.2993/44 pivots.
This would expose 100SMA (1.2885) and risk acceleration towards 1.2772 (14 Feb trough).
Broken 30/20SMA's (1.3043/64) offer solid resistances which should cap upticks and keep bears intact.
Res: 1.3018, 1.3043, 1.3064, 1.3088
Sup: 1.2960, 1.2944, 1.2909, 1.2885
US Dollar Resumes Rally After Completing Pullback
In this blog, we take a look at US Dollar Index correlation with USDPLN and we also look at the updated Elliott wave charts of USDPLN which have been working very nicely since we highlighted the bullish sequence in USDPLN back in February 2019. USDPLN had broken above the October 2018 peak and was showing 5 swings up from 9.26.2018 low which created a 5 swings bullish Elliott wave sequence and called for more upside after a pull back. We made it clear that our strategy was to look for buying opportunities in the dips.
Right after we published our blog, US Dollar started pulling back against PLN and retraced 50% of the rally from 1.31.2019 low. It also reached 100% Fibonacci extension of ((a))-((b)) down from the peak before bouncing again. Let’s take a look at the updated Elliott wave charts of USDPLN forex pair.
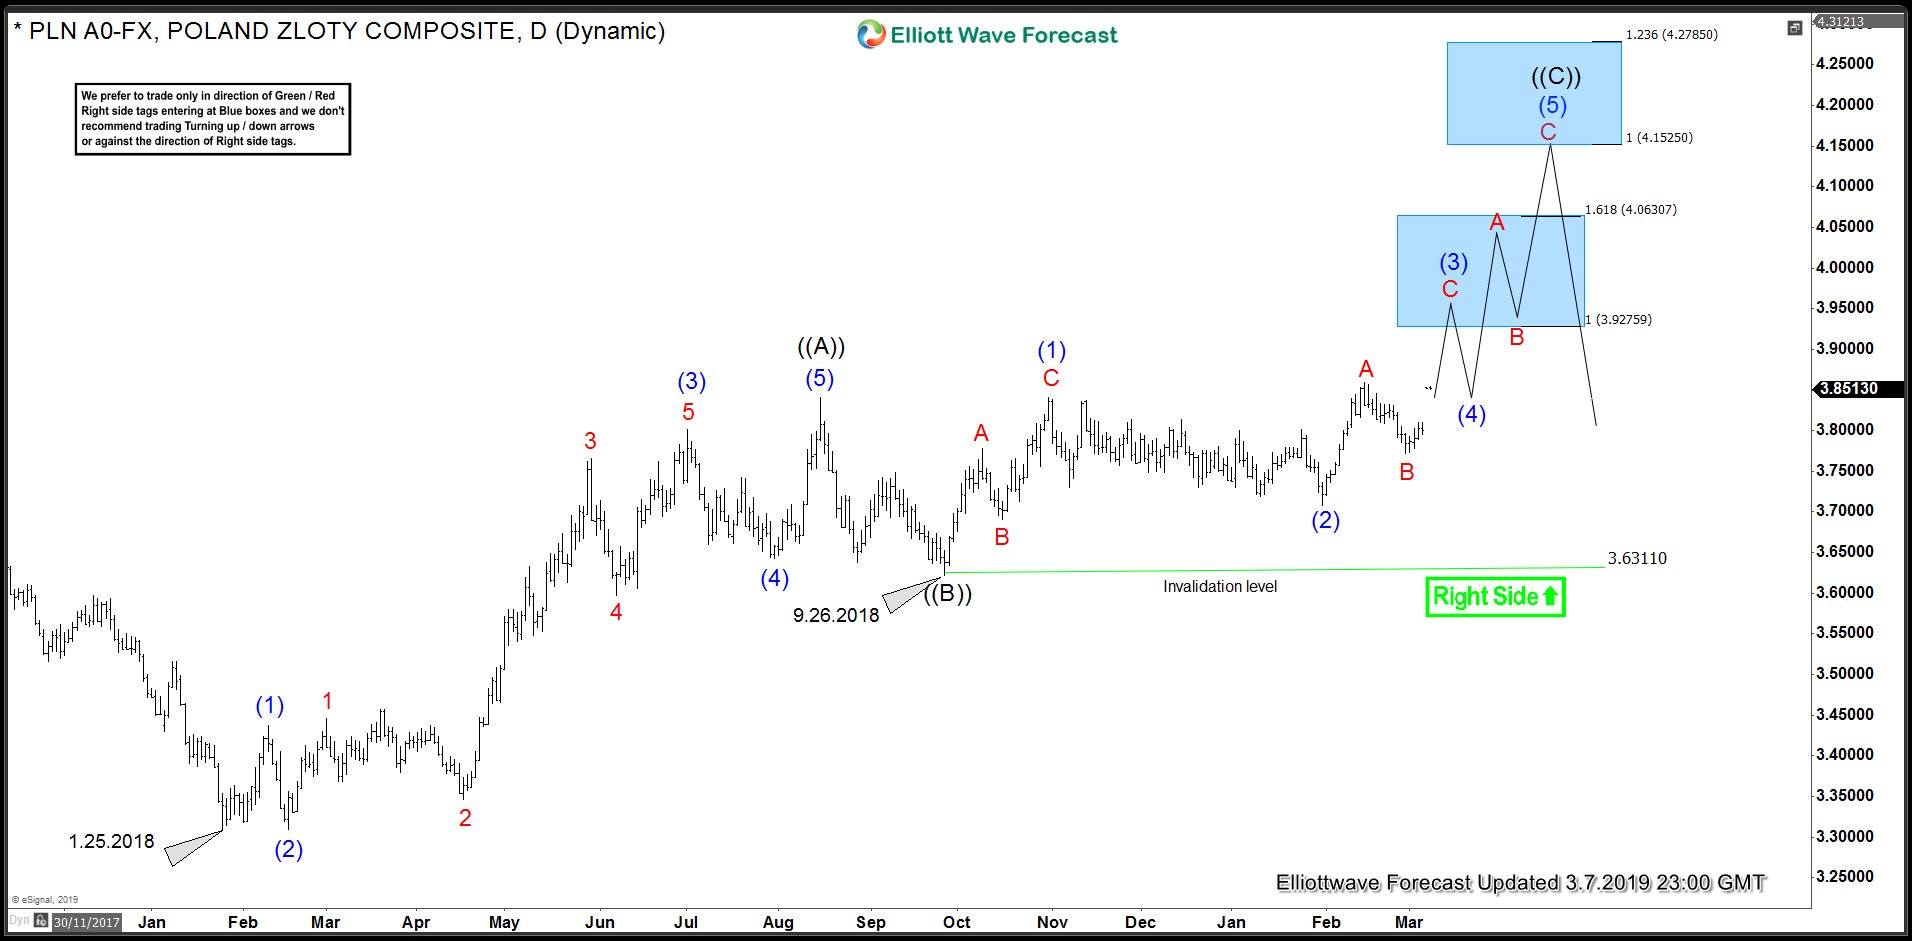
US Dollar (USDPLN) Daily Elliott Wave Analysis 3.7.2019
USDPLN closed just below February 14 peak, rally from February 28 low appears impulsive as we will see on the 1 hour charts below which makes the break higher a very likely scenario. Break above February 14 peak exposes 3.9275 area which is 100% Fibonacci extension of blue (1)-(2) cycles where as 100% Fibonacci extension of red A-B lies just below at 3.92.
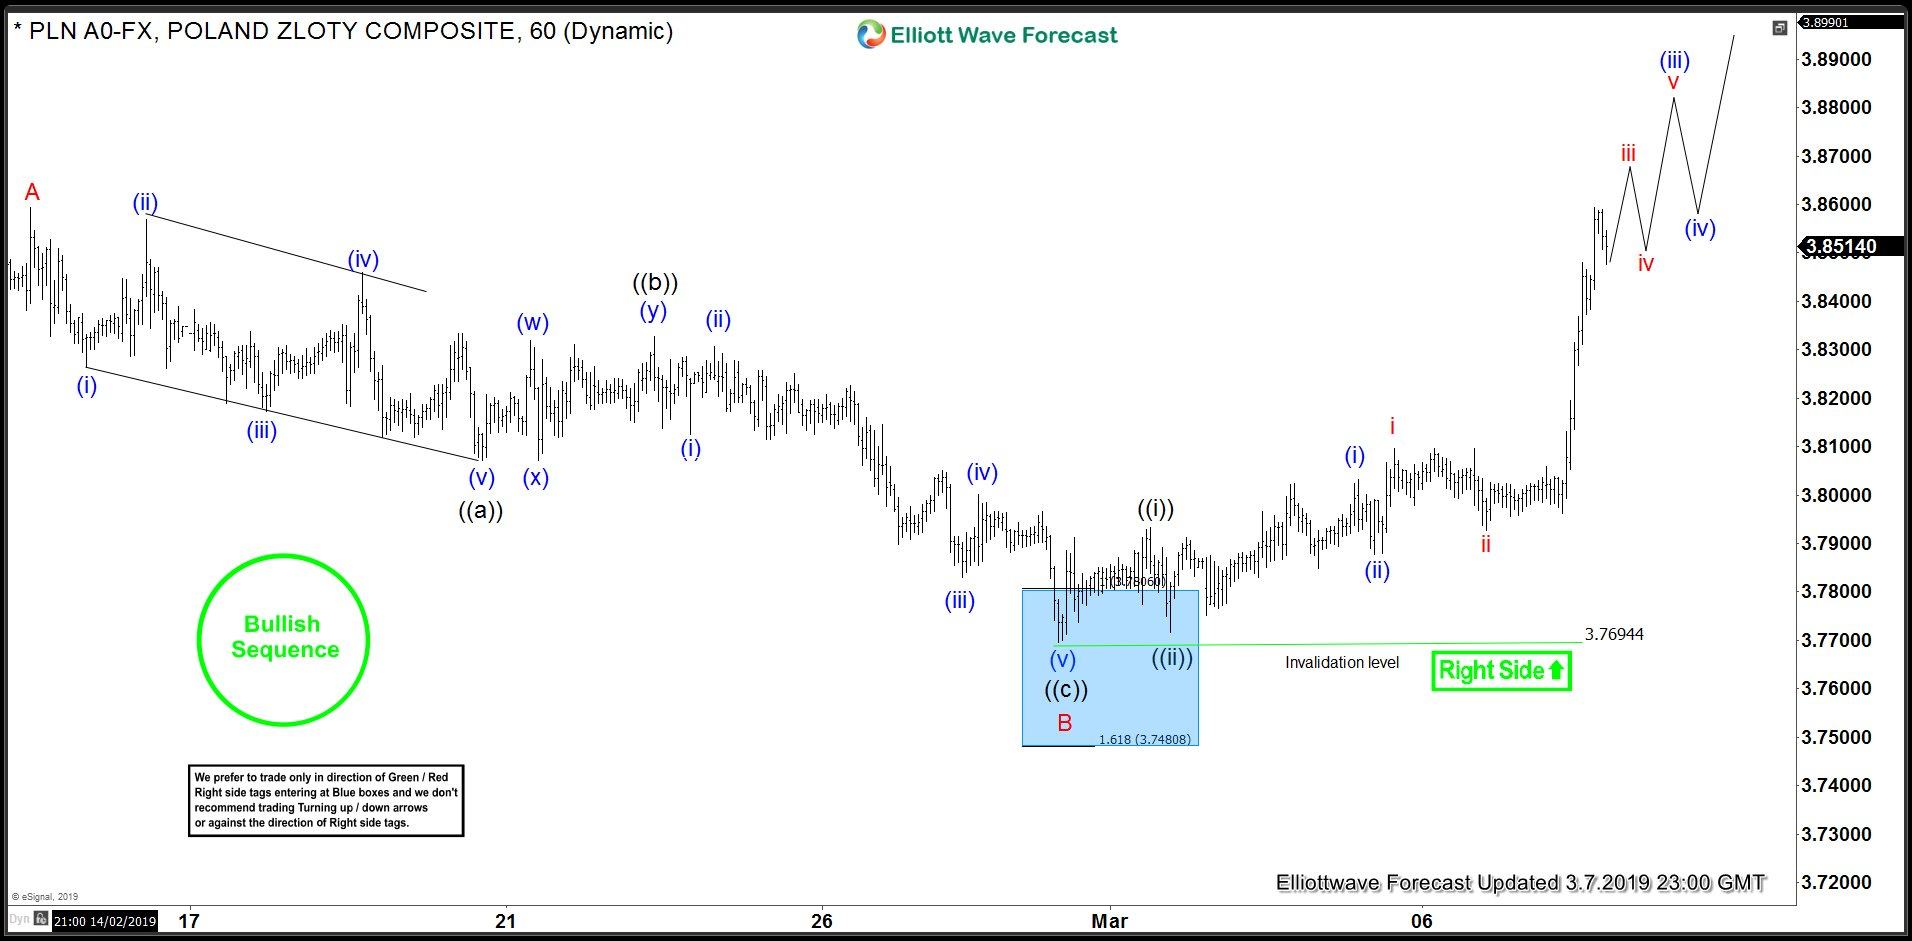
USDPLN 1 Hour Elliott Wave Analysis 3.7.2019
Rally from February 28 low appears to be unfolding as an Elliott wave impulse and it could be counted in two different ways as shown below. Once February 14 at 3.8594 is broken, expect buyers to appear again in the pull backs in 3, 7 or 11 swings for extension higher. Chart below shows the pair to be already within wave (iii) of ((iii)) which means pull backs would be shallow going forward until we reach 3.92 target area. Wave (iv) blue and wave ((iv)) black pull back later should offer short-term buying opportunities under this scenario.
This scenario suggests we are still in wave ((i)) and calls for a relatively larger pull back in wave ((ii)) once wave ((i)) completes before pair continues higher in wave ((iii)) of C. Wave ((ii)) pull back should see buyers appear in the pull backs after 3, 7 or 11 swings.
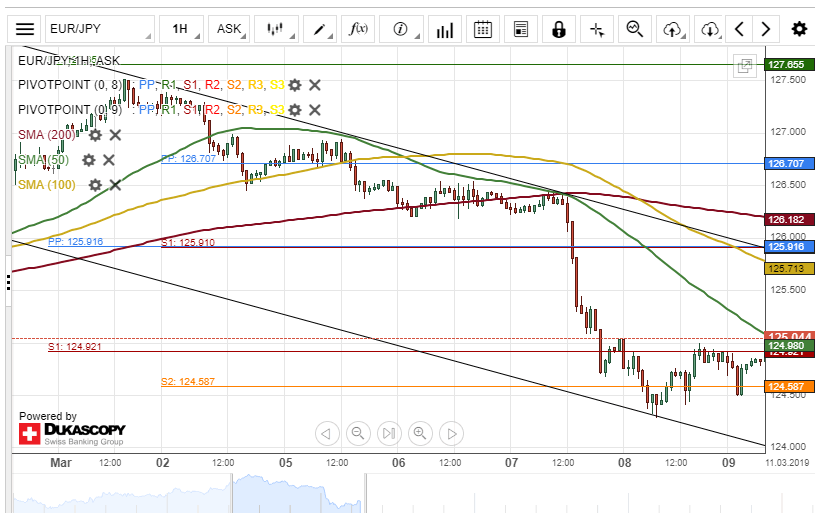
EUR/JPY Surge Insight
The common European currency depreciated about 1.65% in values against the Japanese Yen since March 7. The currency pair tested the lower boundary of a descending channel pattern at 124.30 during Friday's trading session.
The exchange rate breached a resistance level formed by the 50-hour simple moving average at 125.03 during the European trading session on Monday.
By and large, it is likely that the currency exchange rate aims for the upper boundary of the descending channel pattern at 125.91 during the following trading session.
Meanwhile, technical indicators flash sell signal both on the 4(H) and the daily time frames chart.
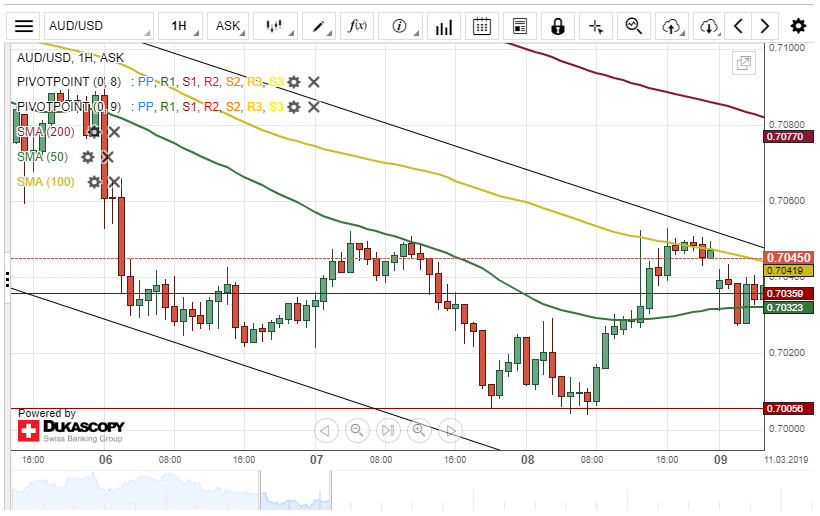
AUD/USD Breakout Occurs
The Australian Dollar appreciated about 50 base points against the US Dollar on Friday. The currency pair tested the 50-hour simple moving average at 0.7042 during Friday's trading session.
A breakout occurred through the upper boundary of a descending channel pattern during the first half of Monday's trading session.
Given that a breakout had occurred, it is likely that the currency exchange rate could aim at a resistance level formed by the 200-hour simple moving average at 0.7078 within this session.
However, technical indicators demonstrate that a decline could be expected during the following trading session.
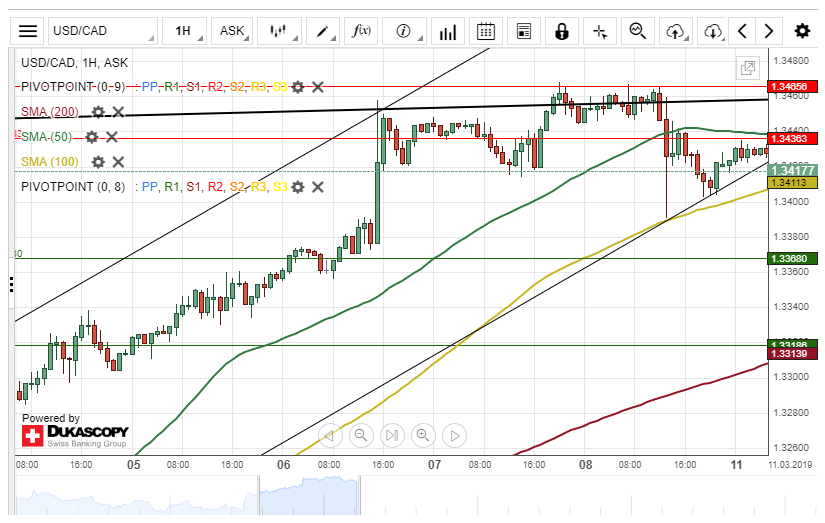
USD/CAD Stranded Between SMAs
The US Dollar depreciated about 71 base points against the Canadian Dollar on Friday. The decline was due to the US macroeconomic data report, which shows that the US labour market added only 20,000 jobs in February.
The currency exchange rate is currently testing a support level formed by the 100-hour simple moving average at 1.3409.
If the USD/CAD pair passes the 100-hour SMA, the next target will be near the 200-hour moving average at 1.3311.
However, if the support level as mentioned earlier holds, a surge towards the 1.3465 area could be expected.
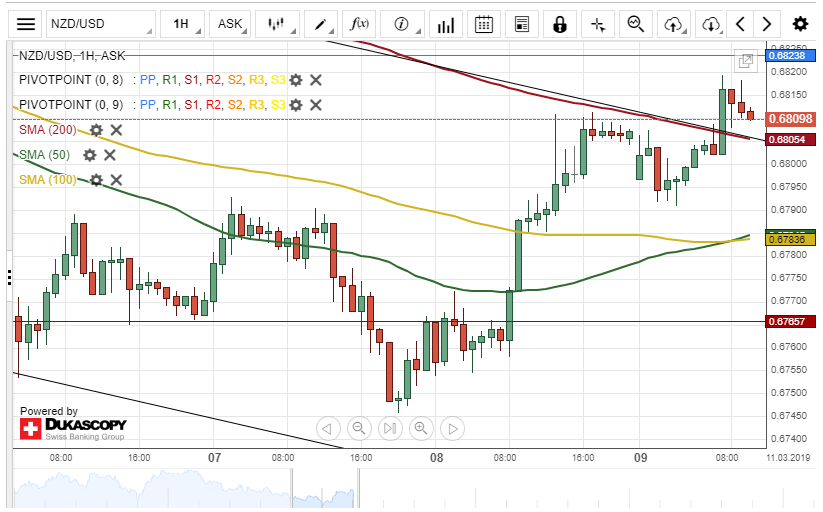
NZD/USD Target At 0.6834
The New Zealand Dollar appreciated about 56 base points against the US Dollar on Friday. The surge was stopped by a resistance level formed by the 200-hour simple moving average at 0.6810.
A breakout occurred through the upper boundary of a descending channel pattern at 0.6806 during the European trading session on Monday.
As for the short-term future, it is likely that the currency exchange rate surge towards a resistance level at 0.6834.
On the other hand, the NZD/USD pair could reverse from the current price level and aim for a support cluster at 0.6783 during the following trading session.
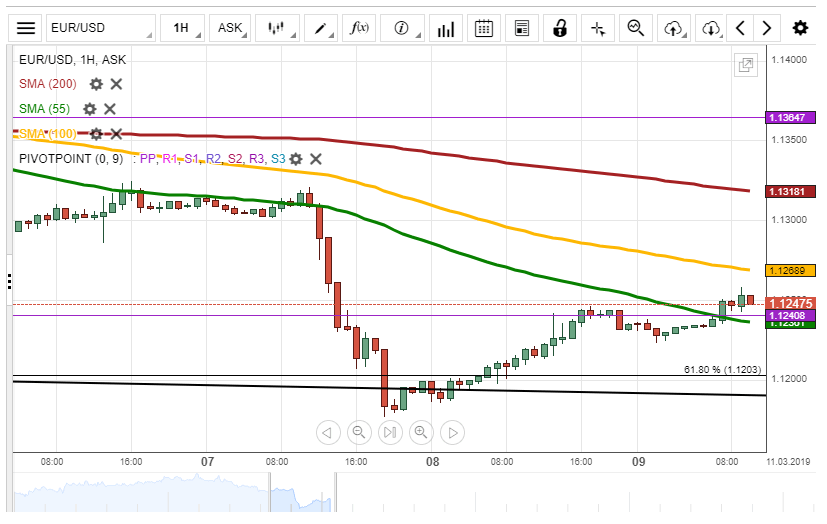
EUR/USD Might Fall To 61.80% Fibo
During Friday's trading session, the European Single Currency broke through the resistance level of the 61.80% Fibo to end the trading session at the 1.1223 mark. On Monday morning, the rate broke the 55-hour simple moving average to trade at the 1.1247 mark.
In regards to the near-term future, it is expected that the 55-hour simple moving average will retrace towards the 61.80 % Fibonacci retracement level at the 1.1203 mark.
On the other hand, today's US Retail Sales and Core Retail Sales data release at 12:30 GMT could push the rate to break the resistance of the 100-hour simple moving average to end the trading day at the 1.1280 level.
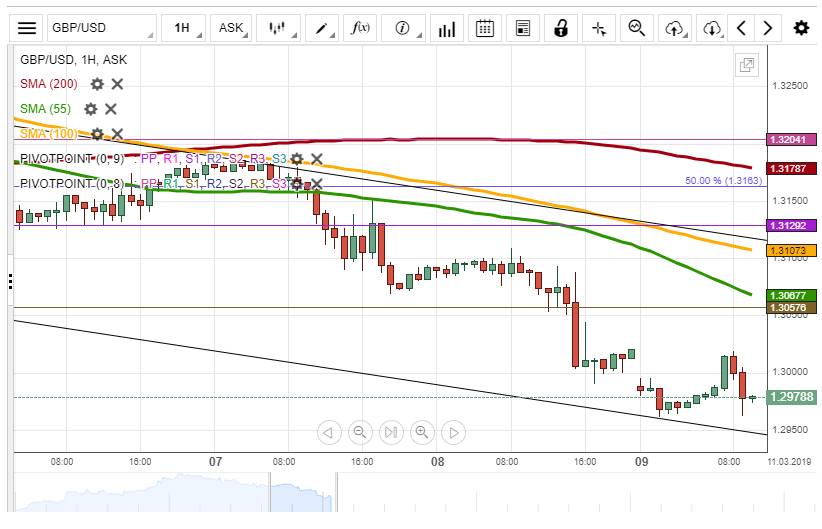
GBP/USD Will Trade At 1.3000 Level
During Friday's trading session, the British Pound depreciated to the 1.2950 level. On Monday morning, the European Single Currency was located at the 1.2999 mark.
In regards to the near term future, most likely, the currency exchange rate will be trading sideways to stay at the 1.3000 level during the day.
On the other hand, the US Dollar might appreciate against the British pound during today's US Retail Sales and Core Retail Sales data release at 12:30 GMT to fall to the monthly S2 at the 1.2905 level.
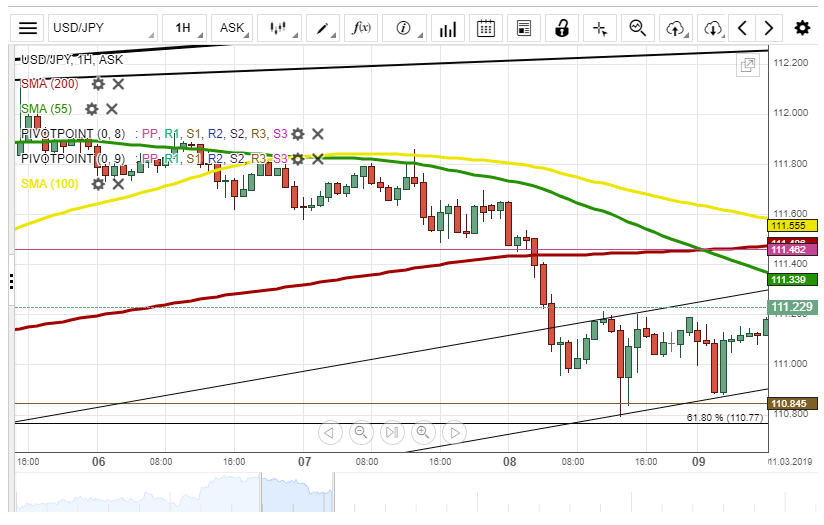
USD/JPY Will Stay At 111.00
During Friday's trading session, the currency exchange rate passed through the support level of the 200-hour simple moving average to fall to 111.00. On Monday morning, the rate was trading at the 111.21 mark. Note, the chart was fully reviewed to make some corrections to the chart!
In regards to the near-term future, it is expected that the 55-hour simple moving average will retrace the rate to push it to trade sideways at the 111.00 level.
However, today's US Retail Sales and Core Retail Sales data release at 12:30 GMT might push the US Dollar to appreciate against the Japanese Yen to trade between the simple moving average at the 111.40 level.
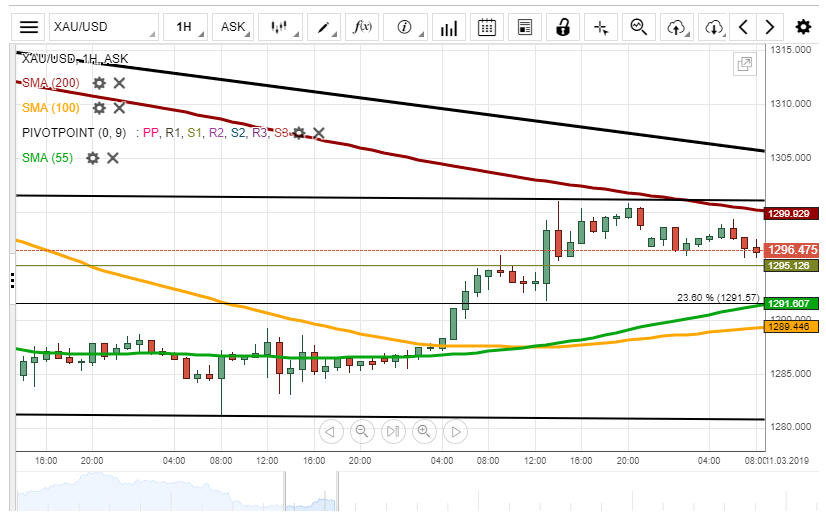
XAU/USD Trades At 1,290.00 Level
During Friday's trading session, the 23.60% Fibonacci retracement level helped the yellow metal to break the resistance of the monthly S1 to end the trading session at the 1,296.81 mark. Note, the chart was fully reviewed to make some corrections to the chart!
In regards to the near-term future, most likely, the 200-hour simple moving average will retrace gold to pass the support level of the monthly S1 at 1,295.12 mark.
On the other hand, today's US Retail Sales and Core Retail Sales data release at 12:30 GMT could push the US Dollar to appreciate against gold to break through the 200-hour SMA to end the trading session at the 1,300.00 level.