

Sample Category Title
Japan Economy Grew More-Than-Anticipated In 4Q 2018
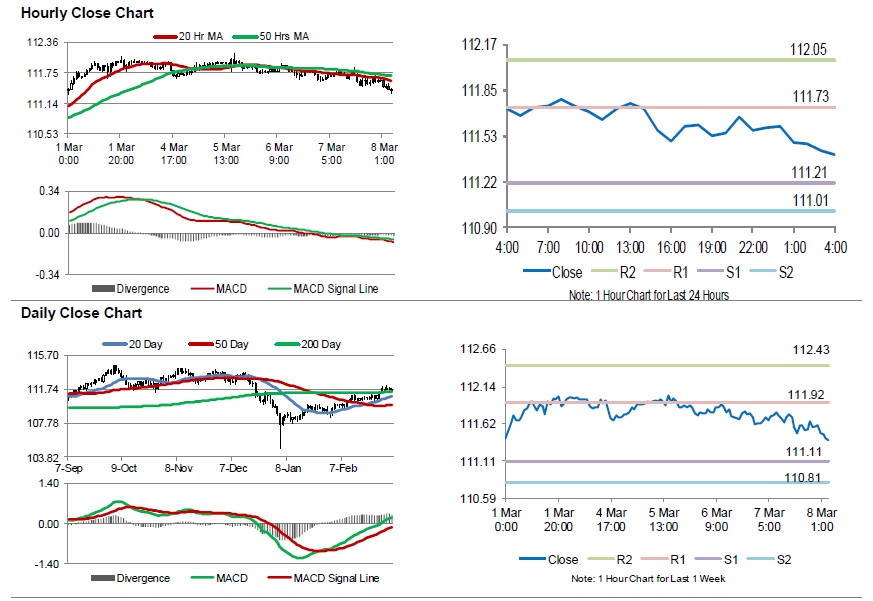
For the 24 hours to 23:00 GMT, the USD declined 0.11% against the JPY and closed at 111.59.
In the Asian session, at GMT0400, the pair is trading at 111.40, with the USD trading 0.17% lower against the JPY from yesterday’s close.
Overnight data revealed that Japan posted a trade deficit (BOP basis) of ¥964.8 billion in January, compared to a surplus of ¥216.20 billion in the previous month. Market participants had anticipated the nation to record a deficit of ¥1133.0 billion. Meanwhile, the nation’s final gross domestic product (GDP) rebounded 0.5% on a quarterly basis in 4Q 2018, following a decline of 0.6% in the prior quarter. Market participants had expected the GDP to record a gain of 0.4%, while preliminary figures had indicated an advance of 0.3%.
The pair is expected to find support at 111.21, and a fall through could take it to the next support level of 111.01. The pair is expected to find its first resistance at 111.73, and a rise through could take it to the next resistance level of 112.05.
Going forward, traders would closely monitor Japan’s the Bank of Japan’s interest rate decision, set to release next week.
The currency pair is trading below its 20 Hr and 50 Hr moving averages.
China trade surplus shrank to $4.1B in Feb, US imports tumbled -35% yoy ytd
China's February trade balance data is rather terrible. Trade surplus shrank sharply to USD 4.1B, well below expectation of USD 27.2B. That's primarily due to steep contraction in exports by -20.7% yoy, largest decline since February 2016. The data could be distorted by the timing of the New Year. But January and February combined, exports still dropped -4.6% yoy while imports dropped -3.1% yoy.
Looking at some January and February combined details, trade with the US continued to deteriorate drastically . Total trade with US dropped -19.9% yoy, exports dropped -14.1% yoy but imports dropped -35.1% yoy. Trade with EU wasn't too bad, still recorded 3.7% yoy growth in total trade, 2.4% yoy rise in exports and 5.7% rise in imports. One interesting point to note is that imports from Brazil jumped 33.5% yoy while imports from Canada rose 34.9% yoy.
Here are some details.
In USD terms, in Feb:
- Total trade dropped -13.8% yoy to USD 266.3B
- Expects dropped -20.7% yoy to USD 135.2B
- Imports dropped -5.2% yoy to USD 131.1B
- Trade surplus was at USD 4.1B
In USD terms, YTD:
- Total trade dropped -3.9% yoy to USD 662.7B.
- Exports dropped -4.6% yoy to USD 353.2B
- Imports dropped -3.1% yoy to USD 309.5B
- Trade surplus was at USD 43.7B
With US, YTD:
- Total trade dropped -19.9% yoy to USD 76.5B
- Exports dropped -14.1% yoy to USD 59.3B.
- Imports dropped -35.1% yoy to USD 17.2B.
- Trade surplus was at USD 42.1B
With EU, YTD:
- Total trade rose 3.7% yoy to USD 107.5B
- Exports rose 2.4% yoy to USD 64.7B
- Imports rose 5.8% yoy to USD 42.8B.
- Trade surplus was at USD 21.9B.
With AU,YTD:
- Total trade rose 4.6% yoy to USD 24.8B.
- Exports rose 3.3% yoy to USD 7.0B.
- Imports rose 5.1% yoy to USD 17.8B.
- Trade deficit was at USD 10.8B.
Switzerland’s Unemployment Rate Remained Steady In February
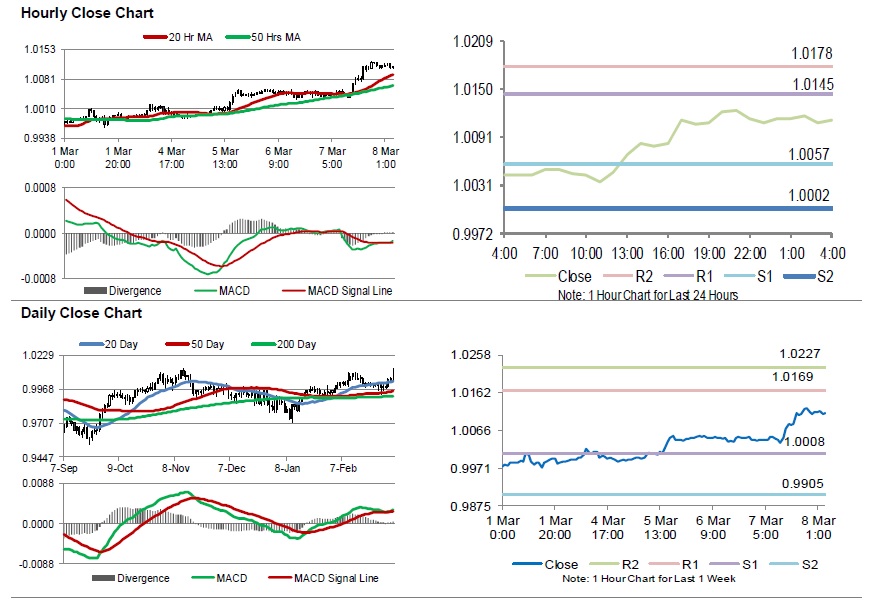
For the 24 hours to 23:00 GMT, the USD rose 0.58% against the CHF and closed at 1.0109.
In economic news, Switzerland's seasonally adjusted unemployment rate remained unchanged at a rate of 2.4% in February, in line with market expectations.
In the Asian session, at GMT0400, the pair is trading at 1.0111, with the USD trading marginally higher against the CHF from yesterday's close.
The pair is expected to find support at 1.0057, and a fall through could take it to the next support level of 1.0002. The pair is expected to find its first resistance at 1.0145, and a rise through could take it to the next resistance level of 1.0178.
With no macroeconomic releases in Switzerland today, investors would look forward to global macroeconomic releases for further directions.
The currency pair is trading above its 20 Hr and 50 Hr moving averages.
Canada’s Building Permits Declined Beyond Expectations In January
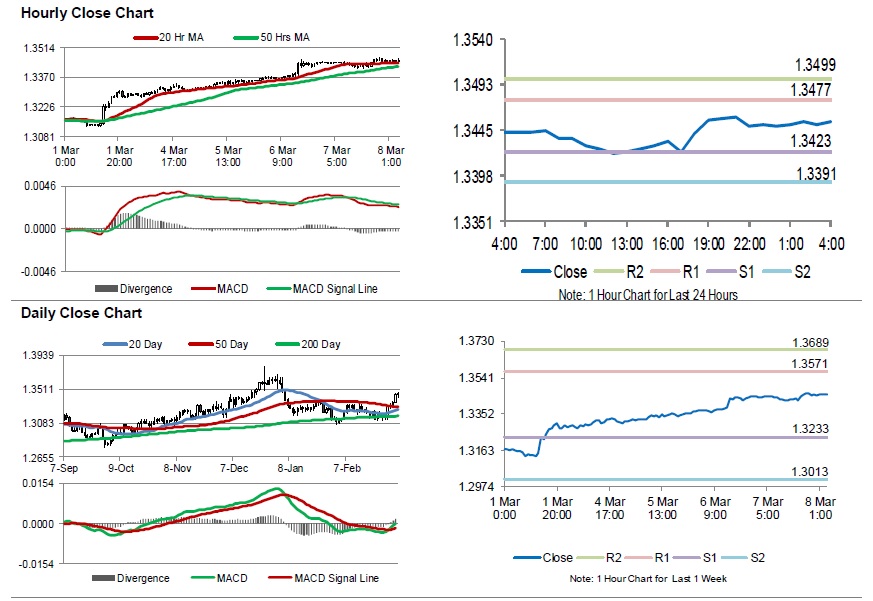
For the 24 hours to 23:00 GMT, the USD rose 0.07% against the CAD and closed at 1.3452.
Data revealed that Canada's building permits slid 5.5% on a monthly basis in January, more than market anticipations for a drop of 5.0%. In the prior month, building permits had recorded a revised gain of 6.4%.
In the Asian session, at GMT0400, the pair is trading at 1.3454, with the USD trading slightly higher against the CAD from yesterday's close.
The pair is expected to find support at 1.3423, and a fall through could take it to the next support level of 1.3391. The pair is expected to find its first resistance at 1.3477, and a rise through could take it to the next resistance level of 1.3499.
Trading trend in the Loonie today, is expected to be determined by Canada's housing starts and unemployment rate for February, scheduled to release later in the day.
The currency pair is trading above its 20 Hr and 50 Hr moving averages.
Aussie Extends Its Losses In The Asian Session
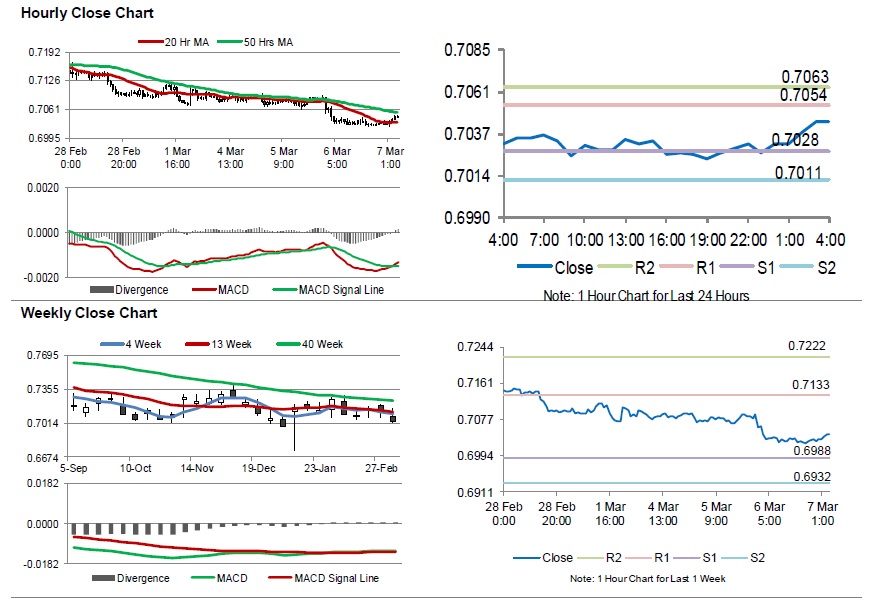
For the 24 hours to 23:00 GMT, the AUD declined 0.13% against the USD and closed at 0.7018.
LME Copper prices declined 0.7% or $47.0/MT to $6458.0/MT. Aluminium prices declined 0.3% or $5.0/MT to $1841.0/MT.
In the Asian session, at GMT0400, the pair is trading at 0.7012, with the AUD trading 0.09% lower against the USD from yesterday’s close.
Elsewhere, in China, Australia’s largest trading partner, trade surplus narrowed more than expected to $4.1 billion in February, compared to a level of $39.2 billion in the previous month.
The pair is expected to find support at 0.6994, and a fall through could take it to the next support level of 0.6976. The pair is expected to find its first resistance at 0.7041, and a rise through could take it to the next resistance level of 0.7070.
Amid lack of economic releases in Australia today, traders would focus on global macroeconomic events for further direction.
The currency pair is showing convergence with its 20 Hr and 50 Hr moving averages.
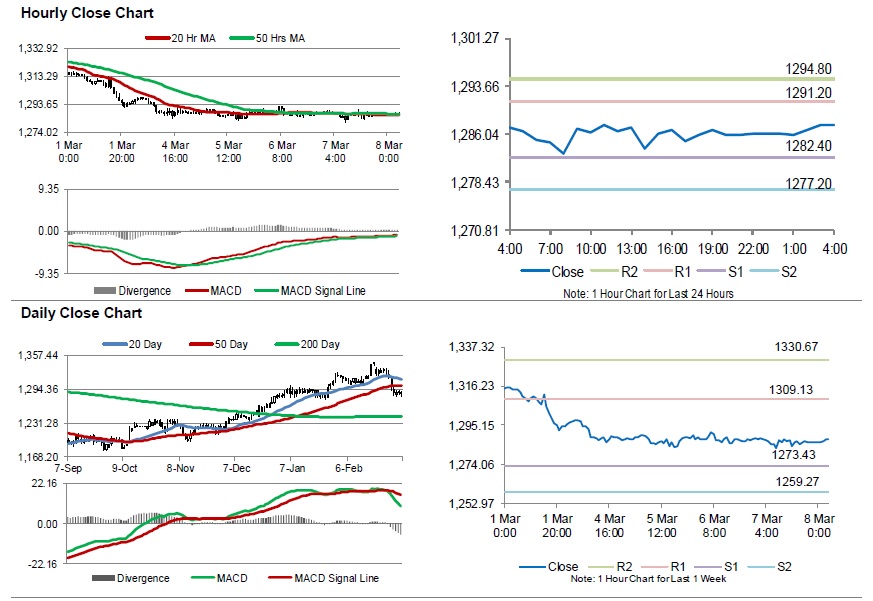
Gold: Yellow Metal Trading Higher In The Asian Session
For the 24 hours to 23:00 GMT, Gold declined 0.12% against the USD and closed at USD1286.10 per ounce, amid strength in the US dollar.
In the Asian session, at GMT0400, the pair is trading at 1287.60, with gold trading 0.12% higher against the USD from yesterday’s close.
The pair is expected to find support at 1282.40, and a fall through could take it to the next support level of 1277.20. The pair is expected to find its first resistance at 1291.20, and a rise through could take it to the next resistance level of 1294.80.
The yellow metal is showing convergence with its 20 Hr and 50 Hr moving averages.
Silver: White Metal Reverses Its Losses In The Morning Session
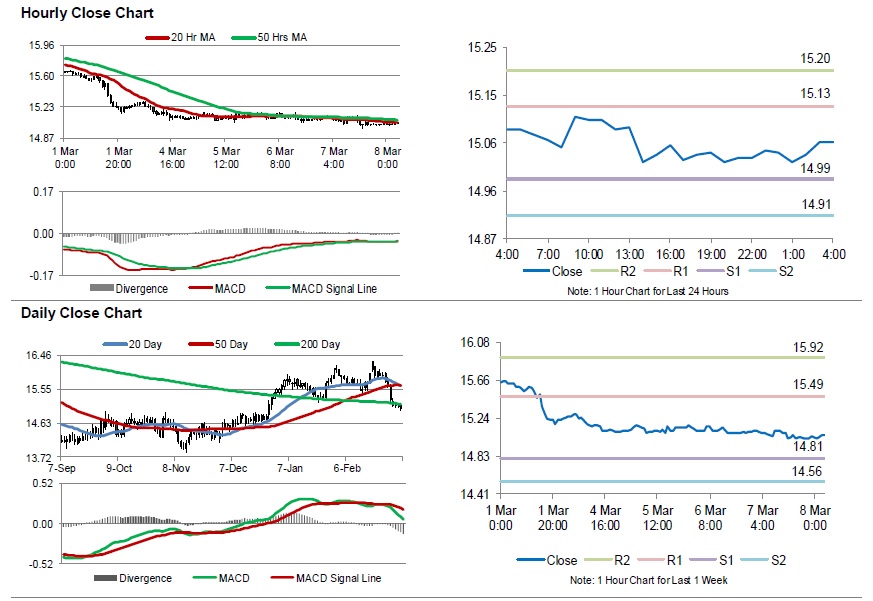
For the 24 hours to 23:00 GMT, Silver declined 0.33% against the USD and closed at USD15.05 per ounce, tracking losses in gold prices.
In the Asian session, at GMT0400, the pair is trading at 15.06, with silver trading 0.10% higher against the USD from yesterday’s close.
The pair is expected to find support at 14.99, and a fall through could take it to the next support level of 14.91. The pair is expected to find its first resistance at 15.13, and a rise through could take it to the next resistance level of 15.20.
The white metal is showing convergence with its 20 Hr and 50 Hr moving averages.
Crude Oil: Oil Trading Lower, Ahead Of Baker Hughes Weekly Rig Count Data
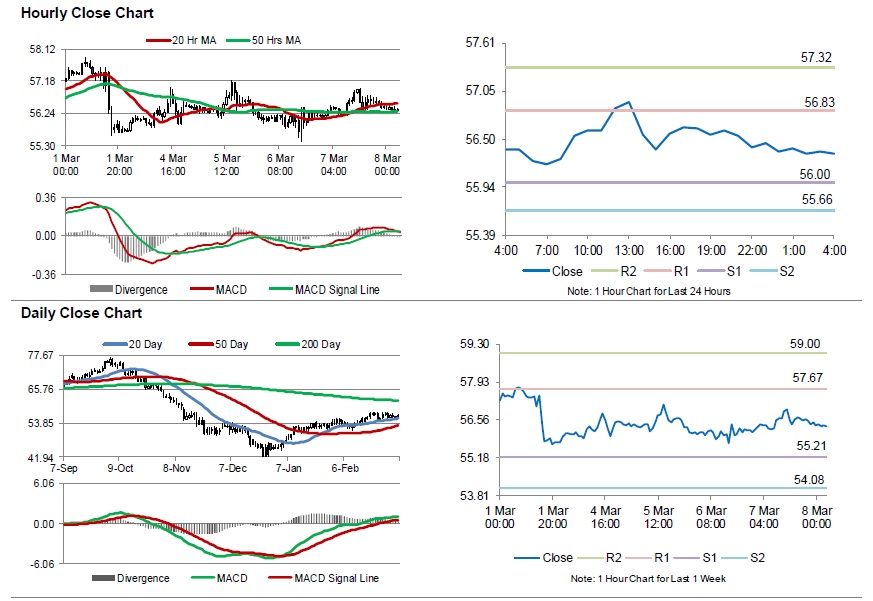
For the 24 hours to 23:00 GMT, Crude Oil rose 0.48% against the USD and closed at USD56.45 per barrel, after OPEC’s output declined by 60,000 barrels a day to 30.8 million barrels a day, marking its four-year low level in February.
In the Asian session, at GMT0400, the pair is trading at 56.33, with oil trading 0.21% lower against the USD from yesterday’s close.
The pair is expected to find support at 55.99, and a fall through could take it to the next support level of 55.66. The pair is expected to find its first resistance at 56.83, and a rise through could take it to the next resistance level of 57.32.
Crude oil is trading below its 20 Hr moving average and showing convergence its 50 Hr moving average.
Elliott Wave View: EURUSD Breaks Down After ECB Meeting, What’s Next?
In today's meeting, the ECB (European Central Bank) has downgraded their economic growth and inflation forecast. In addition, it has announced a fresh stimulus in the form of TLTRO (Targeted Longer-Term Refinancing Operations). This is basically a long term loan given to banks to increase loan creation. If the banks can lend above a specified benchmark, then they will be able to borrow from ECB at a negative rate. This will provide incentive for the banks to lend and thus increase private spending in the economy.
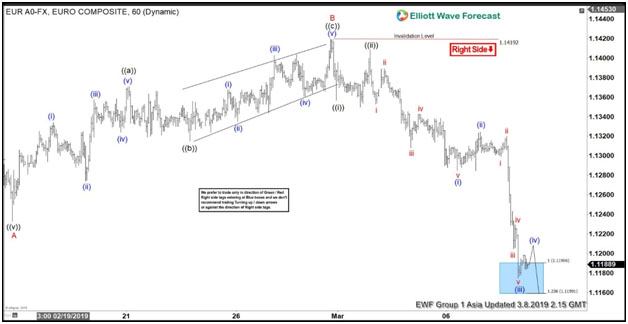
EURUSD fell 120 pips as a response and broke below the previous low on 11/12/2018 at 1.1216. This has created a bearish sequence in the pair and favors further downside. The decline from 2/28/2019 high (1.1419) is unfolding as an impulse Elliott Wave structure where wave ((i)) ended at 1.1357 and wave ((ii)) ended at 1.1408. Wave ((iii)) remains in progress and also subdivides as an impulse of lesser degree. Wave (i) of ((iii)) ended at 1.1296, wave (ii) of ((iii)) ended at 1.1324, and wave (iii) of ((iii)) ended at 1.1175. Near term, while bounce stays below 1.1419, expect pair to extend lower. We don't like buying the pair and prefer further downside while rally fails in 3, 7, or 11 swing below 1.1419.
1 Hour EURUSD Elliott Wave Chart
Gold Price Turned Bearish, Crude Oil Price Could Breakdown
Gold price declined heavily and broke the $1,300 support level to move into a bearish zone. Crude oil price might decline sharply if there is a downside break below the $56.25 support level.
Important Takeaways for Gold and Oil
Gold price declined sharply after topping near the $1,330 resistance against the US Dollar.
There is a short term bearish trend line formed with resistance at $1,288 on the hourly chart of gold.
Crude oil price is forming a contracting triangle with support near the $56.25 level on the hourly chart of XTI/USD.
There could be a sharp decline if the price trades below the $56.25 and $56.00 support levels.
Gold Price Technical Analysis
After a strong upward move, gold price faced a strong resistance near the $1,330 level against the US Dollar. The price started a fresh bearish wave and declined below the $1,320 and $1,310 support levels.
The decline was strong since the price even broke the $1,300 support level. Finally, there was a close below the $1,300 support and the 50 hourly simple moving average. The price moved below the $1,290 support and a low was formed near the $1,280 level on FXOpen.
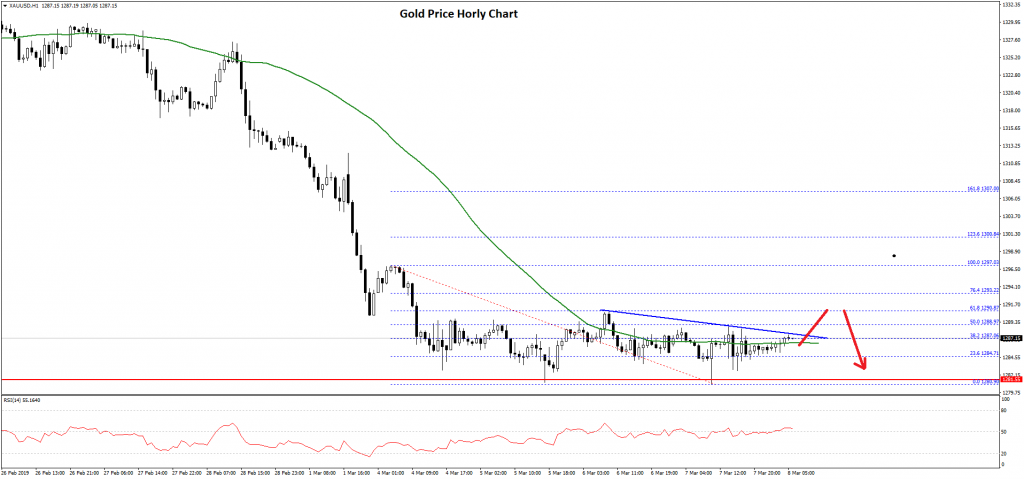
Later, the price started consolidating gains and corrected above the $1,285 level and the 23.6% Fib retracement level of the recent decline from the $1,297 high to $1,280 low.
However, the price is facing a strong resistance near the $1,288 level. There is also a short term bearish trend line formed with resistance at $1,288 on the hourly chart of gold. The 50% Fib retracement level of the recent decline from the $1,297 high to $1,280 low is also near the $1,288 level.
If there is a break above the $1,288 and $1,290 levels, the price could recover towards the $1,297 level or the $1,300 resistance.
On the downside, the $1,280 support level is an important barrier for sellers. If they succeed in clearing $1,280, there is a risk of a downside break below the $1,275 level.
Oil Price Technical Analysis
Crude oil price rallied recently and broke the $56.50 and $57.00 resistance levels against the US Dollar. The price even broke the $57.80 resistance and traded towards the $58.00 level before starting a downside correction.
There were a couple of swing moves before the price broke the $56.50 and $56.20 support levels. A low was formed at $55.70 and later the price recovered to $57.23.
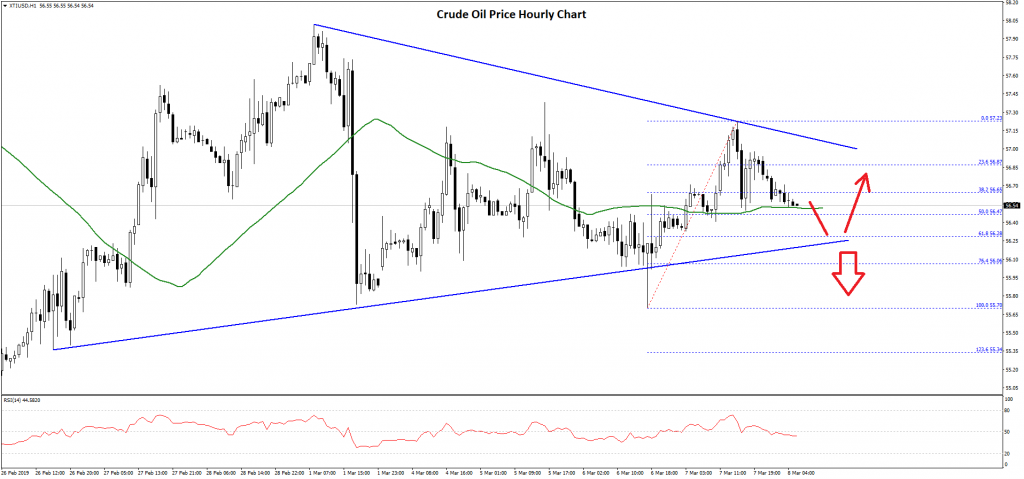
At the moment, the price is moving lower and it recently broke the $56.80 support. An immediate support is near the $56.50 level, the 50 hourly simple moving average, and the 50% Fib retracement level of the recent wave from the $55.70 low to $57.23 high.
More importantly, there is a contracting triangle formed with support near the $56.25 level on the hourly chart of XTI/USD. The triangle support is close to the 61.8% Fib retracement level of the recent wave from the $55.70 low to $57.23 high.
If there is a break below the triangle support and $56.20, the price could decline sharply in the near term. The next key support is at $56.00, below which the price may revisit the $55.75 support. On the upside, the main resistances are near $57.00 and $57.50.