Sample Category Title
US update: Market panic on ECB’s dovish turn. Euro, stocks and yields dive
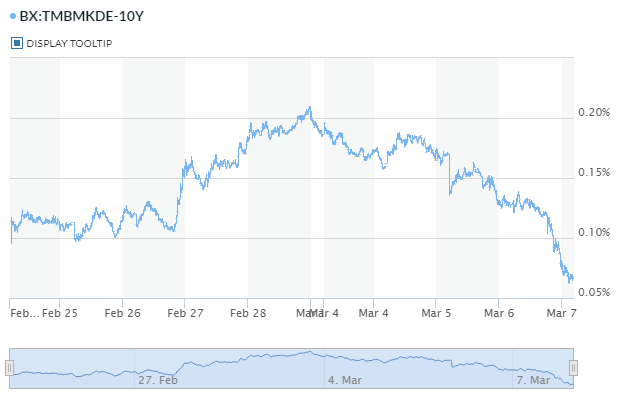
The global financial markets seem to have taken ECB's dovish turn rather negatively. Instead of cheering prolonged low interest rate environment and cheap loans, investors take the warning that the worst is yet to come. At the time of writing, DOWN is down nearly -200 pts while Europe indices all closed in red. Bond yields suffered steep decline as German 10-year yield hit as low as 0.063 so far, lowest since at least the start of 2017. And, it hit as high as 0.210 just on March 1.
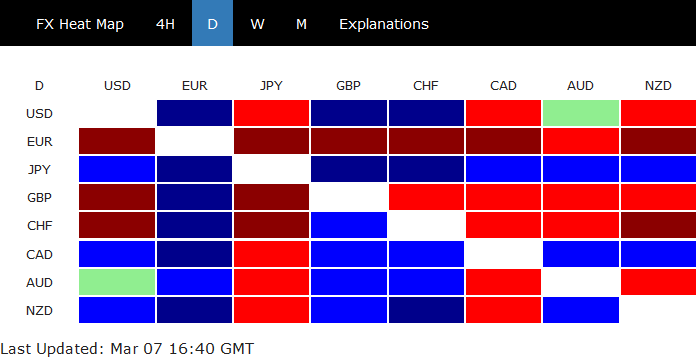
In the currency markets, Euro is no doubt the biggest loser. EUR/USD's break of 1.1215 support now indicates resumption of medium term down trend from 1.2555. The common currency also drags down Sterling and Swiss Franc. Meanwhile, Yen is the strongest one, with help from risk aversion as well as falling global yields. Canadian is surprisingly the second strongest for today. But the Loonie is just paring some of yesterday's steep loss.
In the US:
- DOW is down -0.81%.
- S&P 500 is down -0.55%.
- NASDAQ is down -0.53%.
- 10-year yield is down -0.038 at 2.654. It kissed 2.7 handle goodbye earlier this week.
- 30-year yield is down -0.031 at 3.040, still holding on to 3.0 handle.
In Europe:
- FTSE closed down -0.53%.
- DAX closed down -0.60%.
- CAC closed own -0.39%.
- German 10-year yield is down -0.0615 at 0.067.
EURCAD Bulls Give Up Rally at the Upper Bollinger Band; Golden Cross Eyed
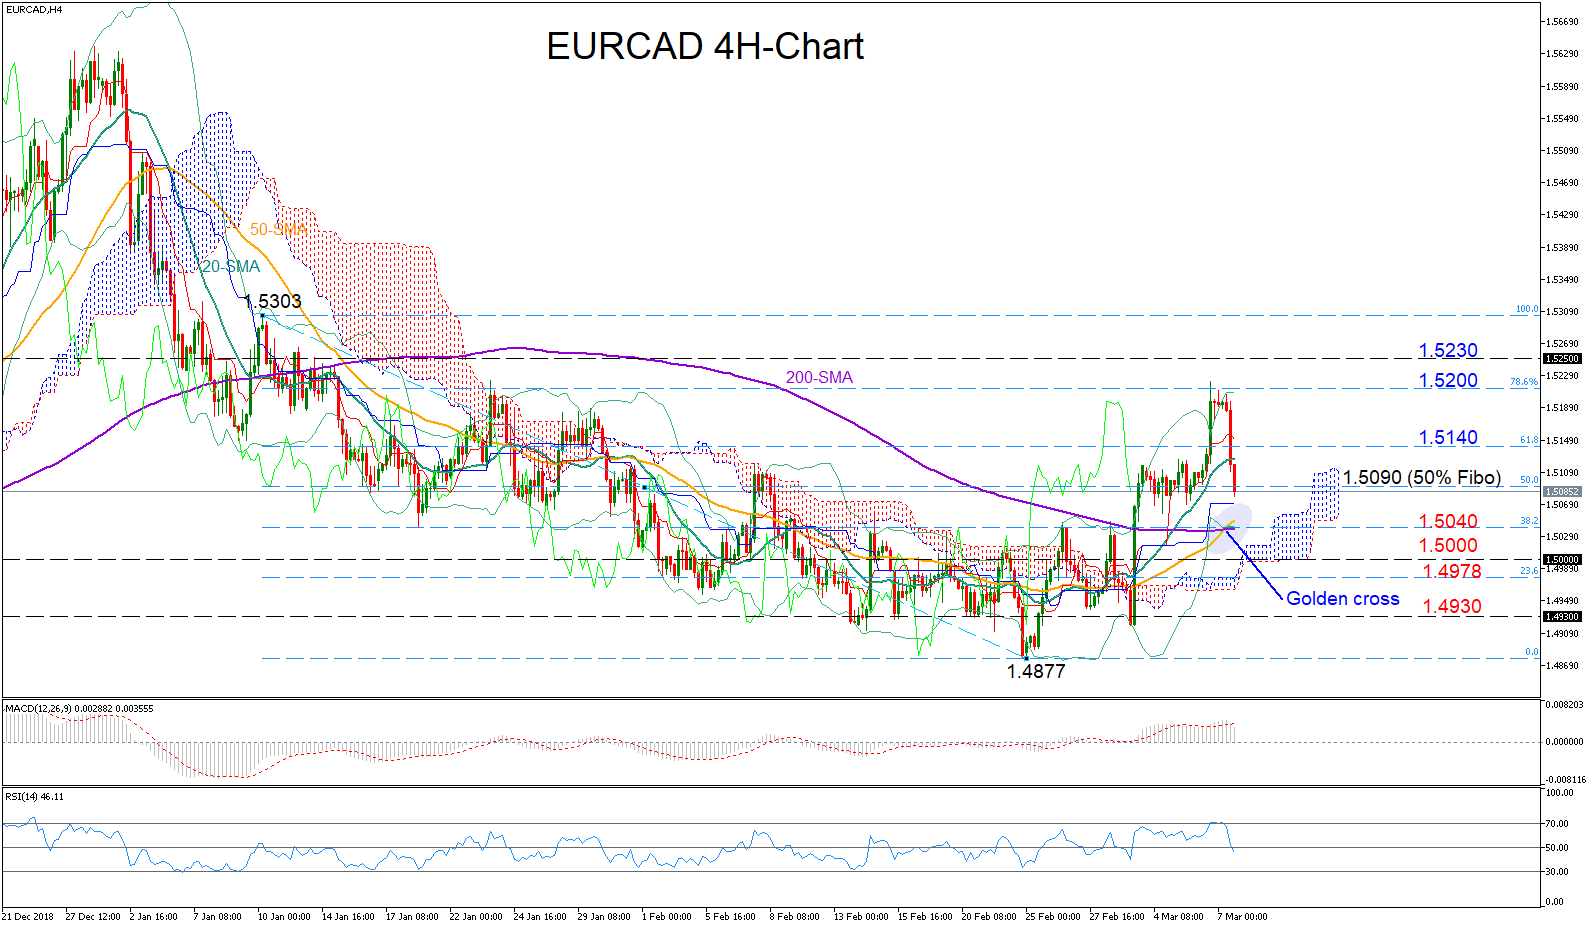
EURCAD is going downhill in the 4-hour chart, retracing all the gains it collected on Wednesday after piercing the upper Bollinger band.
The MACD has slipped below its red signal line and the RSI dipped below its 50 neutral mark, both endorsing the negative mood in the market. The golden cross between the 50- and the 200-period moving averages (MA) on the 4-hour chart though, which is the first registered since November’s rally is trend-positive, flagging that today’s sell-off could be temporary and that the recent uptrend is likely to extend further. Yet a larger distance between the lines could be more convincing.
The 38.2% Fibonacci of 1.5040 of the downleg from 1.53 to 1.4877, which is located at the crossroads of the 50- and the 200-period MAs could provide nearby support if the downfall picks up steam. A leg below that key barrier could open the door for the1.50 psychological mark, while further deterioration could also retest the congested area around the 23.6% Fibonacci of 1.4978. If the latter proves a weak obstacle, then bearish pressure could continue until 1.4930.
On the flip side, a failure to close below the 50% Fibonacci of 1.5090 could push the price back into the 1.51 area where immediate resistance could be found between 1.5124 and the 61.8% Fibonacci of 1.5140. Moving higher, the bulls could make another attempt to beat the 1.5200 round level. If they appear successful this time, EURCAD could then revisit the 1.5250-1.5300 zone.
Japanese Yen Subdued, GDP Next
It continues to be a quiet week for USD/JPY. In Thursday’s North American session, the pair is trading at 111.57, down 0.17% on the day. On the release front, U.S. employment claims dipped to 223 thousand, below the estimate of 225 thousand. Investors will be keeping an eye on Japanese numbers. Household spending is expected to decline by 0.1% and GDP is forecast to expand by 0.4%. On Friday, the focus will be on employment numbers, as the U.S. releases wage growth and nonfarm payrolls.
After four rate hikes from the Federal Reserve in 2018, the central bank has starkly changed directions, with no rate hikes so far in 2019. The Federal Reserve has been in dovish mode since December, and this stance was reinforced by Jerome Powell in testimony before Congress. On Tuesday, Boston Fed President Eric Rosengren, who is a considered a hawk on monetary policy, said that there was some downside risk to the U.S. economy and called on policymakers to be “patient” for several more meetings in order to evaluate the risks to the economy. Without being explicit, Rosengren appears to support the Fed remaining on the sideline for the upcoming policy meetings until the Fed can better gauge the health of the U.S. economy.
Is a breakthrough imminent in the bitter U.S-China trade row? The conflict has weighed on the global economy and caused significant volatility in the equity markets, with nervous investors snapping the safe-haven yen. Now that trade tensions have eased between the two super-economies, investor risk appetite has improved. If progress continues and the sides ink an agreement, the yen will be less attractive as investors feel more comfortable with riskier assets.
Non-Farm Payrolls
The big macroeconomic event for the week is coming up with the release of February US Non-Farm Payrolls (NFP) at 08:30 EST (or 14:30 CET).
The release comes with a host of other data besides employment figures and has a habit of producing a lot of volatility in the markets. Here are some things to keep in mind ahead of this important event.
Non-Farm Payrolls
As the name suggests, this is the headline number that gets the most attention. It’s the total number of jobs created in the US economy in February, excluding not just farming jobs (left out due to the seasonal nature of farming), but also government and non-profit jobs. One can consider the NFP as the preeminent measure of how the economy is doing.
When analyzing this data and its potential impact on the market, there are two factors to bear in mind. The first is the effect of employment. If employers are hiring more people, it means they expect to continue needing to keep making more products. That is a sign of a strong economy with a healthy outlook among businesses. And, this is largely supportive of the dollar.
The second factor is that as employment increases, you have more money in circulation. This should eventually lead to inflationary pressure, which is typically negative for the value of the dollar. But, if inflation increases a lot along with a growing economy, this means that the Fed is more likely to intervene. They do this to keep things from getting out of hand by raising rates, which is, in turn, strengthening for the dollar.
It’s not just the primary number that moves the markets, but at the same time we get revisions to the results from prior months, and they can also move the markets. This is especially true when the headline is in line with expectations.
Expectations
During last month’s release, the number came in at 304K, almost doubling expectations of just 165K. However, the prior month underwent a revision of nearly 90K, significantly reducing the positive effect. A number over 300K is typically seen as unusually good. These big outlying results will usually get revised lower a month later, which might be the case this time around.
A consensus has formed that a “normal” NFP number is one that comes in between 180-200K. A result significantly above that is usually “very good” and can pull the dollar up. We can consider anything below that number as more “negative,” and it will pull down the dollar accordingly.
For the upcoming February release, the consensus is for there to have been 185K jobs added during the month. This is a drop from that blowout 304K seen last month.
For a while, we could consider the ADP number as predictive of the NFP result, but it’s lost a bit of its reputation lately. In any case, on Wednesday, ADP said 183K jobs were added compared to the 189K expected. However, we should note that their prior month was revised higher to be in line with the NFP number.
Average Hourly Earnings
The other significant number coming out at the same time shows how much private non-farm workers earn. It’s a metric the Fed follows as a guide for future inflation and labor market tightness.
Expectations are for hourly wages have increased by 0.5% in the last month. This would be an increase in the pace over the 0.1% registered the prior month, and would bring annualized wage inflation to 3.3%. Note that this is well above the Fed’s inflation target.
Unemployment Rate
Usually, the actual rate isn’t as crucial to the markets as it is to politicians and the media. Nevertheless, it can still move the market, often depending on the underlying data components.
The consensus is for the unemployment rate to drop back to 3.8% from the 4.0% last month. This is mostly due to a reduction in labor force participation (since that was the driver in the increase in the unemployment rate last time).
The market can also react to underlying data seen in the components since they can help explain discrepancies in the headline numbers. They also give insight into certain sectors of the economy.
Construction, for example, continues to be in focus with the drop in mortgage rates. This showed an increase in hiring to 52K last month from the 38K of the prior two months. Both leisure and hospitality also increased, but that’s typical of December thanks to the holidays. The Trump administration’s preferred bit of news was that manufacturing jobs continued to grow last month, adding 13K.
The Market Moves
It usually takes the markets a few minutes to digest so much data, which is further exaggerated this time around with the concurrent release of housing data (which we talked about on Tuesday). After a few minutes of volatility, the market typically settles into its new pattern.
MARKET WRAP: Draghi Pushed The Markets Lower With His Dovish Statement
Mario Draghi delivered another surprising statement today. Clearly, the bank is trying to stay ahead of the curve and delivered a dovish statement. The bank lowered its growth and inflation forecast and introduced TLTROs as we suggested in the morning. This pushed the Euro-dollar lower.
Stocks
- The S&P 500 Index fell 0.4 percent as of 15:30 London time ahead of the US NFP data which is due tomorrow.
- The Stoxx Europe 600 Index fell 0.5 percent after the ECB’s president showed his dovish side.
- The U.K.’s FTSE 100 Index dropped 0.3 percent; investors are widely focused on Brexit.
- The MSCI Emerging Market Index failed to show any upticks and dropped 0.6 percent by following other markets.
Currencies
- The Dollar Spot Index still maintaining its strength and jumped 0.3 percent, the strongest level in 10 weeks.
- The Euro plunged 0.6 percent to $1.1241, hitting the lowest point since November.
- The British pound also fell 0.4 percent to $1.3116, continuing its sixth back to back decline.
- The Japanese yen didn’t show any exciting moves and remained unchanged at 111.72 per dollar.
Bonds
- The yield on 10-year Treasuries dropped three basis points to 2.66 percent.
- Germany’s 10-year yield fell four basis points to 0.09 percent, touching the weakest level in almost four weeks.
- Britain’s 10-year yield maintained its downward move and dropped four basis points to 1.18 percent.
Commodities
- West Texas Intermediate crude soared 0.32 percent to $56.43 a barrel.
- Gold is still below the critical level of 1300 and dropped further 0.2 percent to $1,284.16 an ounce, the lowest point in six weeks.
Sunset Market Commentary
Markets
This morning, core European and US bonds maintained recent gains as markets awaited the ECB policy decision. A modest risk off sentiment also supported safe haven bonds. The ECB as expected left its policy rates unchanged. At the same time, the ECB announced a new TLTRO financing program. Probably even more important for (interest rate) markets: ECB changed its forward guidance on interest rates. The ECB now indicates that it expects interest rates to remain at current low levels throughout the end of the year. Until now the ECB had only engaged to keep rates at these levels throughout the summer. In its staff projections the ECB also downwardly revised the growth and inflation forecasts, in particular for this year. At first, the reaction of European interest rates remained modest, but the decline in yields accelerated during the ECB press conference as the ECB president maintained an overall soft tone, including seeing downside risks to the economy. The EMU economy needs more support for longer. German yields are declining between 1.2 bp (30-year) and 3.8 bp (5-y). 10-y intra-EMU spreads over Germany narrowed today, but the moves are modest, with Italy slightly outperforming (-4bp). There were also spill-over effects from the decline in European yields on US bond markets. US yields are declining between -2 bp (30-yr) and 3.6 bp (5-yr). European equities and US equity futures reversed most of the intraday losses after the ECB policy decision, but there are no meaningful gains.
The ECB policy decision evidently was also the key driver for EUR./USD trading today. EUR/USD hovered in a tight range close to, mostly slightly above the 1.13 barrier going into the ECB policy decision. The ECB announcing a new LTLRO, program, the extension of the period of very low interest rates and the soft tone from ECB’s Draghj at the press conference all pushed EUR/USD below the 1.13 area. EUR/USD is currently trading in the mid 1.12 area. So the 1.12 range bottom of the MT term consolidation pattern is again coming on the radar. 1.1216 marks the November low. 1.1187 is 62% retracement of the 2017 low/2018 peak. Also interesting, the easy policy stance of the ECB had only very limited impact on USD/JPY. The pair is trading in well-known territory in the 111.70 area.
The set-up for sterling trading today was quite similar to yesterday. This morning, Halifax house prices showed a surprise jump of 5.9% M/M and 2.9% Y/Y. However, the impact on sterling trading of this housing market resilience was again very limited. Headlines/rumours from the EU-UK negotiations to reach a compromise on the Irish backstop suggested that no progress has been made yet. EUR/GBP trended higher EUR/GBP temporary revisited the 0.8620 area, but the pair was hammered back below the 0.86 handle after the ECB policy decision. Cable was dragged lower both by uncertainty on the outcome of the Brexit negotiations and by spill-over effects from the EUR/USD decline.
News Headlines
In its staff projections, the ECB downwardly revised the growth outlook for 2019 to 1.1% (from 1.7% in December) and for 2020 (1.6% from 1.7%). The outlook for 2021 was left unchanged (1.5%). At the same time, the ECB cut the inflation forecast for the entire policy horizon to 1.2% in 2019 (from 1.6%), to 1.5% in 2020 (from 1.7%) and 1.6% in 2021 (from 1.8). So, inflation is expected to remain below the ECB policy target by the end of the EBC policy horizon.
US jobless claims in the week ending March 2 were little changed at 223 000 (from 226 000 in the previous week), suggesting ongoing healthy and stable labour market conditions. US nonfarm productivity and unit labour costs in Q4 both exceeded expectations respectively at 1.9% (1.5% expected) and 2.0% (1.7% expected).
USDCHF Advances With Strong Momentum in Short-Term
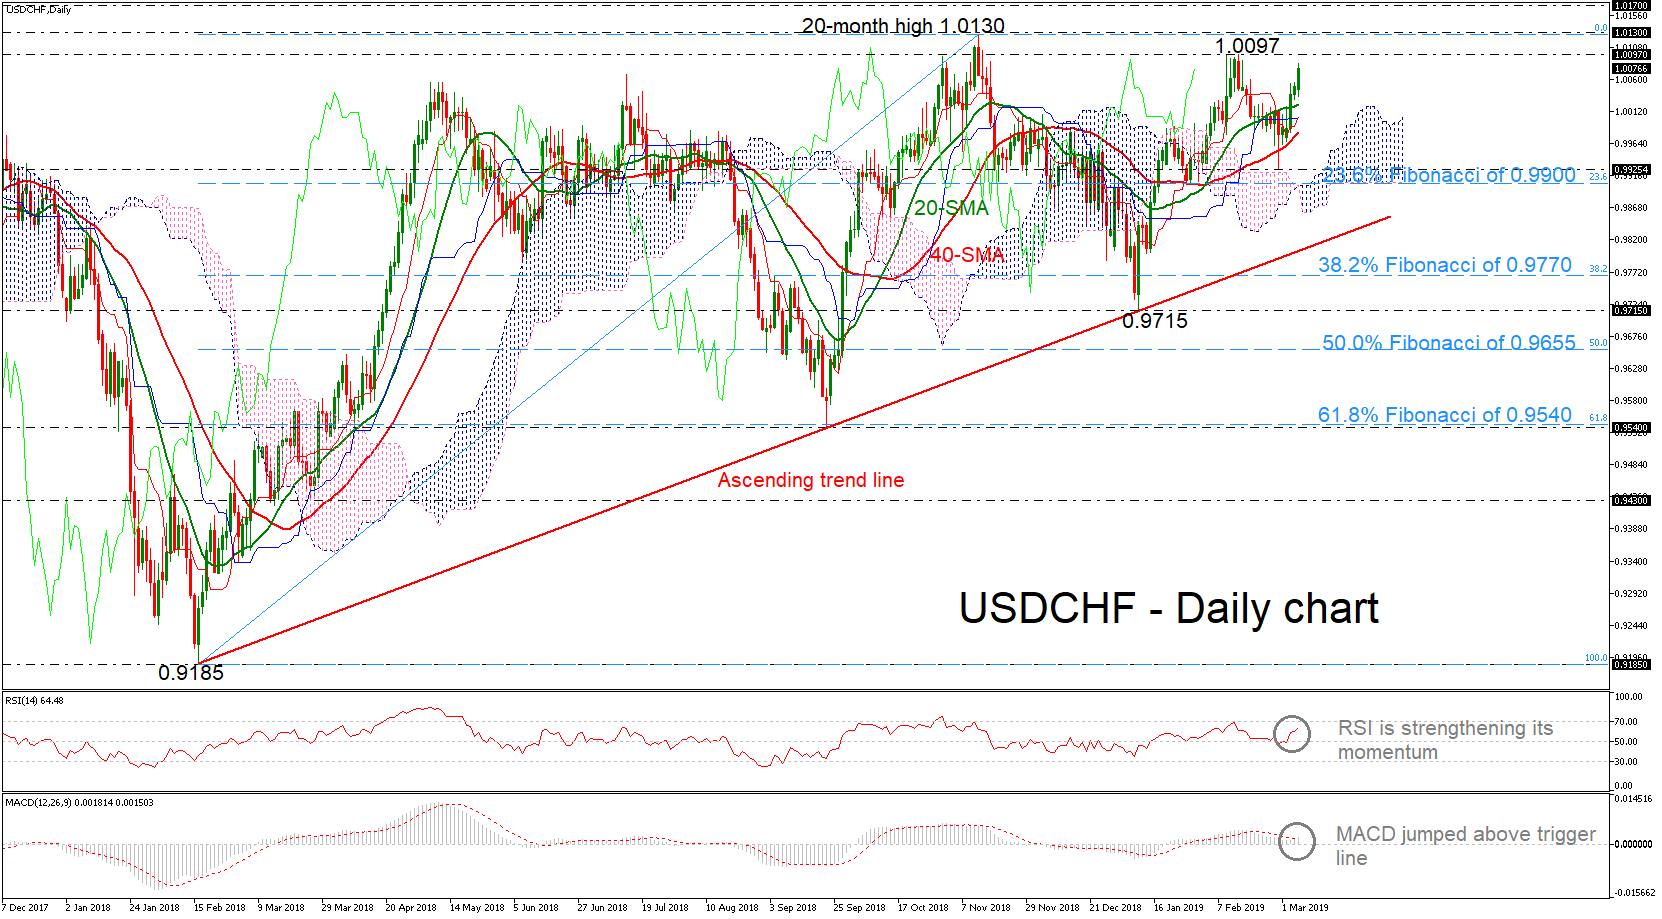
USDCHF has come under renewed buying interest over the last four days and today is still increasing its positive momentum. Technically, the red Tenkan-sen line is pointing upwards, indicating a bullish move, while the RSI is aggressively moving towards the overbought zone. However, the MACD oscillator posted a crossover to the upside with its trigger line in the short term.
Immediate resistance is coming from the 1.0097 barrier, taken from the latest highs, while the 20-month peak of 1.0130 could be the next obstacle to look for. A decisive close above this level could prove challenging for the bulls but doing so would shift the attention up to the next barrier of 1.0170.
Alternatively, a downside reversal would likely retest the 20- and 40-simple moving averages (SMAs) currently at 1.0023 and 0.9980 respectively. A drop below these lines could open the way towards 0.9925 and the 23.6% Fibonacci retracement level of the upleg from 0.9185 to 1.0130 around 0.9900. More declines could send prices to challenge the more than one-year rising trend line.
Summarizing, USDCHF maintains a bullish outlook in the long-term picture.
USD/JPY Mid-Day Outlook
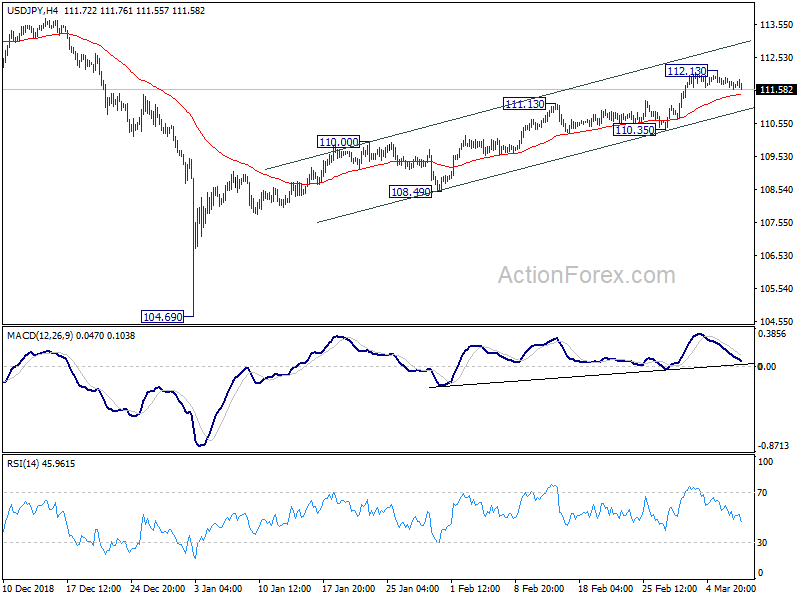
Daily Pivots: (S1) 111.62; (P) 111.77; (R1) 111.93; More...
USD/JPY's retreat from 112.13 is in progress and intraday bias remains neutral first. In case of deeper fall, downside should be contained above 110.35 support to bring another rally. On the upside, above 112.13 will resume rise from 104.69 for 114.54 resistance next.
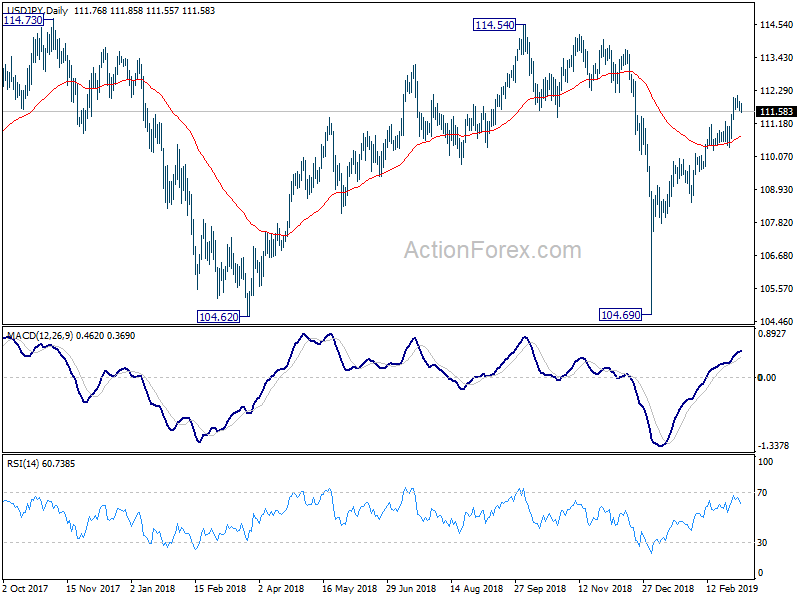
In the bigger picture, current strong rebound from 104.69 argues that decline from 118.65 (2016 high) has completed with three waves down to 104.69, after failing 104.62. More importantly, the rise from 98.97 (2016 low) could be resuming. Focus now turns back to 114.54 resistance, decisive break there will add more credence to this bullish case and target 118.65. This will now be the favored case as long as 110.35 support holds.
USD/CHF Mid-Day Outlook
Daily Pivots: (S1) 1.0033; (P) 1.0045; (R1) 1.0062; More....
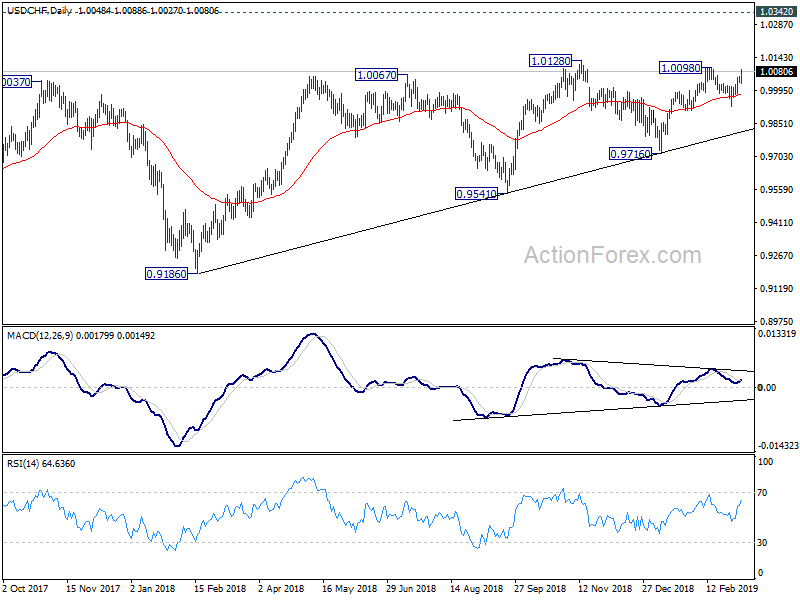
USD/CHF rises to as high as 1.0076 so far and intraday bias remains on the upside for 1.0098/0128 resistance. Decisive break there will resume larger rally from 0.9186. On the downside, below 1.0027 minor support will turn intraday bias back to the downside for 0.9926 support instead.
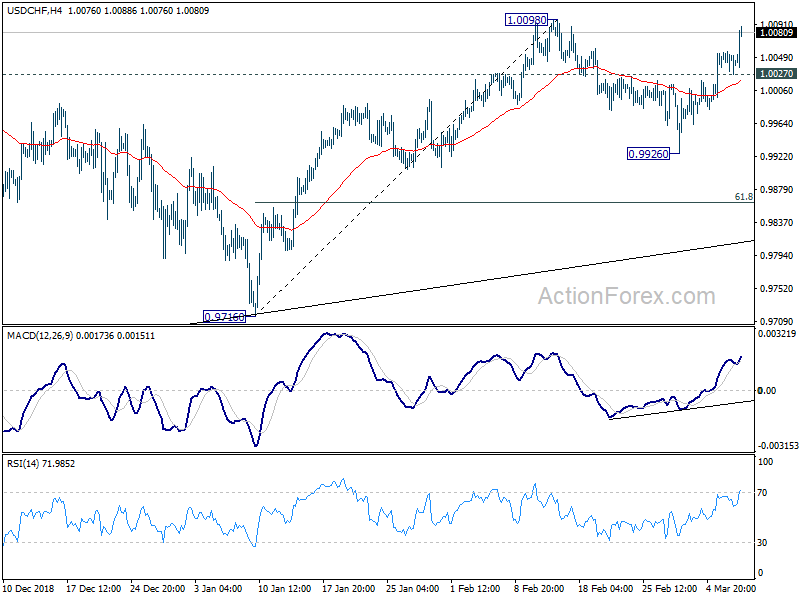
In the bigger picture, USD/CHF drew strong support from medium term trend line and rebounded. That suggests rise from 0.9186 is still in progress. Further break of 1.0128 will confirm up trend resumption and target 1.0342 key resistance. Nevertheless, break of 0.9716 will dampen this bullish view and at least bring deeper fall to 0.9541 key support.
GBP/USD Mid-Day Outlook
Daily Pivots: (S1) 1.3136; (P) 1.3159; (R1) 1.3195; More....
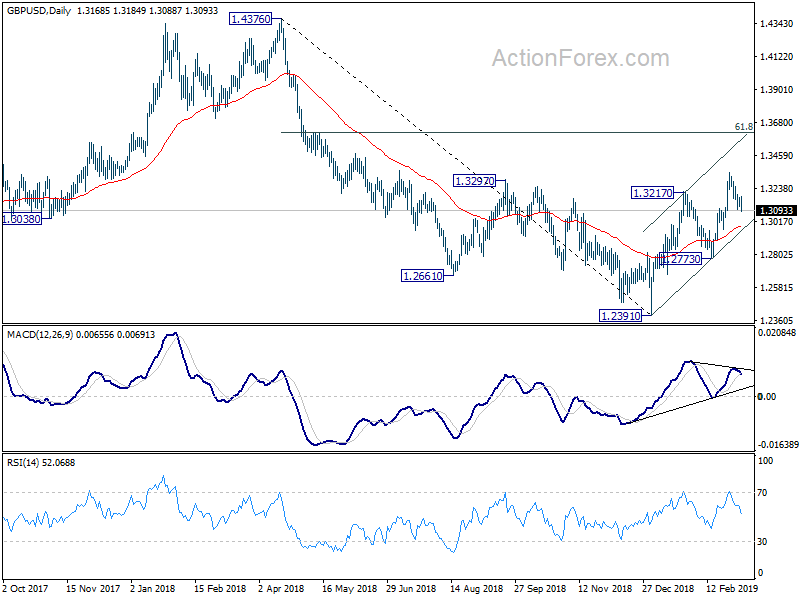
GBP/USD's fall from 1.3350 resumes today and breaks 1.3109 support. Intraday bias is now on the downside for trend line support (now at 1.2968). Decisive break there will add to the case of near term reversal and target 1.2773 support for confirmation. On the upside, above 1.3184 minor resistance will turn bias back to the upside for 1.3350 instead.
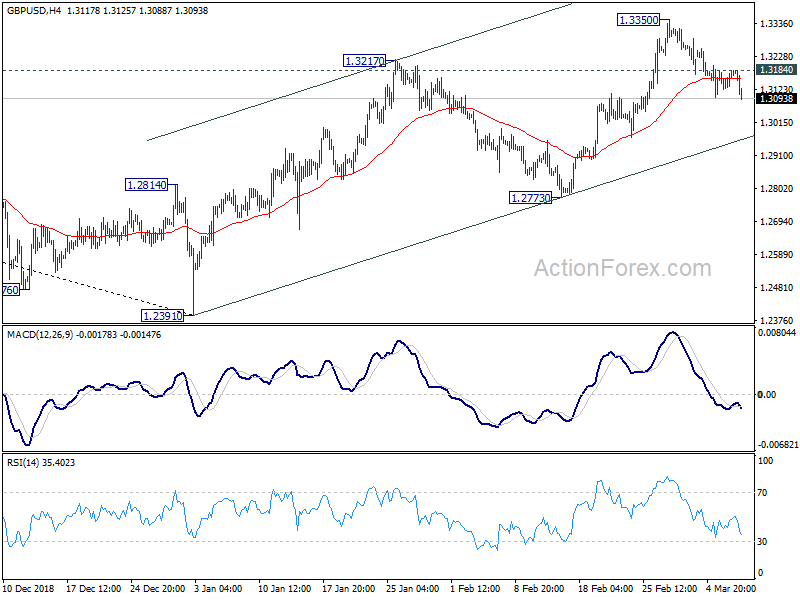
In the bigger picture, medium term decline from 1.4376 (2018 high) should have completed at 1.2391. Rise from 1.2391 is now seen as the third leg of the corrective pattern from 1.1946 (2016 low). Further rise could be seen through 1.4376 in medium term. On the downside, though, break of 1.2773 support will turn focus back to 1.2391 low and then 1.1946.