Sample Category Title
NZDUSD Develops In Narrow Range, SMAs Follow Bearish Move
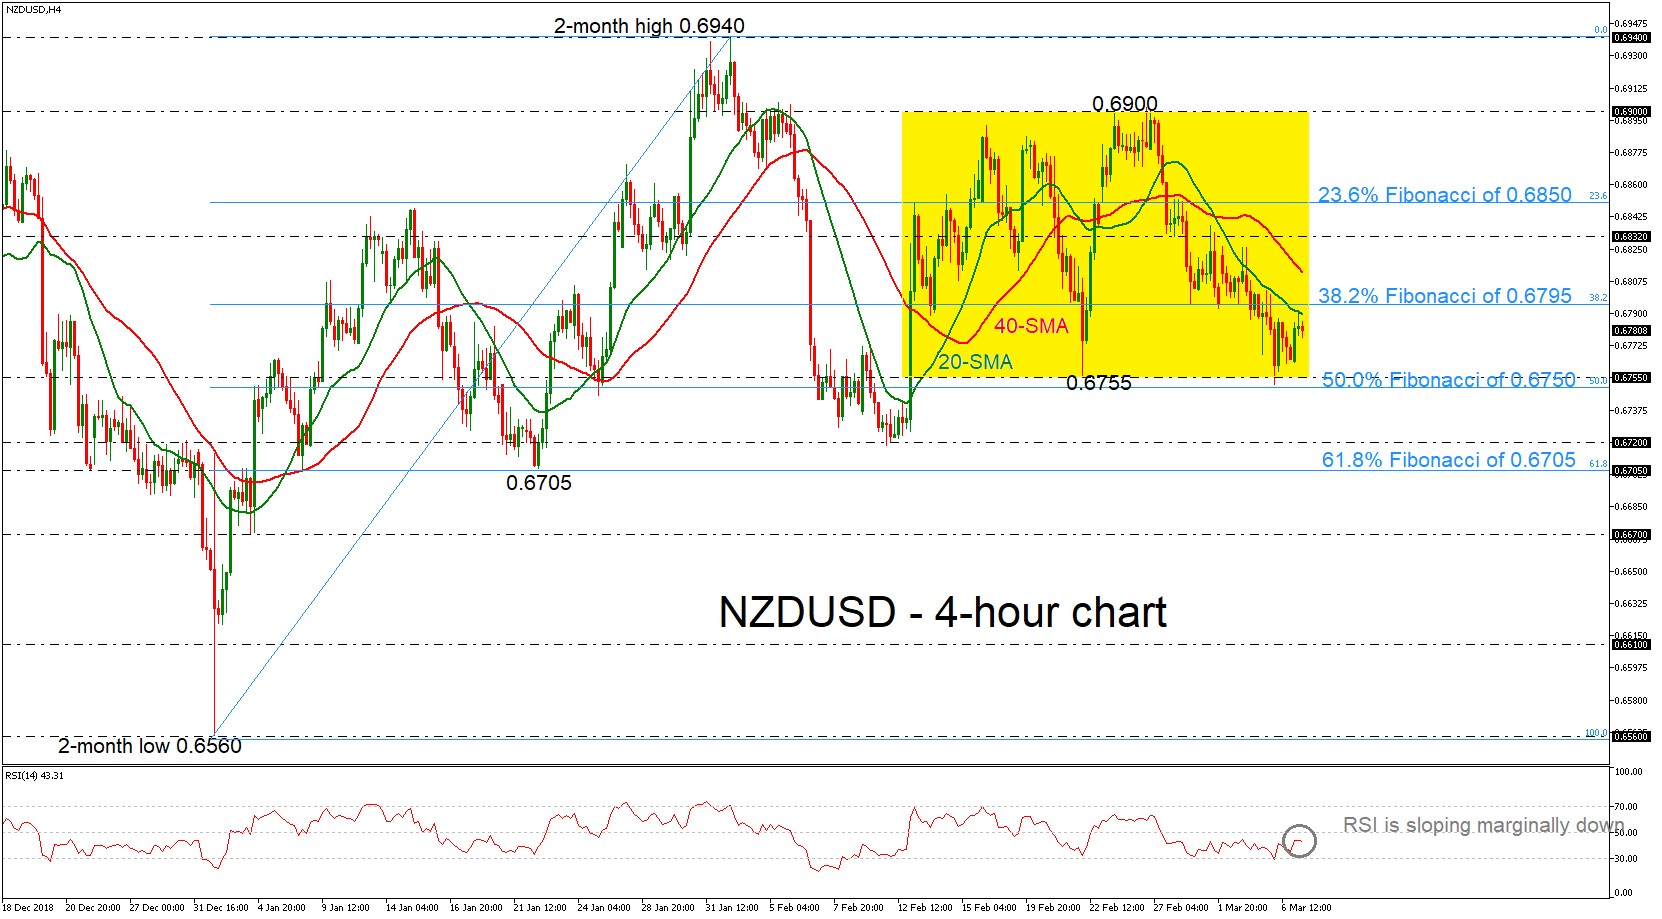
NZDUSD continues to lose momentum after the strong pullback on the 0.6900 handle, which drove the pair beneath the 20- and 40-simple moving averages (SMAs) as well as below0.6795, the 38.2% Fibonacci retracement level of the upleg from 0.6560 to 0.6940. The price has been developing within the 0.6755-0.6900 area over the last three weeks, with the RSI indicator pointing marginally to the downside now in the negative territory, confirming the latest bearish action.
In the negative scenario, a slip below the 0.6755 support and the 50.0% Fibonacci could push prices towards the 0.6720 barrier, taken from the lows on February 12. Even lower, the next key level for traders to have in mind is the 61.8% Fibonacci of 0.6705, which if broken, steeper downside movements could emerge.
A reversal to the upside and a successful jump above the 20-SMA and the 38.2% Fibonacci of 0.6795 could see a retest of the 40-SMA around 0.6812. Slightly higher the 0.6832 restrictive mark could attract interest as well, while the 23.6% Fibonacci of 0.6850 could be the next resistance to turn attention in the near term.
In the bigger picture, NZDUSD is still neutral as the market has yet to create a tendency.
USDJPY Bulls Defending Pivot
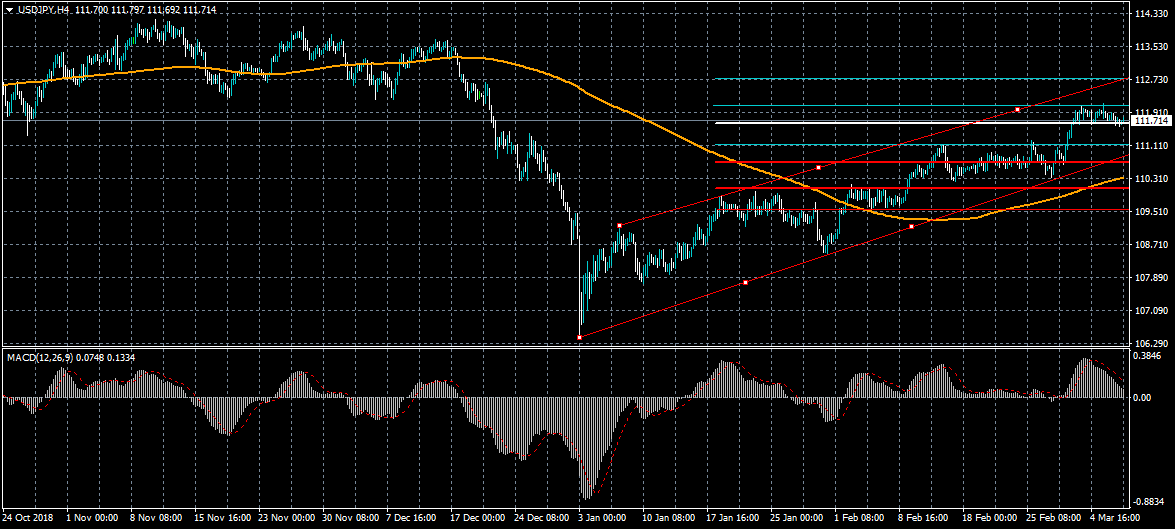
The US dollar retains an intraday bullish bias against the Japanese yen currency as bulls continue to defend the pivotal 111.60 level. The four-hour time frame is showing the USDJPY pair trading within a rising price channel, with the top the pattern extending towards the 112.75 level. The MACD indicator on the four-hour time frame is still correcting from overbought conditions.
The USDJPY pair is only intraday bullish while trading above the 111.60 level, key technical resistance is found at the 112.20 and 112.75 levels.
If the USDJPY pair trades below the 111.60 level, sellers are expected to test towards the 111.10 and 110.90 support levels.
EURO Traders Await ECB Decision
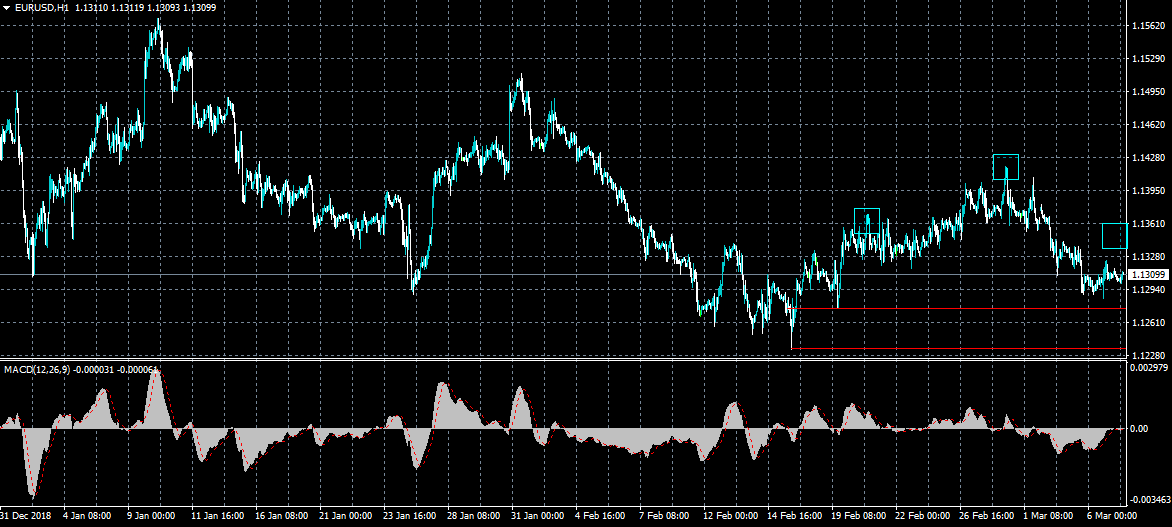
The euro currency remains close to the 1.1300 level against the US dollar as traders await the outcome of the European Central Bank interest rate decision and monetary policy statement. A bearish head and shoulders pattern has formed on the four-hour time frame, with the neckline of the pattern found at the 1.1275 level. Only a sustained move above the 1.1420 resistance level can negate the bearish pattern currently looming over the EURUSD pair.
The EURUSD pair is intraday bearish while trading below the 1.1300 level, key technical support is found at the 1.1275 and 1.1230 levels.
If the EURUSD pair holds above the 1.1300 level, buyers may test towards the 1.1360 and 1.1420 levels.
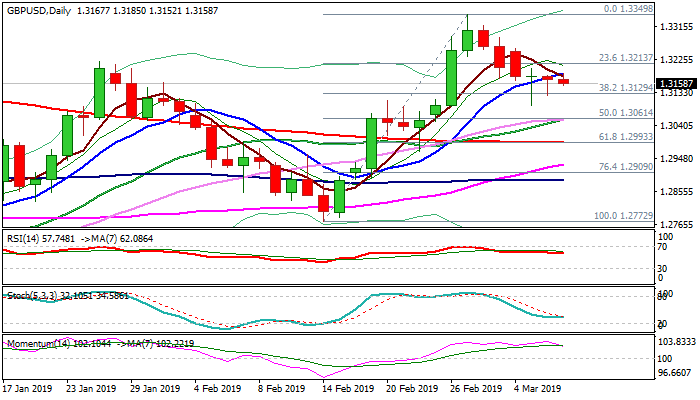
GBP/USD Outlook: Extended Sideways Mode On Expectations For Fresh News About Brexit
Cable trades within tight range in early Thursday, following two consecutive long-tailed Dojis (Wed/Tue) which signaled directionless near-term mode in absence of Brexit deal breakthrough.
Traders eye 12 Mar parliamentary vote on PM May’s Brexit deal, which are expected to provide stronger direction signals.
Current quotes (2/5 for the deal to be rejected and 7/4 for deal to be approved), maintain optimism that no-deal Brexit will be avoided that would also offer fresh support for sterling.
On the other side, news that circulate in the public, signal that deal will be rejected by up to 100 votes.
Conflicting news and expectations keep pound directionless, but weakening daily studies (formation of 5/10SMA bear-cross and south-heading momentum) keep in play risk of eventual clear break below cracked pivotal Fibo support at 1.3129 (38.2% of 1.2772/1.3349) that would signal continuation of pullback from 1.3349 peak.
Res: 1.3185, 1.3198, 1.3254, 1.3286
Sup: 1.3152, 1.3129, 1.3097, 1.3061
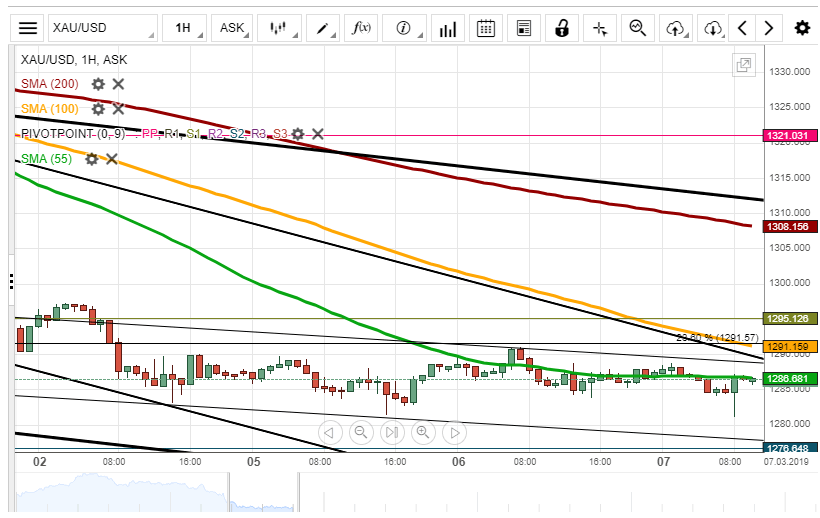
XAU/USD Will Depreciate To 1,280.00
During Wednesday's trading session, the yellow metal was trading between the 55-hour simple moving average to end the trading day at 1,285.00.
On Thursday morning, gold was located below the 55-hour simple moving average at the 1,286.10 mark.
In regards to the near-term future, most likely, the 55-hour simple moving average will retrace the rate to push it to depreciate towards the 1,280.00 level.
EUR/USD Will Trade Between SMAs
During Wednesday's trading session, the 55-hour simple moving average retraced the rate to 1.2800. On Thursday morning, the currency exchange rate broke the resistance of the 55-hour simple moving average to stay at the 1.1308 mark.
In regards to the near-term future, it is expected that the rate will trade sideways between the 55-hour and the 200-hour simple moving averages at the 1.3220 level.
However, the European Single Currency could depreciate against the US Dollar during today's EU Main Refinancing Rate at 12:45 GMT to push the rate to break the pattern line at the 1.1280 mark.

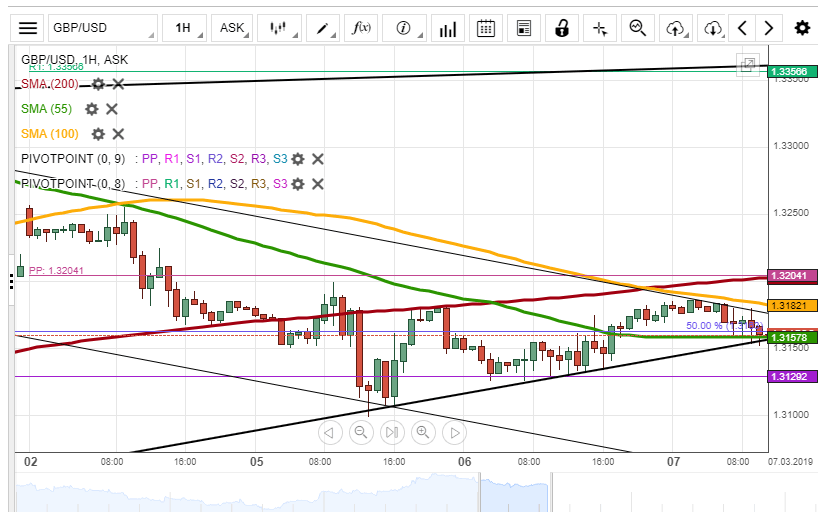
GBP/USD Could Depreciate To Monthly PP At 1.3129
During Wednesday's trading session, the rate traded sideways between the 55-hour and the 100-hour simple moving averages to end the trading session at 1.3150. On Thursday morning, the currency exchange rate was located above the 50.00% Fibo at the 1.3165 mark.
In regards to the near term future, most likely, the 100-hour simple moving average will resist the rate to break the medium pattern line at 1.3150 mark to depreciate towards the monthly pivot point at 1.3129.
On the other hand, the 55-hour simple moving average could support the rate to push the rate to stay at the 1.3150 level during the day.
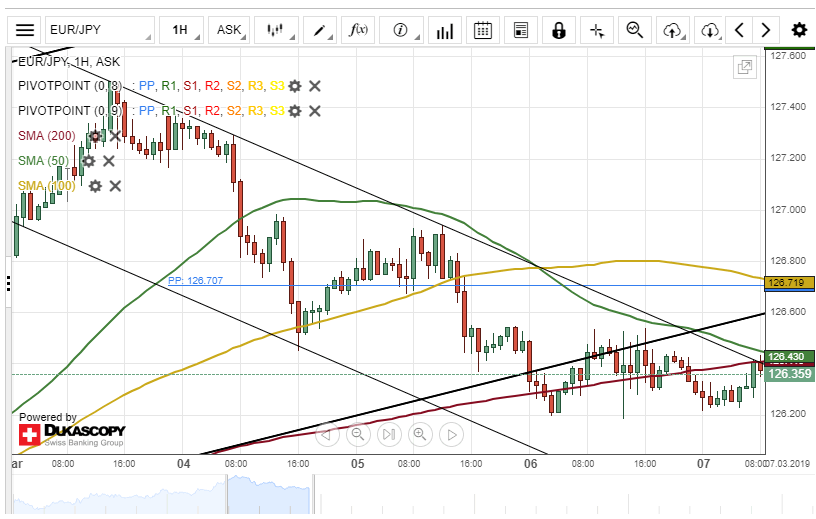
EUR/JPY Set For Breakout
A junior descending channel pattern has guided the common European currency lower against the Japanese Yen. The currency pair reached a two-week low during yesterday's trading session.
The exchange rate was trading near the upper boundary of the junior descending channel at 126.33 and could be set for a breakout.
If this breakout occurs, the currency exchange rate will aim for a resistance cluster formed by the 100-hour simple moving average and the weekly pivot point at 126.74.
However, the 50-hour SMA at 126.46 could provide resistance for the EUR/JPY pair within this session.
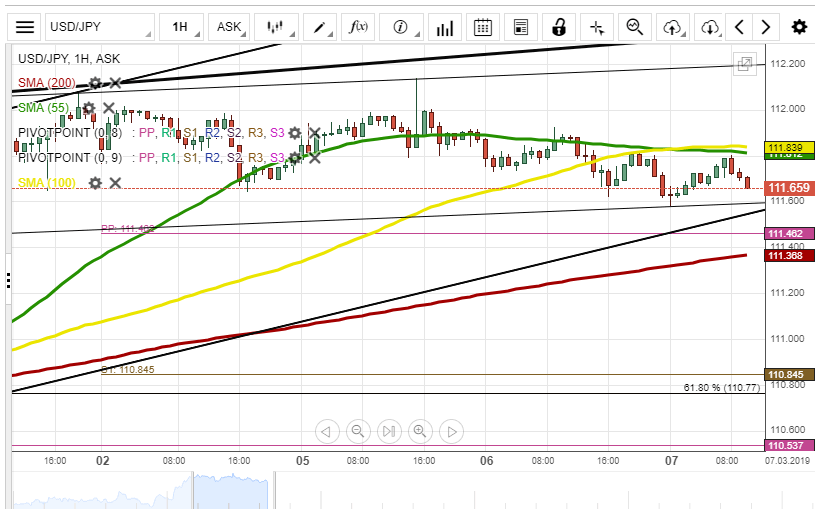
USD/JPY Moves Sideways At 111.60
During Wednesday's trading session, the 100-hour simple moving average resisted the rate to 111.50. On Thursday morning, the currency exchange rate appreciated towards the 55-hour simple moving average to be located at the 111.70 marks.
In regards to the near-term future, most likely, the rate will move sideways due to a lack of any fundamental news during the day.
It is expected that the currency exchange rate will end today's trading session at the 111.60 level.
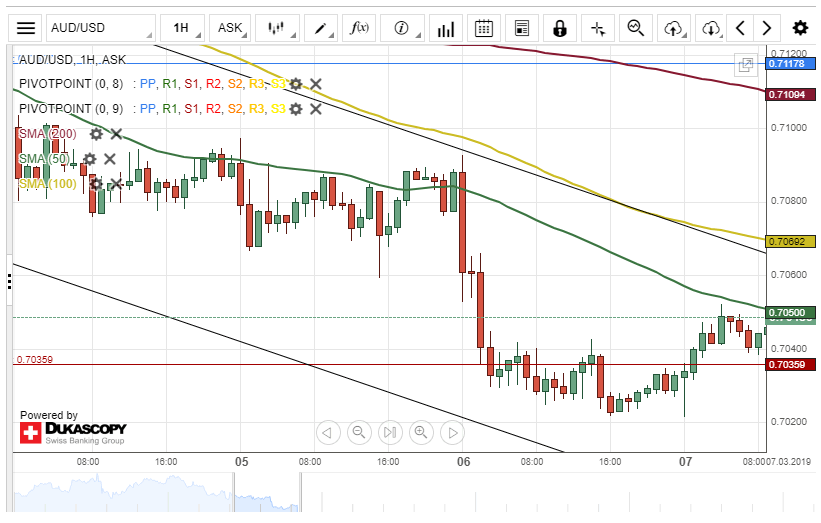
AUD/USD Remains Near 50-Hour SMA
A one-week descending channel pattern has guided the Australian Dollar lower against the US Dollar. The currency pair depreciated by about 70 base points during Wednesday's trading session.
The 50-hour simple moving average was providing resistance for the AUD/USD currency pair at 0.7052 during the first half of today's trading session.
If the exchange rate passes the 50-hour SMA, the next target for bullish traders will be near a swing high of 0.7092.
Although, if the resistance line formed by the 50-hour moving average holds, a decline towards the monthly S1 at 0.7005 could be expected today.