

Sample Category Title
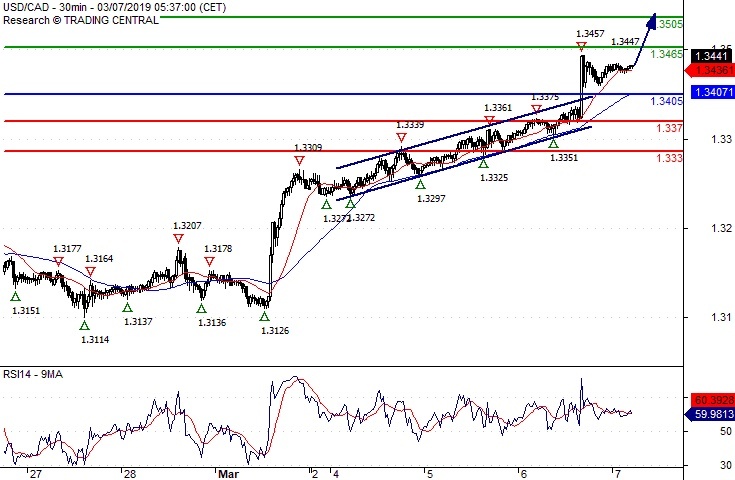
USD/CAD Towards 1.3505
Pivot (invalidation): 1.3405
Our preference Long positions above 1.3405 with targets at 1.3465 & 1.3505 in extension.
Alternative scenario Below 1.3405 look for further downside with 1.3370 & 1.3330 as targets.
Comment The RSI lacks downward momentum.
Retracement in Forex Trading
Leonardo Fibonacci, an Italian mathematician from Pisa, is credited with introducing the Hindu-Arabic numeral system to Europe during the Middle Ages. In his book, Liber Abaci or ‘Book of Calculation’, he also introduced an influential sequence of figures which have come to be known as the Fibonacci numbers.
The relationship between the numbers in this sequence (i.e. the ratio) is not just interesting on a theoretical level. It appears frequently around us in the physical world and is integral for maintaining balance in nature and architecture. It is also important in the financial markets; many traders use Fibonacci ratios to calculate support and resistance levels in their forex trading strategies.
What is the Fibonacci sequence?
Each number in the Fibonacci sequence is calculated by adding together the two previous numbers.
| 1 | 1 | 2 | 3 | 5 | 8 | 13 | 21 | 34 | 55 | 89 | 144 | 233 | 377 | … | and so on to infinity |
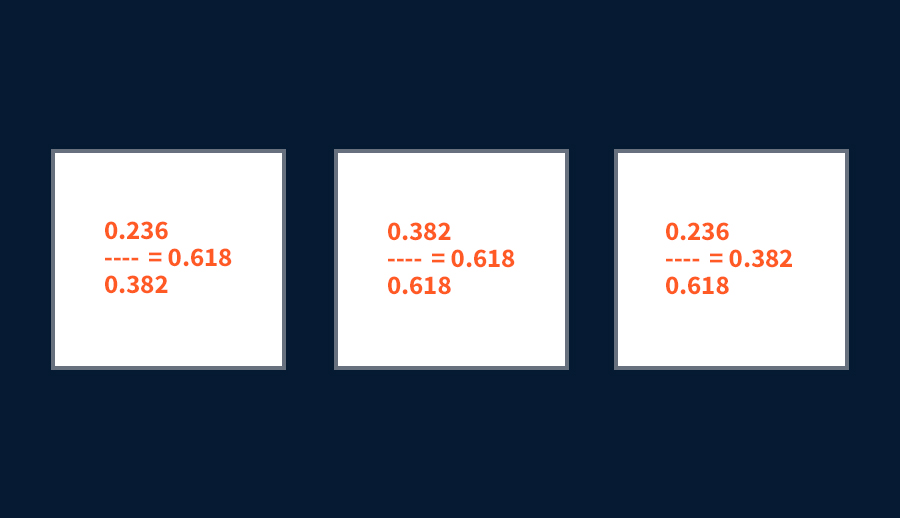
What is significant about this pattern, however, is that the ratio of any number to the next one in the sequence tends to be 0.618.
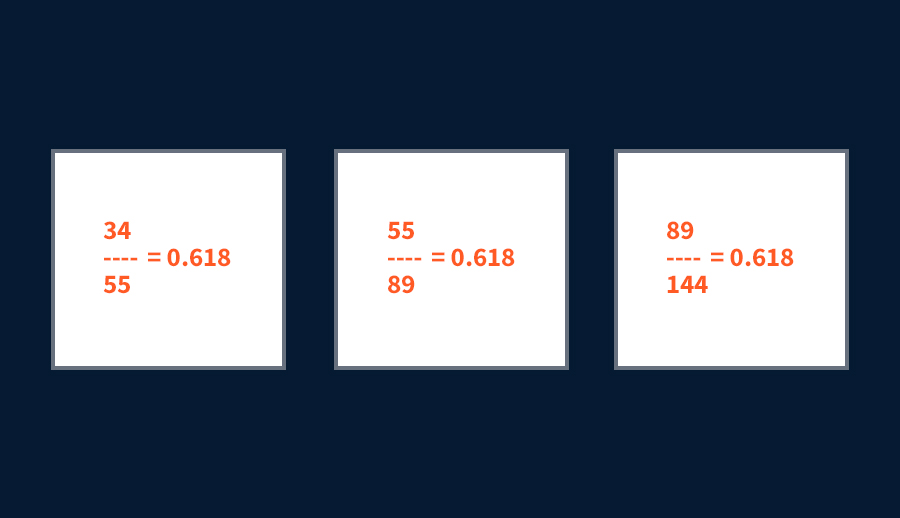
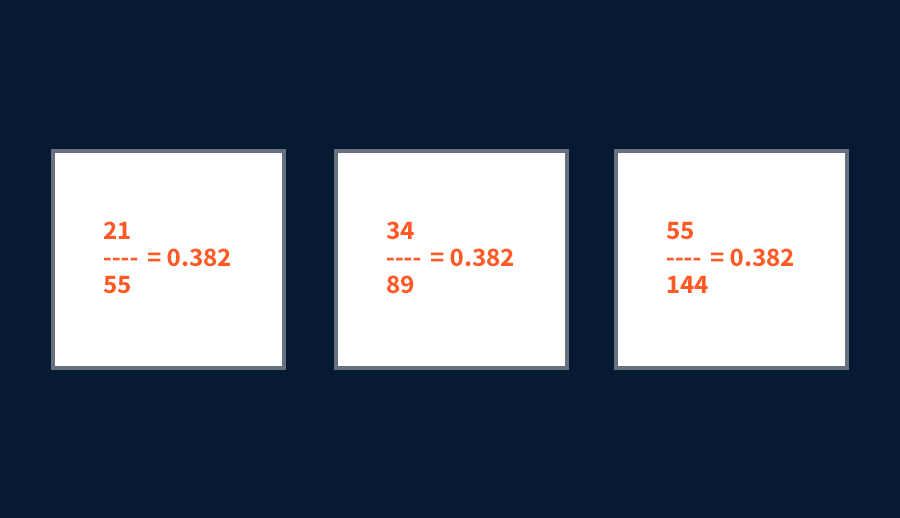
Furthermore, the ratio of any number to the number two places ahead in the sequence is always 0.382.
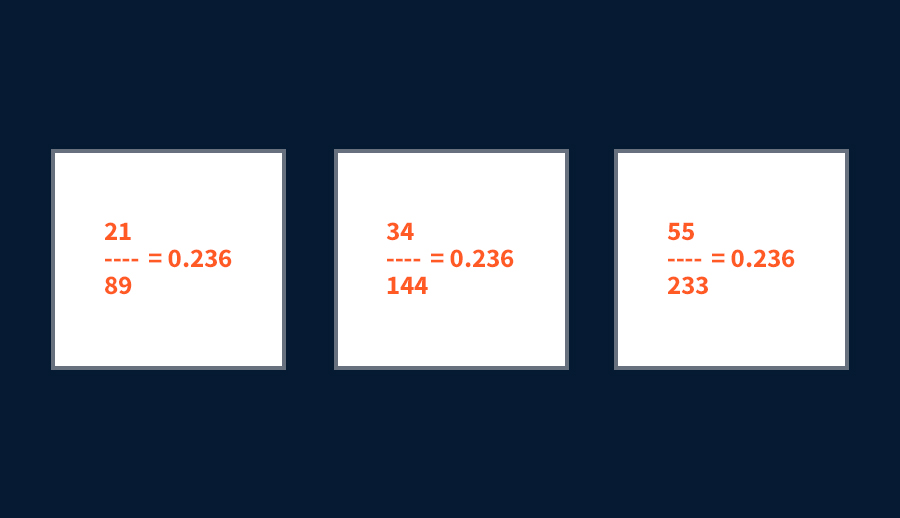
Similarly, the ratio of any number to the number three places ahead tends to be 0.236.
These ratios are commonly known as Fibonacci ratios.
Dividing these Fibonacci ratios will result in either 0.618 or 0.382:
How Fibonacci retracement works
In trading, these ratios are also known as retracement levels. Traders wait for prices to approach these Fibonacci levels and act according to their strategy. Usually, they look for a reversal signal on these widely watched retracement levels before opening their positions. The most commonly used of the three levels is the 0.618 – the inverse of the golden ratio (1.618), denoted in mathematics by the Greek letter φ.
How to draw Fibonacci retracement levels
Drawing Fibonacci retracement levels is a simple three-step process:
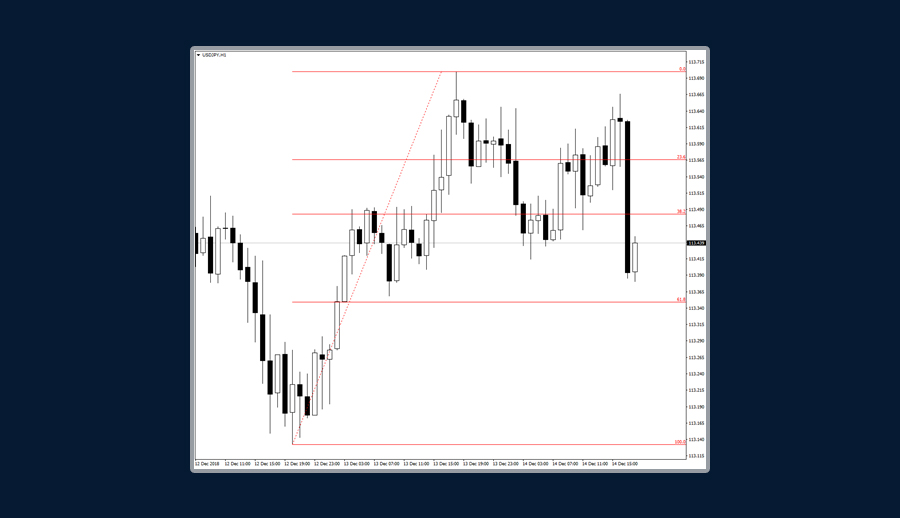
In an uptrend:
- Step 1 – Identify the direction of the market: uptrend
- Step 2 – Attach the Fibonacci retracement tool on the bottom and drag it to the right, all the way to the top
- Step 3 – Monitor the three potential support levels: 0.236, 0.382 and 0.618
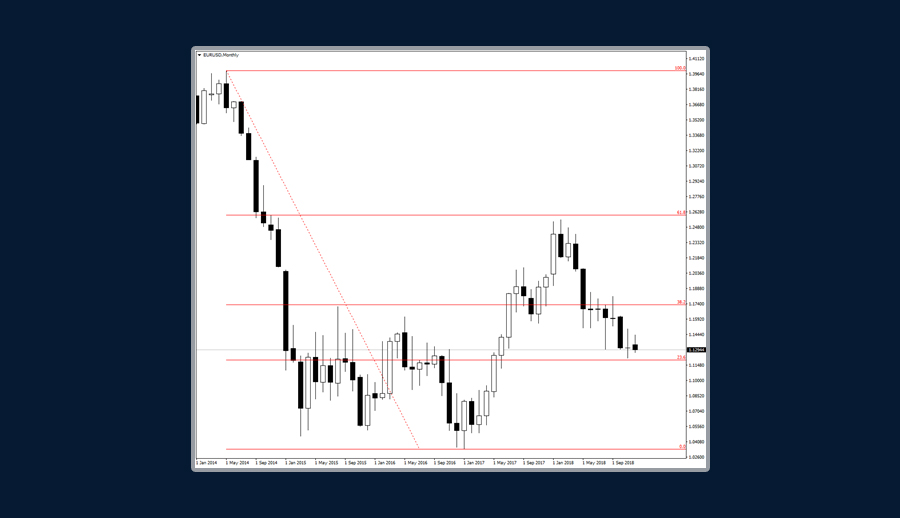
In a downtrend:
- Step 1 – Identify the direction of the market: downtrend
- Step 2 – Attach the Fibonacci retracement tool on the top and drag it to the right, all the way to the bottom
- Step 3 – Monitor the three potential resistance levels: 0.236, 0.382 and 0.618
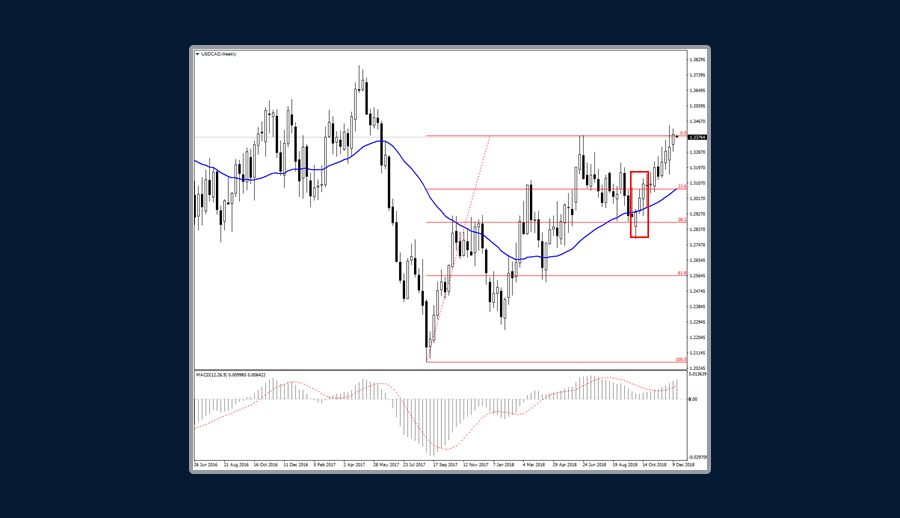
Of course, it is more reliable to look for a confluence of signals (i.e. more reasons to take action on a position). Don’t fall into the trap of assuming that just because the price reached a Fibonacci level the market will automatically reverse.
Combine Fibonacci levels with Japanese Candlestick patterns, Oscillators and Indicators for a stronger signal. As you can see in the chart below, the “Three White Soldiers” pattern is confirmed by the fact that prices are trading above the Moving Average line, and additionally that the MACD (Moving Average/Convergence Divergence) is above the zero line.
Trading using Fibonacci retracements
Every trader, especially beginners, dreams of mastering the Fibonacci theory. A lot of traders use it to identify potential support and resistance levels on a price chart which suggests reversal is likely. Many enter the market just because the price has reached one of the Fibonacci ratios on the chart. That is not enough! It is better to look for more signals before entering the market, such as reversal Japanese Candlestick formations or Oscillators crossing the base line or even a Moving Average confirming your decision.
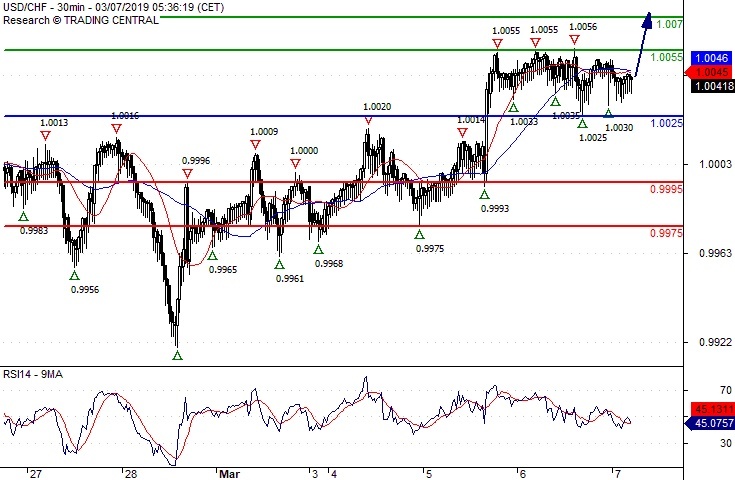
USD/CHF The Bias Remains Bullish
Pivot (invalidation): 1.0025
Our preference Long positions above 1.0025 with targets at 1.0055 & 1.0070 in extension.
Alternative scenario Below 1.0025 look for further downside with 0.9995 & 0.9975 as targets.
Comment Even though a continuation of the consolidation cannot be ruled out, its extent should be limited.
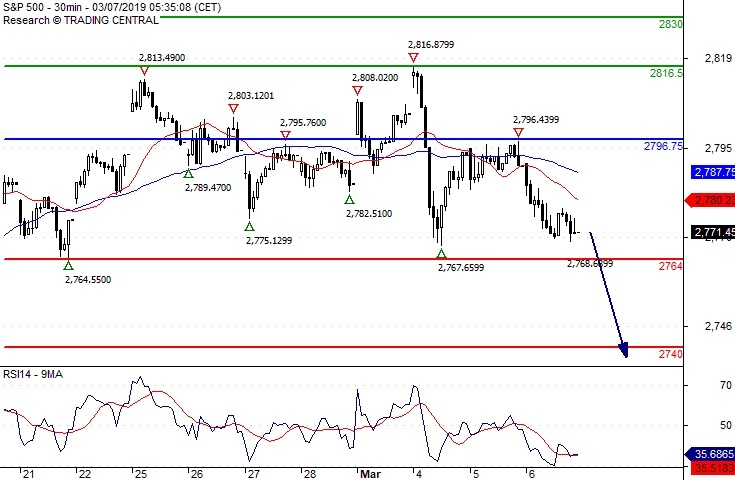
S&P 500 The Downside Prevails
Pivot (invalidation): 2796.75
Our preference Short positions below 2796.75 with targets at 2764.00 & 2740.00 in extension.
Alternative scenario Above 2796.75 look for further upside with 2816.50 & 2830.00 as targets.
Comment The RSI is bearish and calls for further decline.
Trade Bitcoin the Right Way
To say recent history has been an emotional roller-coaster for Bitcoin would be an understatement!
The market opened 2017 at a price of $966.0 and wrapped up the year at $18,960, carving out a whopping 1861.51% gain.
2018, however, has not been so kind. Deteriorating from its 2017 peak just south of the $20,000 mark to lows of $5858.6, the unit wiped approximately 70% off its value, as of current price.
Preceding these events Bitcoin was reasonably sedentary. In August 2008, the domain name bitcoin.org was quietly registered online. Two months later, a white paper was published: ‘Bitcoin: A Peer-to-Peer Electronic Cash System‘. On January 3, 2009, 30,000 lines of code spelt out the beginning of Bitcoin.
It’s widely thought Satoshi Nakamoto was a pseudonym used by the unknown person(s) who designed Bitcoin. Despite the anonymity, the unit has since evolved into the most capitalized and traded cryptocurrency in the world. Current numbers demonstrate a market cap of over $143 billion. As of writing, 17,290,900 million bitcoins are in circulation, against a presently capped limit of 21 million.
Bitcoin – and in particular blockchain – undoubtedly has the potential to revolutionise the financial services industry. A blockchain functions as a transparent digital ledger of economic transactions, recorded in chronological order that operates on a peer-to-peer network, or P2P. In its simplest form, P2P is created when two or more computers connect, enabling both to share resources (in this case bitcoins) without having to go through a separate server. Similar to traditional bank accounts, you can receive bitcoins to your Bitcoin address even if you’re offline.
Bitcoin: Investment or speculation?
Queries relating to Bitcoin’s worth as an investment or its use as a speculative instrument will likely differ depending on who you ask.
While a number of key players interact with the crypto market, two financial figures with conflicting views stand out:
- The chairman and CEO of Berkshire Hathaway, Warren Buffet, states ‘unlike buying stocks, bonds or real estate, Bitcoin is not an investment – it’s speculation.
- George Soros: the man who broke the Bank of England, despite being publicly dubious of Bitcoin in the past, has reportedly given his investment fund the green light for investing in crypto. However, they’ve yet to openly voice an investment on a specific project.
Key aspects driving Bitcoin price movement
Unlike fiat currencies (euro, US dollar and yen), bitcoins are digital coins not issued by any government or legal entity. Bitcoins rely on cryptographic protocols and a distributed network of users to mint, store and transfer.
Price/value is determined by a number of factors:
- Day traders – intraday speculation.
- Long-term speculators – buy and hold.
- Early adopters using the coin as a payment instrument.
- Vendors who accept the coin in exchange for products and services.
Supply and demand:
Like any other commodity, Bitcoin responds to supply and demand forces. The market value of Bitcoin – that is the price individuals and companies are willing to pay for it – fluctuates 24/7.
Based on the popularity of Bitcoin and trust among cryptocurrency community members, price was able to rapidly advance in 2017. With supply capped at 21 million, it is expected price will likely rebound from its 2018 lows in the future, though this remains heavily debated in the financial community.
News:
News about hacking, a number of government regulatory forces, well-known celebrities commenting on its movement/their investment plans, and scams, all contribute to Bitcoin price movement. Even the mildest rumour circulating the internet typically causes a noticeable effect.
Reports of exchange hacks in South Korea, India surveying transactions on multiple exchanges in order to collect tax revenue, a crackdown on exchanges in Japan, and China blocking more than 120 foreign cryptocurrency exchanges as part of the government’s broader crackdown, are just some of the news points that have affected crypto pricing in recent months.
Trade Bitcoin using technical analysis
In similar fashion to the foreign exchange market, Bitcoin appears ‘technical friendly’.
In fact, a number of technicians boast increased success in the crypto market.
The team’s objective here, therefore, is to highlight effective technical tools to tackle Bitcoin’s price movement, and ultimately profit. While there are a number of Bitcoin trading strategies littered throughout the internet, keeping things simple is key!
Despite the critics, technical trading is an extremely profitable endeavour, and it’s generally those who keep it simple that prosper in this domain.
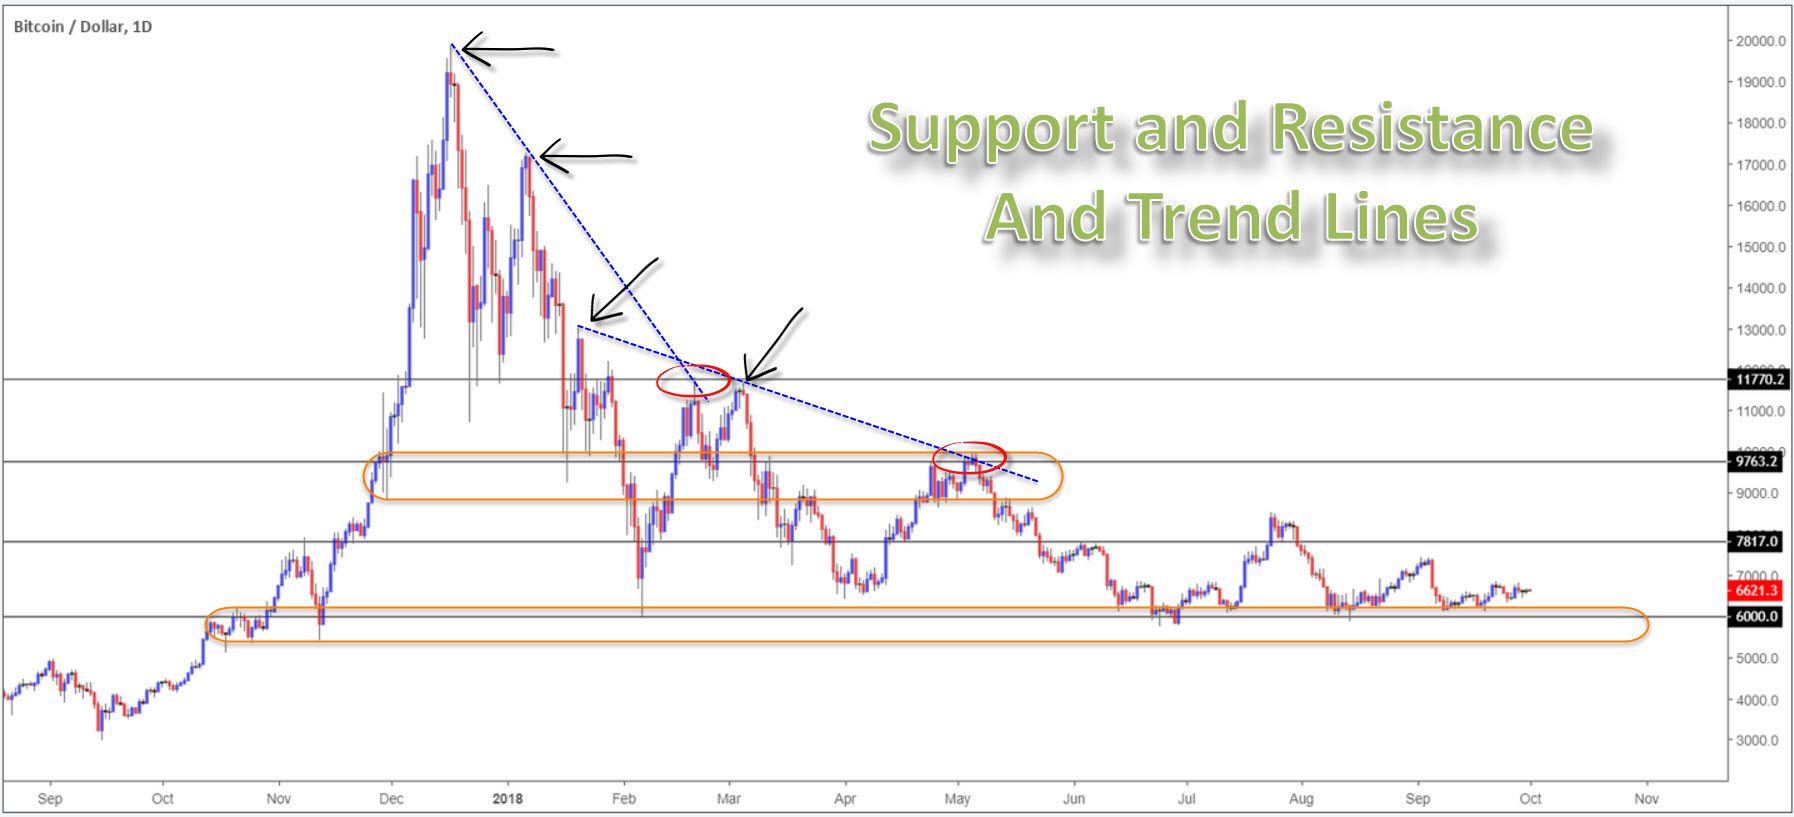
Support and resistance, the backbone of many technical strategies, is crucial to understand. Knowing how to correctly plot support and resistance levels on a chart will put you light-years ahead of the competition.
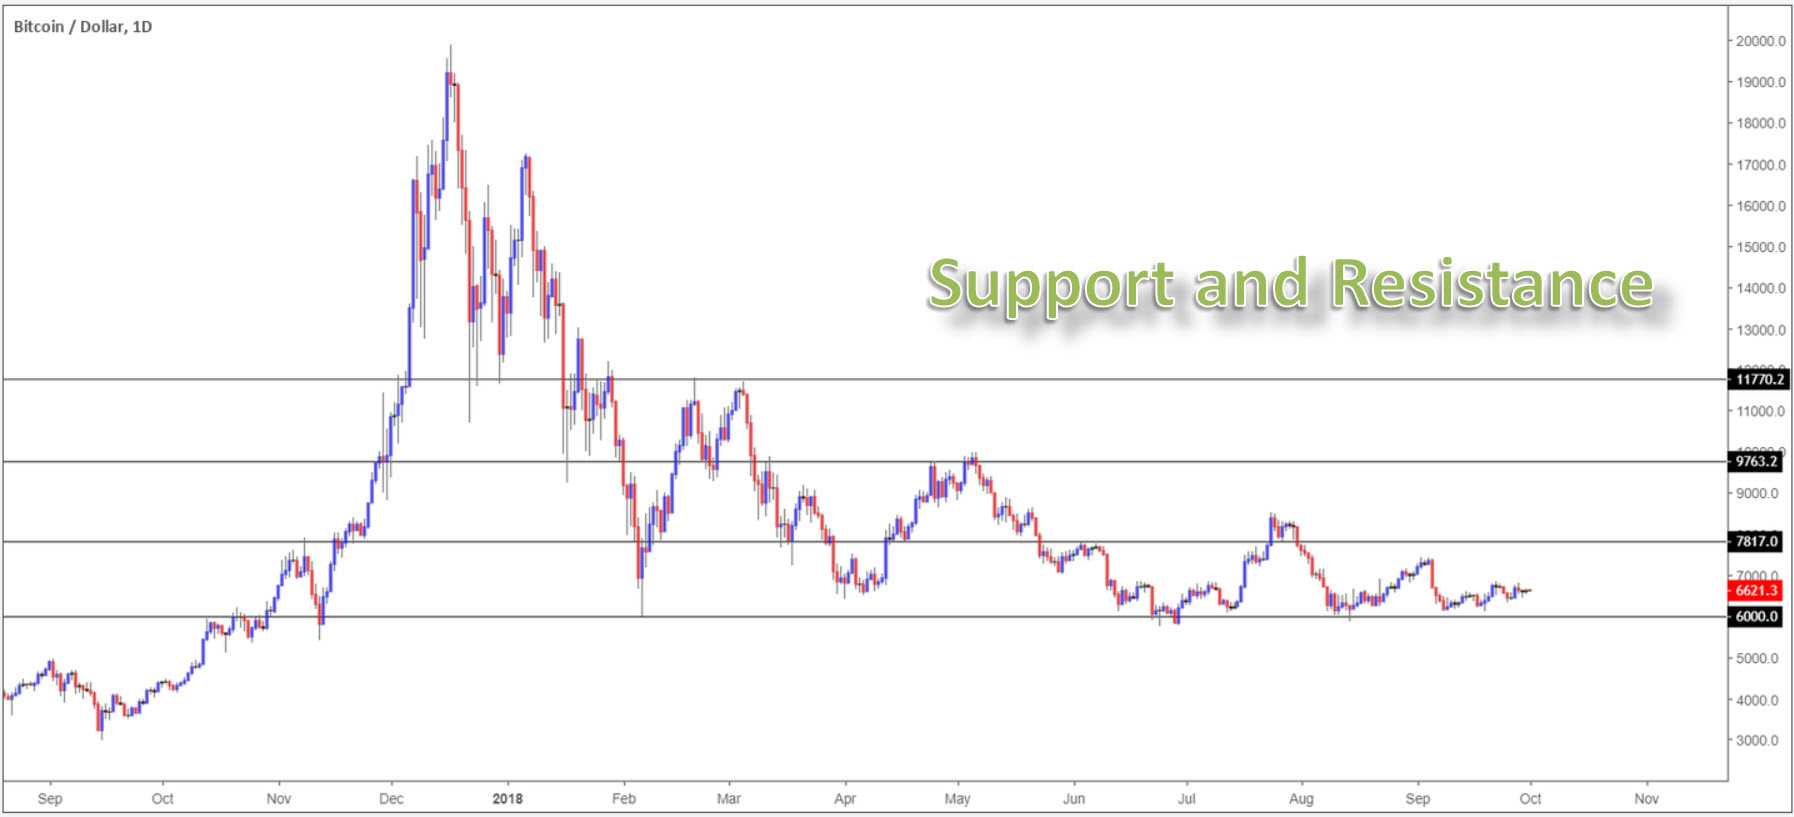
The chart posted below emphasizes robust support and resistance levels on the daily timeframe of BTC/USD (Bitcoin vs. the US dollar), offering traders a number of opportunities to participate in the market. Note each level boasts historical significance.
A support level denotes a ‘floor’ of a market, whereas a resistance level represents a ceiling. Note the $6000.0 mark on Bitcoin (also a psychological level) is a key barrier of support, rejecting price on a number of occasions in the past, and recently in August 2018. $7817.0 also established a point of resistance in the early stages of 2017, and has served the market as both support and resistance going forward.
At its most basic, a level of support is where downside is capped due to buying. A resistance level is similar, only inverse. Instead of buying activity, it is selling that holds the level firm. Traders use this understanding of market psychology as a means of initiating a foundation to trade.
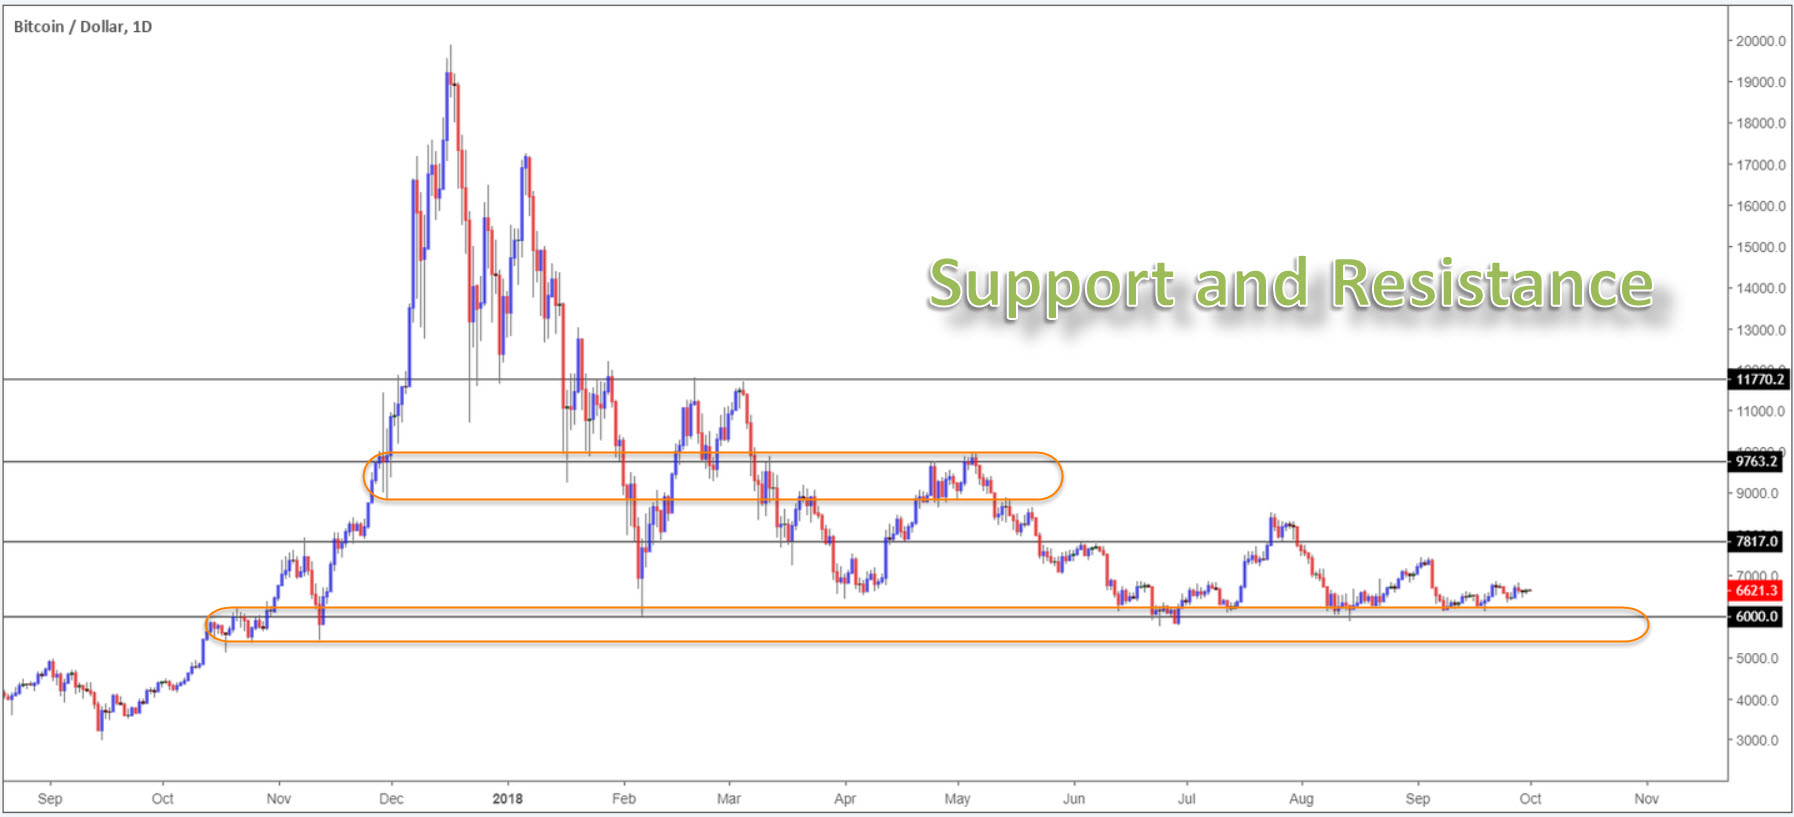
As demonstrated on the chart below, to draw effective support and resistance levels, traders should view support and resistance points as zones (marked in orange), and not defined price points. Adopting the use of a zone in place of a fixed level gives trades room to breathe. Support and resistance levels are seldom respected to the pip, and this is where the majority of traders are usually trapped and stopped out.
Trend lines are another key aspect to consider. When merging with noteworthy support and resistance levels, killer trading is possible.
By definition, trend lines are barriers drawn at an angle above or below price. An ascending trend line forms by connecting two or more low points. The second low must be higher than the first for the line to have a positive slope, i.e., a higher low. Note at least two points should connect before the line is considered valid. The same is said for descending trend lines, only inverse.
Do you use the candle wicks/tails or the bodies to draw these lines?
This is a question that crops up all the time. And the answer is simple: use both! Adopting both the candle extremes and the bodies allows market participants to pencil in a buffer, so to speak. Like support and resistance levels, considering a trend line as a definitive price point is a challenge. It should always be drawn in as an area.
Using the same time frame, two high-probability trades are observed on the chart below at points where a descending trend line and support/resistance intersect (red circles):
As humans we love to overcomplicate things!
While an elaborate trading strategy may impress your family and friends, it is unnecessary to succeed. That can be said for any market.
For those involved in the markets for a while will already know keeping things simple is a MUST in trading. And that’s why trend lines and support and resistance levels remain a favourite among the technical community. Both are relatively easy to apply and offer high-probability turning points.
The only other point traders are urged to include is trend direction. As you can see on the chart above, both trading opportunities were alongside the predominant trend. Folks who feel they need additional confirmation on top of this, however, may want to consider Fibonacci calculations, specifically the 38.2% and 61.8% values.
This, by and of itself, is sufficient enough to achieve success in the cryptocurrency markets:
- Support and resistance levels.
- Trend lines.
- Trend direction.
- Fibonacci calculations (optional).
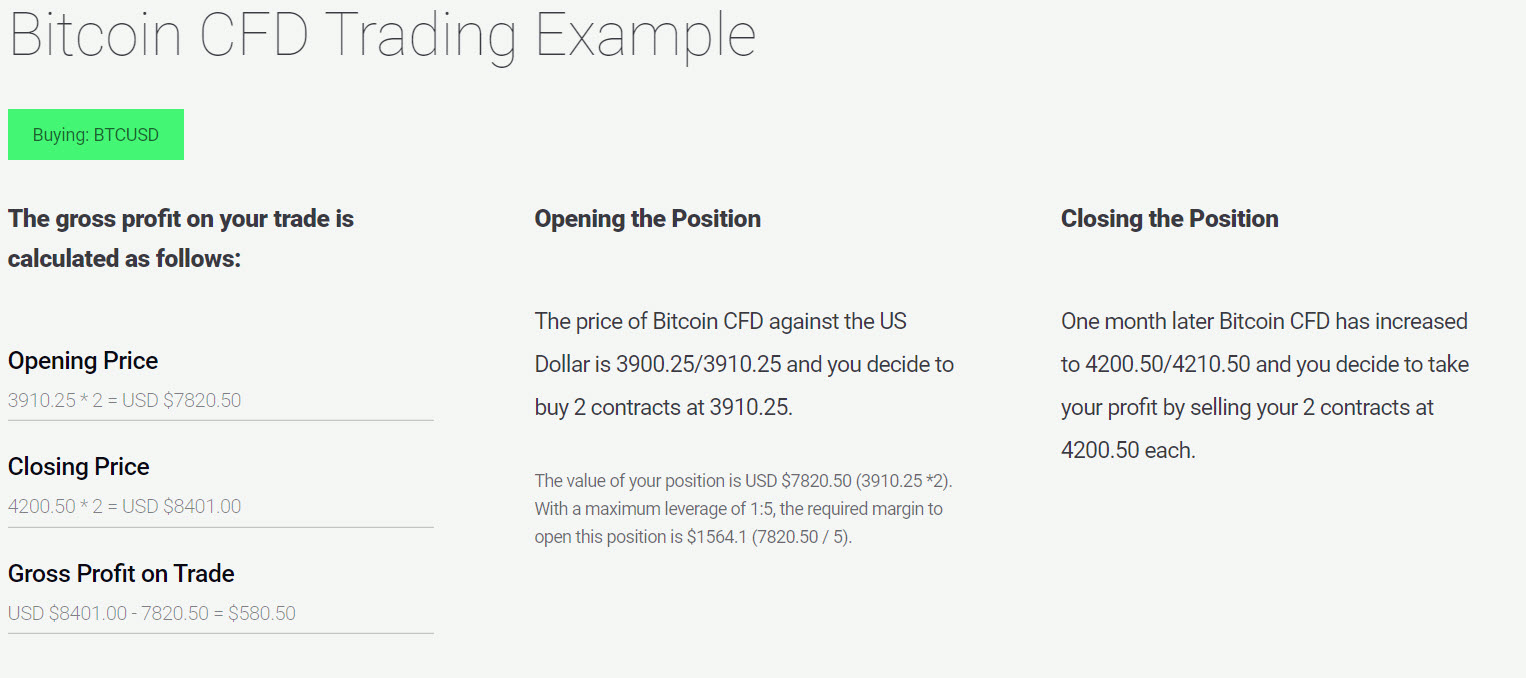
The advantages of trading Bitcoin with IC Markets
FACTS:
- Leverage up to 1:5
- Trade the market 24/5
- Trade long or short
- ASIC regulated
- No commissions
- Live support
Entering the world of digital currencies for the first time is overwhelming and stressful.
IC Markets, however, removes this element, offering a straightforward process from start to finish.
IC Markets is a true Electronic Communication Network (ECN) broker. A true ECN connects traders to a diverse mix of up to 50 liquidity providers. In addition to this, we offer some of the tightest spreads in the industry, leverage up to 1:5, superior execution and to-the-pip pricing from tier-1 banks.
IC Markets cryptocurrency CFD products also allows traders to go long/short without taking ownership of the cryptocurrency. This means traders can obtain exposure to cryptocurrencies without the worry of security risks associated with storing it, and counterparty risk from the exchange.
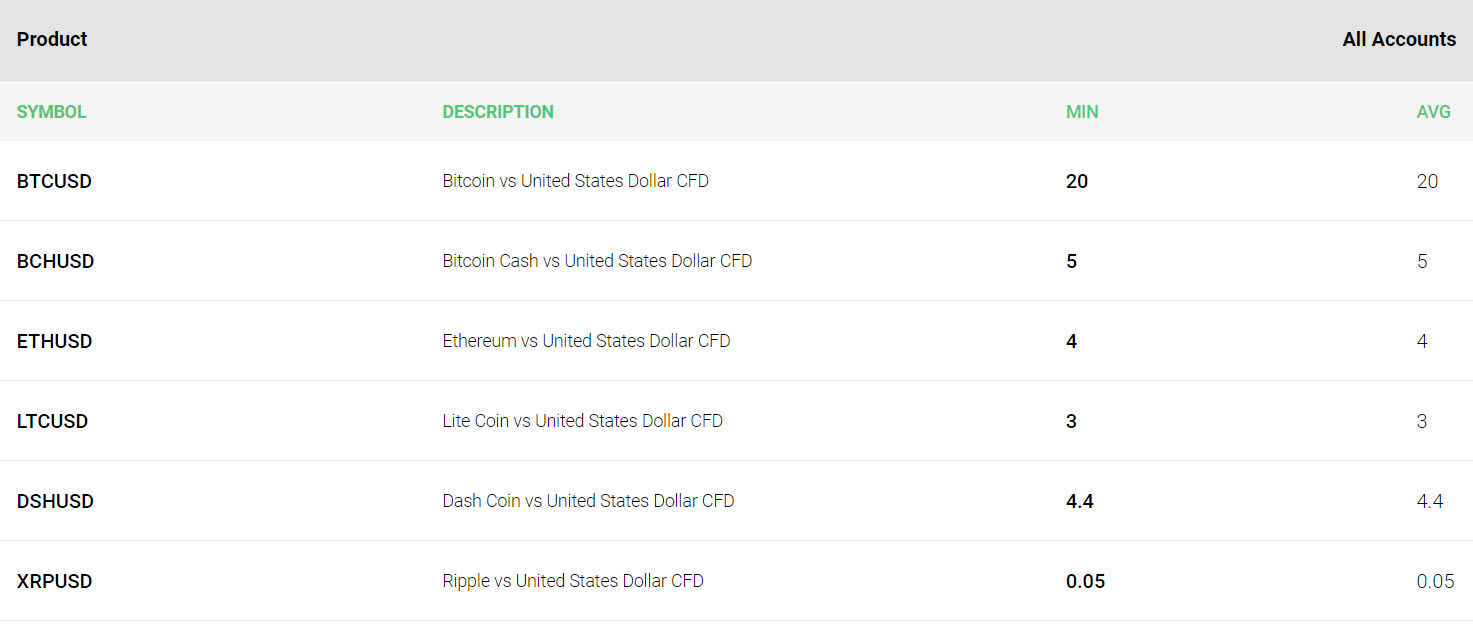
IC Markets offers 6 cryptocurrency CFDs, available to trade against the US dollar, including Bitcoin and Bitcoin cash. Below is a list of the associated ticker symbols along with minimum and average spreads:
IC Markets’ mission is clear: create a user-friendly transparent trading environment for retail and institutional clients, allowing traders to focus on what’s important: trading.
Feel free to test drive Bitcoin’s market using our award-winning MT4 or MT5 platforms. Due to its ease of use, feature rich environment and automated trading ability you won’t be disappointed!
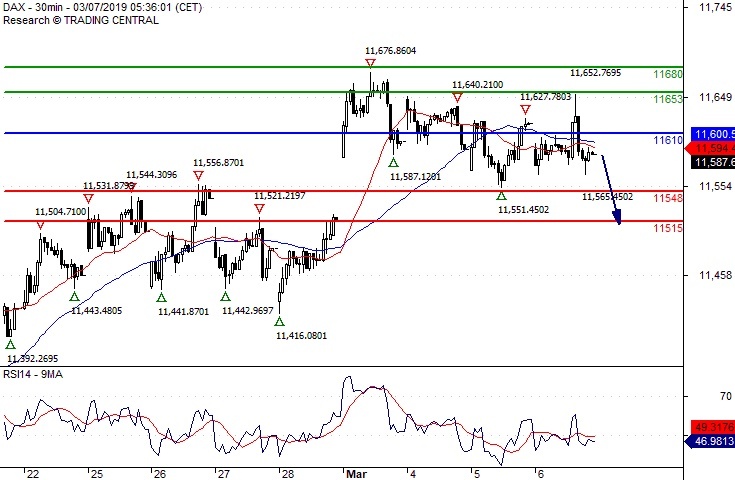
DAX Consolidation In Place
Pivot (invalidation): 11610.00
Our preference Short positions below 11610.00 with targets at 11548.00 & 11515.00 in extension.
Alternative scenario Above 11610.00 look for further upside with 11653.00 & 11680.00 as targets.
Comment As Long as the resistance at 11610.00 is not surpassed, the risk of the break below 11548.00 remains high.
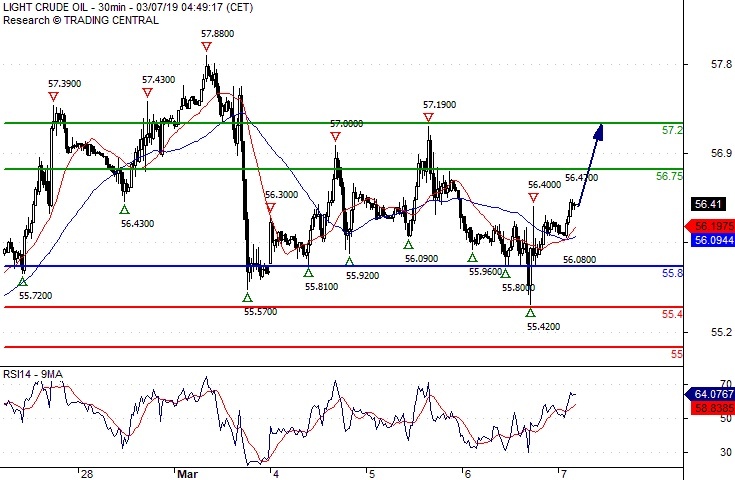
Crude Oil Turning Up
Pivot (invalidation): 55.80
Our preference Long positions above 55.80 with targets at 56.75 & 57.20 in extension.
Alternative scenario Below 55.80 look for further downside with 55.40 & 55.00 as targets.
Comment The RSI calls for a rebound.
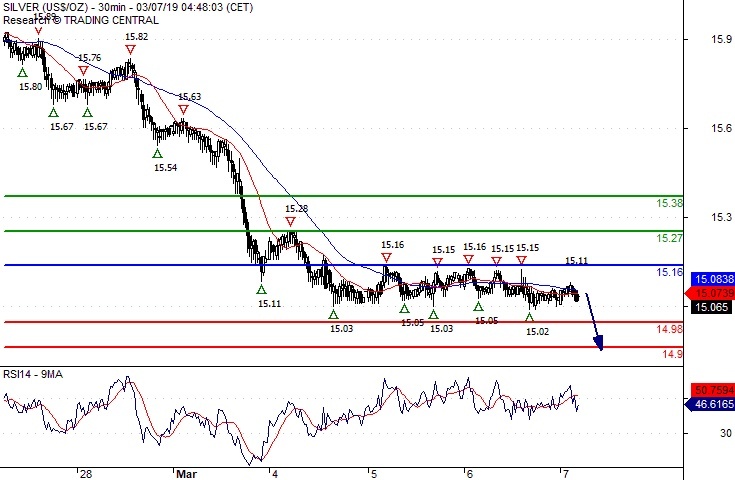
Silver Spot Consolidation
Pivot (invalidation): 15.1600
Our preference Short positions below 15.1600 with targets at 14.9800 & 14.9000 in extension.
Alternative scenario Above 15.1600 look for further upside with 15.2700 & 15.3800 as targets.
Comment The RSI lacks momentum.
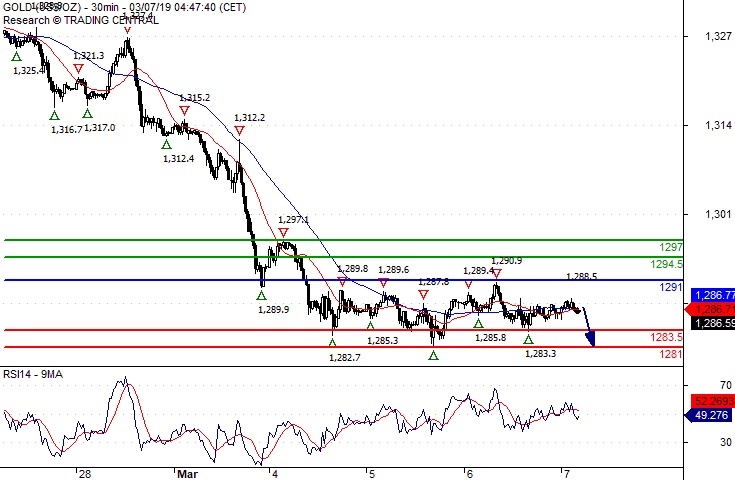
Gold Spot Consolidation
Pivot (invalidation): 1291.00
Our preference Short positions below 1291.00 with targets at 1283.50 & 1281.00 in extension.
Alternative scenario Above 1291.00 look for further upside with 1294.50 & 1297.00 as targets.
Comment As Long as 1291.00 is resistance, look for choppy price action with a bearish bias.
Sunrise Market Commentary
Markets
US and European yields were downwardly oriented yesterday. (European) investors took a cautious stance going into today's ECB policy meeting. Headlines/rumours that the ECB would downgrade its growth forecasts enough to warrant a new bank funding program initially had only a modest impact on European (and US) yields. Later yields drifted further south as (mainly US) equities fell prey to profit taking. US yields declined between 1 bp (30-y) and 2.8bp (2-y). German Bunds outperformed Treasuries with yields declining between 1.4 bp (2-y) and 4 bp (10-y).
oday, there are some second tier eco data in EMU and the US, but the focus for bond trading will be on the ECB policy decision and especially on president Draghi's press conference. At the January meeting, the ECB admitted that risks to the economy had tilted to the downside. This will also be visible in a substantial downgrade of the ECB growth forecast for 2019. However, the ECB will probably maintain the assumption that that current slowdown is temporary in nature and that growth will probably pick up in the second half of the year. In this scenario, there is no need for the ECB to already change its forward guidance on the timing of a change in its policy rates. Current guidance is open-ended as the ECB committed not to tighten policy before the end of the summer. At least for now, this guidance can be maintained. We also expect the ECB to do the groundwork for a new bank financing program (TLTRO's) even as the scope and conditions will probably only be revealed later (e.g. after a task force has explored the options). Markets are currently positioned for a first rate hike only well into 2020. The absence of a clear shift in the ECB interest rate guidance could support the tentative bottoming process in yields that started last week (but admittedly stalled this week).
Yesterday, the EUR/USD correction from earlier this week slowed. EUR/USD settled in a sideways range near 1.13. On the euro side of the equation investors were counting down to today's ECB policy meeting. On the US side of the story, data (ADP in line, big trade deficit) were not able to provide clear guidance. This morning, the dollar still shows no clear trend (USD trade-weighted near 96.85; EUR/USD near 1.1305). The yen is gaining a few ticks as Asian equities are mostly guided lower by yesterday's correction in the US. Later, the communication at the ECB press conference will likely set the tone for EUR/USD trading today and maybe even further out. In our preferred scenario of the ECB maintaining the view that current eco slowdown is mainly temporary and if the bank accordingly doesn't change its interest rate guidance in a profound way, there is room for EUR/USD to resume last week's rebound back higher in the 1.12/1.15 trading range.
Yesterday, sterling basically traded sideways. EUR/GBP hovered near the 0.86 big figure. UK and EU officials working on Brexit deal in Brussels indicated that talks went difficult. However, this time there was little (negative) impact on sterling. Today, there are few important data in the UK. So, sterling trading will probably again be driven by the news/rumours from Brussels, if any. Will sterling longs hold their nerves under control as the March12 deadline is nearing?
News Headlines
The Fed in its Beige Book preparing the March policy meeting indicated that growth slowed in some sectors at the end of January and early February due to the government shutdown. However, most districts still indicated slight-to-moderate growth. Labour market conditions were still described as being tight.
Overnight, data from Australia were mixed. The country's trade surplus jumped in January to A$ 4.55 bn from A$ 3.8bn in December. However retail sales disappointed again (0.1% M/M). The Aussie dollar (AUD/USD near 0.7045) is trading slightly off this week's low touched after poor Q4 growth published yesterday.