Sample Category Title
British Pound Extends Its Gains In The Asian Session
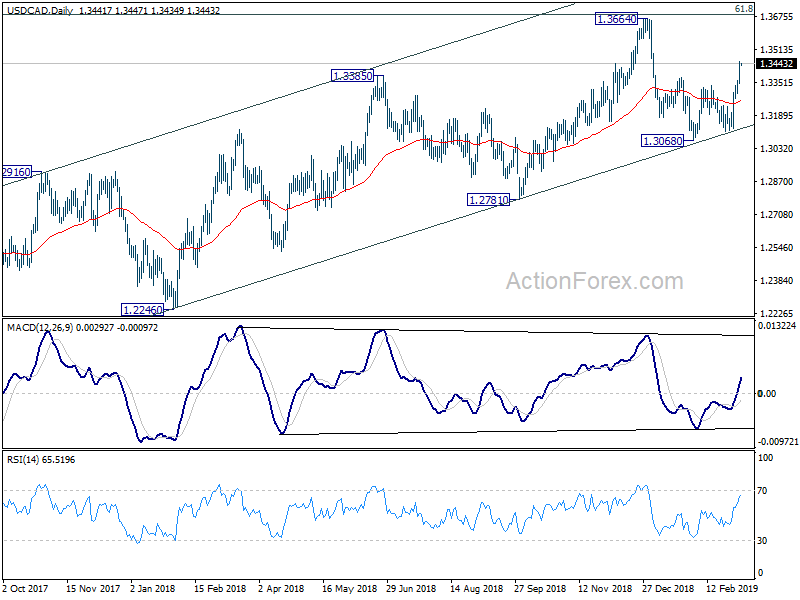
For the 24 hours to 23:00 GMT, the GBP rose 0.14% against the USD and closed at 1.3172.
Yesterday, the Paris-based think tank, OECD slashed Britain’s growth outlook to 0.8% from 1.4% in 2019, amid Brexit uncertainty and warned that a disorderly Brexit would lead the economy into recession.
In the Asian session, at GMT0400, the pair is trading at 1.3180, with the GBP trading 0.06% higher against the USD from yesterday’s close.
The pair is expected to find support at 1.3141, and a fall through could take it to the next support level of 1.3102. The pair is expected to find its first resistance at 1.3202, and a rise through could take it to the next resistance level of 1.3224.
Looking ahead, traders would await UK’s Halifax house prices for February, set to release in a few hours.
The currency pair is trading above its 20 Hr and 50 Hr moving averages.
Japan’s Leading Economic Index Declined More-Than-Estimated In January
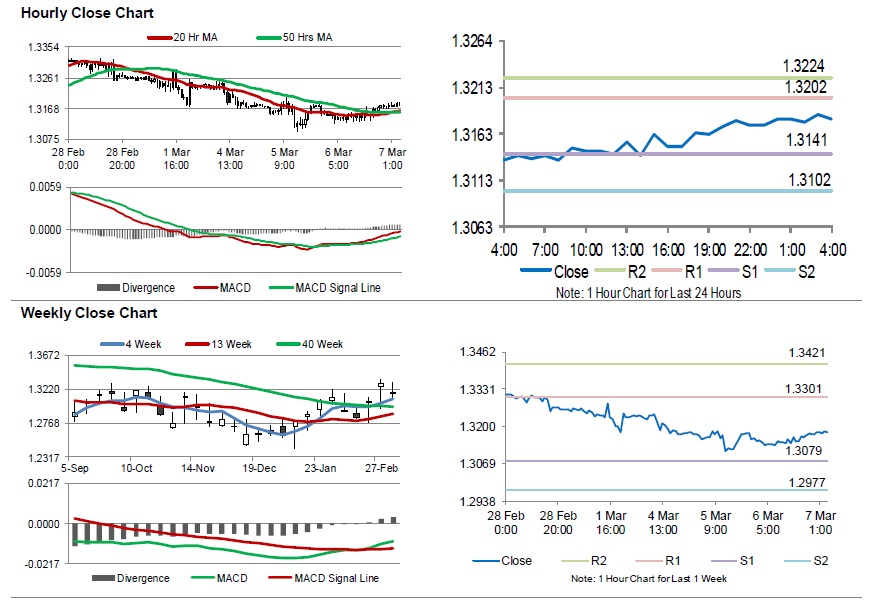
For the 24 hours to 23:00 GMT, the USD declined 0.15% against the JPY and closed at 111.71.
In the Asian session, at GMT0400, the pair is trading at 111.72, with the USD trading a tad higher against the JPY from yesterday's close.
The pair is expected to find support at 111.56, and a fall through could take it to the next support level of 111.40. The pair is expected to find its first resistance at 111.90, and a rise through could take it to the next resistance level of 112.08.
Early morning data indicate that Japan's preliminary coincident index fell to a level of 97.9 in January, compared to market anticipations for a drop to a level of 98.9. In the prior month, the index had registered a reading of 101.8. Moreover, the nation's flash leading economic index declined to a level of 95.9 in January, more than market expectations for a fall to a level of 96.1. In the preceding month, the index had registered a reading of 97.5.
Looking ahead, investors would await Japan's 4Q gross domestic product and trade balance data for January, slated to release overnight.
The currency pair is showing convergence with its 20 Hr moving average and trading below its 50 Hr moving average.
Swiss Franc Reverses Its Losses In The Asian Session
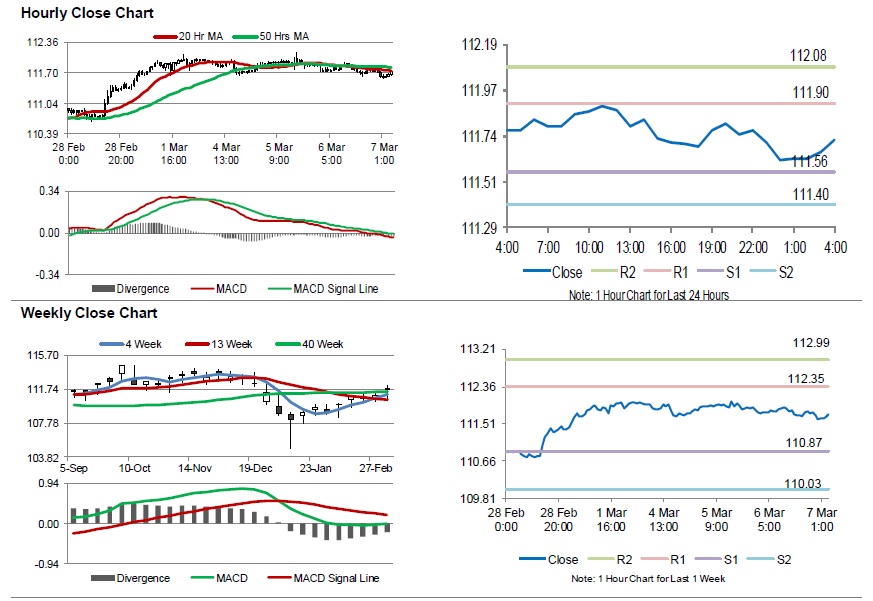
For the 24 hours to 23:00 GMT, the USD rose 0.06% against the CHF and closed at 1.0051.
In the Asian session, at GMT0400, the pair is trading at 1.0044, with the USD trading 0.07% lower against the CHF from yesterday’s close.
The pair is expected to find support at 1.0032, and a fall through could take it to the next support level of 1.0020. The pair is expected to find its first resistance at 1.0056, and a rise through could take it to the next resistance level of 1.0068.
Moving ahead, investors would closely monitor Switzerland’s unemployment rate for February, scheduled to release in a while.
The currency pair is showing convergence with its 20 Hr moving average and trading above its 50 Hr moving average.
The BoC Left Its Benchmark Interest Rates Steady At 1.75%
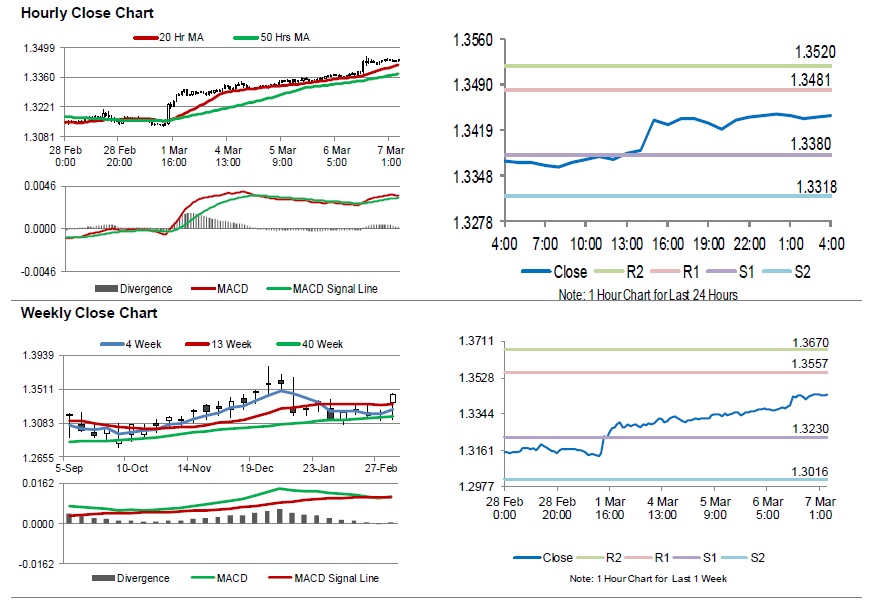
For the 24 hours to 23:00 GMT, the USD rose 0.64% against the CAD and closed at 1.3443.
The Canadian Dollar declined against the US Dollar, following the Bank of Canada’s (BoC) dovish stance on future rate hikes.
Data showed that Canada’s seasonally adjusted Ivey PMI eased to a 5-month low level of 50.6 in February, compared to a reading of 54.7 in the previous month. Additionally, the nation’s trade deficit widened to C$4.6 billion in December, compared to a deficit of C$1.98 billion in the previous month.
The BoC, in its March policy meeting, decided to leave its benchmark interest rates unchanged at 1.75%, as widely expected. The central bank expressed uncertainty about the timing of future rate hikes.
In the Asian session, at GMT0400, the pair is trading at 1.3443, with the USD trading flat against the CAD from yesterday’s close.
The pair is expected to find support at 1.3380, and a fall through could take it to the next support level of 1.3318. The pair is expected to find its first resistance at 1.3481, and a rise through could take it to the next resistance level of 1.3520.
Trading trend in the Loonie today, is expected to be determined by Canada’s building permits for January, set to release later in the day.
The currency pair is trading above its 20 Hr and 50 Hr moving averages.
Australia’s Trade Surplus Widened In January
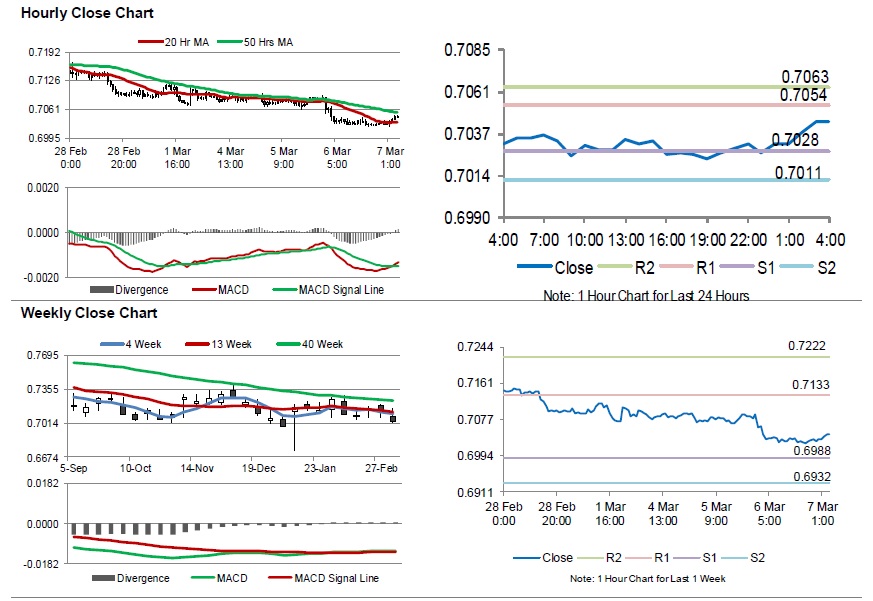
For the 24 hours to 23:00 GMT, the AUD declined 0.75% against the USD and closed at 0.7027.
LME Copper prices declined 0.7% or $48.5/MT to $6505.0/MT. Aluminium prices declined 1.2% or $22.5/MT to $1846.0/MT.
In the Asian session, at GMT0400, the pair is trading at 0.7044, with the AUD trading 0.24% higher against the USD from yesterday's close.
Overnight data revealed that Australia's AIG performance of construction index rose to a level of 43.8 in February, compared to a reading of 43.1 in the previous month. Moreover, the nation's seasonally adjusted trade surplus unexpectedly widened to A$4549.0 million in January, compared to a revised surplus of A$3769.0 million in the prior month. Market participants had expected the surplus to narrow to A$2750.0 million.
The pair is expected to find support at 0.7028, and a fall through could take it to the next support level of 0.7011. The pair is expected to find its first resistance at 0.7054, and a rise through could take it to the next resistance level of 0.7063.
Amid lack of economic releases in Australia today, traders would focus on global macroeconomic events for further direction.
The currency pair is trading between its 20 Hr and 50 Hr moving averages.
Gold: Yellow Metal Trading Flat In The Morning Session
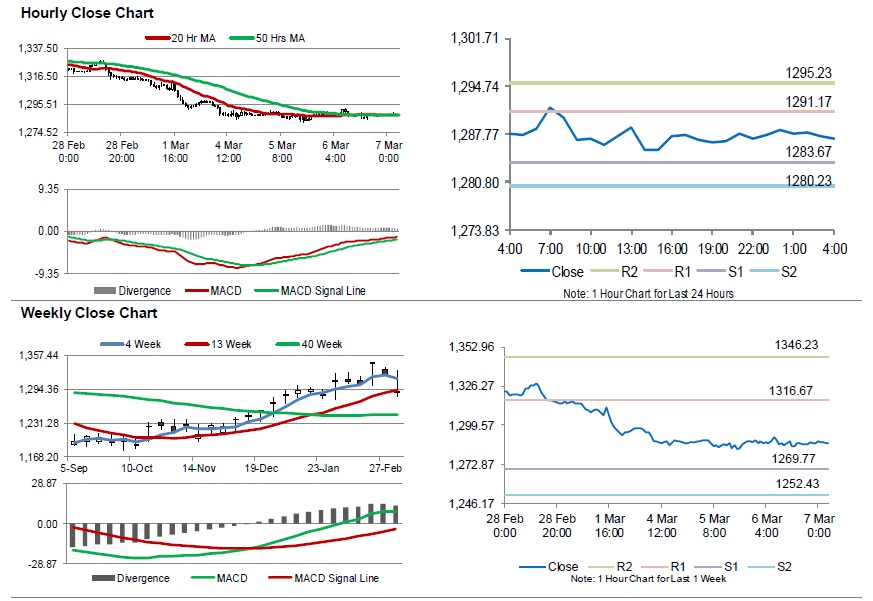
For the 24 hours to 23:00 GMT, Gold declined 0.08% against the USD and closed at USD1287.10 per ounce.
In the Asian session, at GMT0400, the pair is trading at 1287.10, with gold trading flat against the USD from yesterday’s close.
The pair is expected to find support at 1283.67, and a fall through could take it to the next support level of 1280.23. The pair is expected to find its first resistance at 1291.17, and a rise through could take it to the next resistance level of 1295.23.
The yellow metal is showing convergence with its 20 Hr and 50 Hr moving averages.
Silver: White Metal Trading On A Weaker Footing This Morning
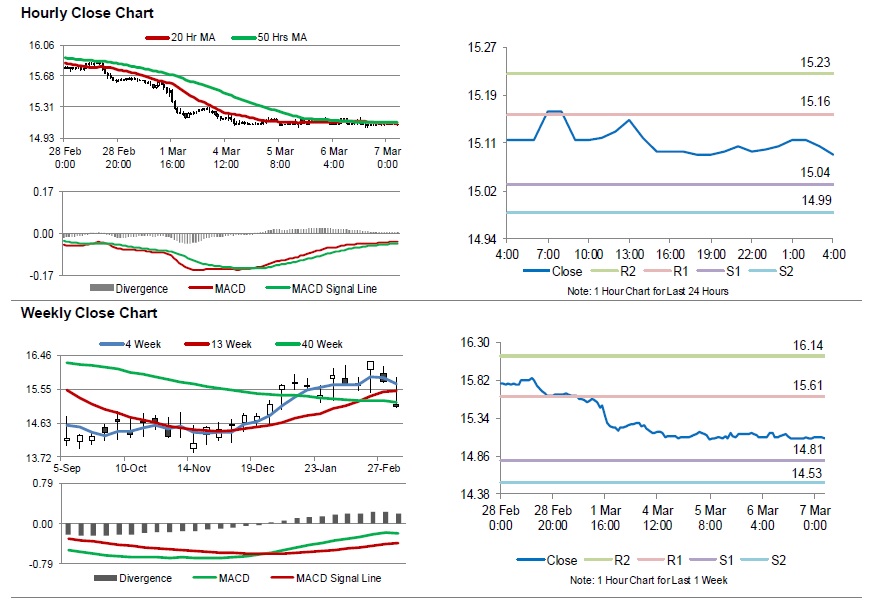
For the 24 hours to 23:00 GMT, Silver declined 0.33% against the USD and closed at USD15.10 per ounce, tracking losses in gold prices.
In the Asian session, at GMT0400, the pair is trading at 15.09, with silver trading 0.07% lower against the USD from yesterday’s close.
The pair is expected to find support at 15.04, and a fall through could take it to the next support level of 14.99. The pair is expected to find its first resistance at 15.16, and a rise through could take it to the next resistance level of 15.23.
The white metal is showing convergence with its 20 Hr and 50 Hr moving averages.
Crude Oil: Oil Trading Higher In The Asian Session
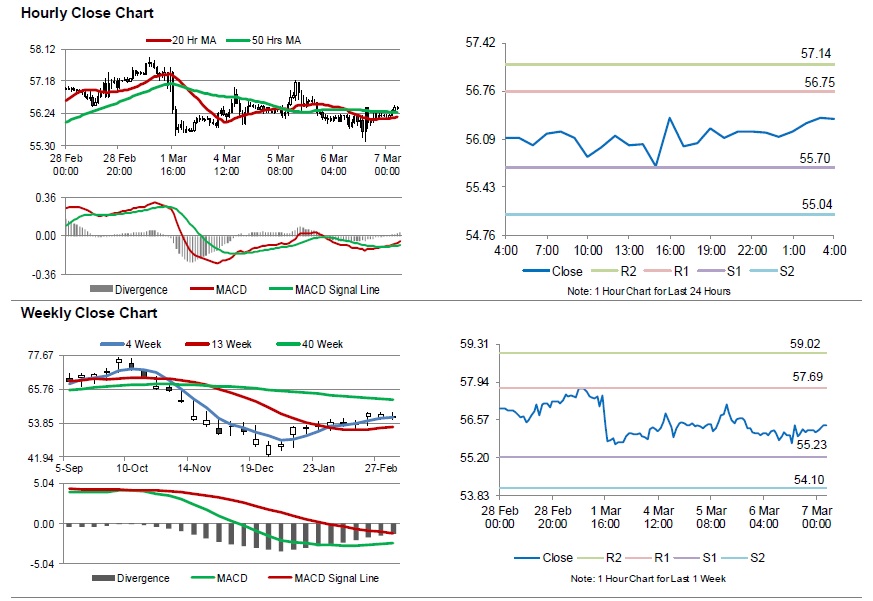
For the 24 hours to 23:00 GMT, Crude Oil declined 0.18% against the USD and closed at USD56.18 per barrel, after the Energy Information Administration (EIA) reported that US crude oil inventories climbed 7.1 million barrels to 452.9 million barrels in the week ended 01 March.
In the Asian session, at GMT0400, the pair is trading at 56.37, with oil trading 0.34% higher against the USD from yesterday’s close, amid ongoing OPEC-led supply cuts and US sanctions against Venezuela and Iran.
The pair is expected to find support at 55.70, and a fall through could take it to the next support level of 55.04. The pair is expected to find its first resistance at 56.75, and a rise through could take it to the next resistance level of 57.14.
Crude oil is trading above its 20 Hr and 50 Hr moving averages.
Elliott Wave View: DAX Structure Remains Bullish As Pullback In Progress
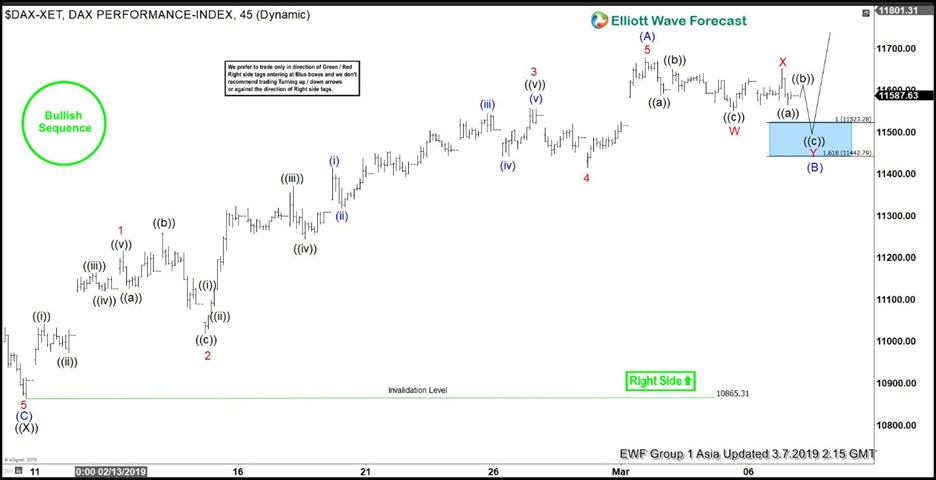
Short Term Elliott Wave view in DAX shows a bullish sequence structure from December 28, 2018 low, favoring further upside. The Index has potential to reach 100% extension towards 11912 – 12157 before ending cycle from December 2018 low. The rally from December 28, 2018 low is unfolding as a double three Elliott Wave structure where wave ((W)) ended at 11321.62 and wave ((X)) ended at 10865.31.
Wave ((Y)) rally is unfolding as a zigzag Elliott Wave structure. The first leg wave (A) of this zigzag ended at 11676.86 as 5 waves impulse. Up from 10865.31, wave 1 ended at 11217.3, wave 2 ended at 11018.95, wave 3 ended at 11556.87, wave 4 ended at 11416.08, and wave 5 of (A) ended at 11676.86. Wave (B) pullback is now in progress to correct cycle from Feb 9, 2019 low (10865.31) before Index resumes the rally higher.
Wave (B) pullback should unfold in 3, 7, or 11 swing. Down from 11676.86, wave W ended at 11551.45, and wave X ended at 11652.77. The next wave Y extreme area in 7 swing comes at 11442 – 11523 where buyers can appear for further upside or a 3 waves bounce at least. Alternatively, Index can also do a Flat correction in which case it can turn lower in 5 waves within wave C of (B) before buyers appear. As far as pivot at 10865.31 low stays intact in the pullback, expect Index to resume higher.
1 Hour DAX Elliott Wave Chart
USD/CAD Daily Outlook
Daily Pivots: (S1) 1.3316; (P) 1.3338; (R1) 1.3376; More...
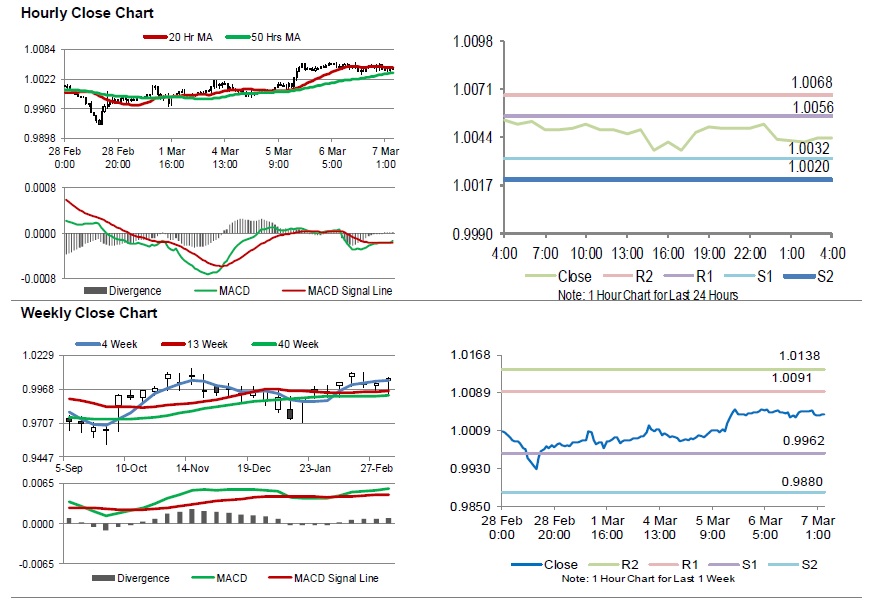
Intraday bias in USD/CAD remains on the upside for the moment. Pull back from 1.3664 should have completed at 1.3068 already. Further rise should be seen to 1.3664 and then 1.3685 fibonacci level. On the downside, break of 1.3329 minor support will dampen this view and turn bias back to the downside for 1.3112 support instead.
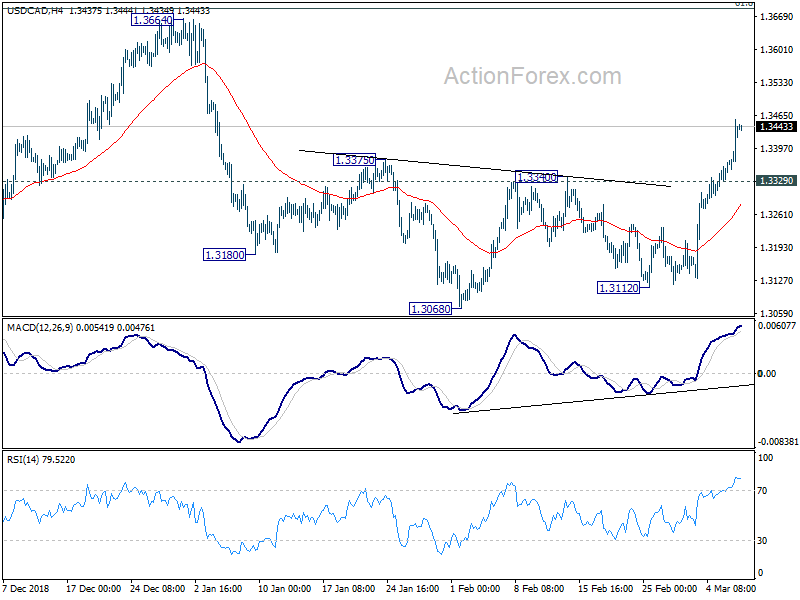
In the bigger picture, structure of the medium term rise from 1.2061 (2017 low) to 1.3664 is not clearly impulsive. Hence, we'd stay cautious on strong resistance from 61.8% retracement of 1.4689 (2016 high) to 1.2061 at 1.3685 and 1.3793 resistance to limit upside, and bring medium term topping. But in any case, medium term outlook will stay bullish as long as channel support (now at 1.3118) holds. Sustained break of 1.3793 will pave the way to retest 1.4689 (2015 high). Firm break of the channel support should confirm reversal target 1.2061 low again.