Sample Category Title
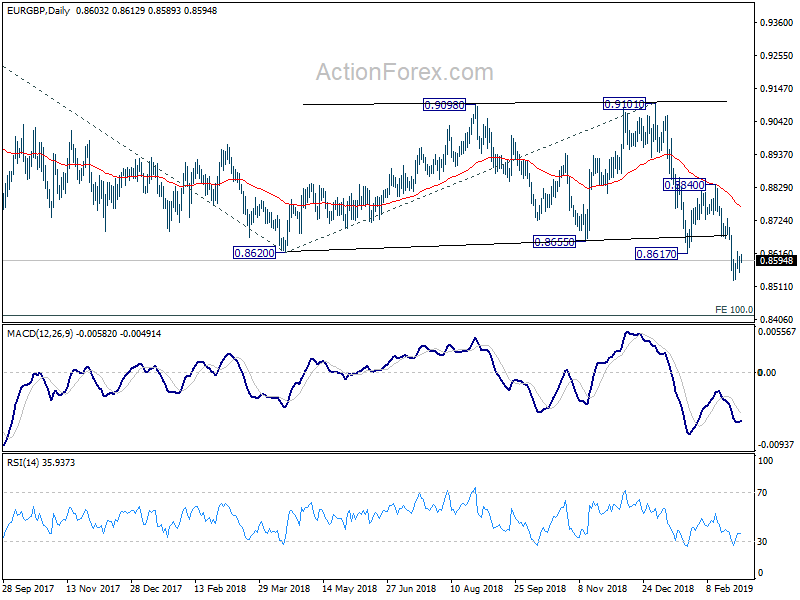
Crude Oil Supported By A Rising Trend Line
Pivot (invalidation): 56.05
Our preference Long positions above 56.05 with targets at 56.65 & 57.00 in extension.
Alternative scenario Below 56.05 look for further downside with 55.55 & 55.05 as targets.
Comment Even though a continuation of the consolidation cannot be ruled out, its extent should be limited.
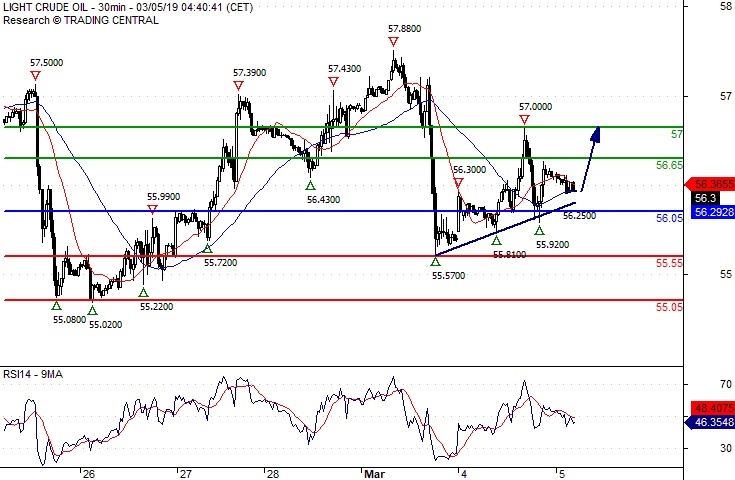
Silver Spot Key Resistance At 15.2700
Pivot (invalidation): 15.2700
Our preference Short positions below 15.2700 with targets at 15.0000 & 14.8400 in extension.
Alternative scenario Above 15.2700 look for further upside with 15.3900 & 15.5000 as targets.
Comment The RSI is mixed and calls for caution.
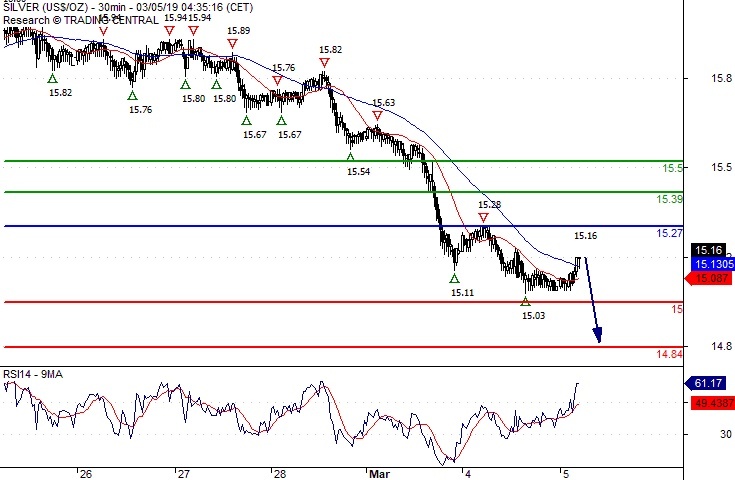
Gold Spot Key Resistance At 1292.50
Pivot (invalidation): 1292.50
Our preference Short positions below 1292.50 with targets at 1282.50 & 1276.50 in extension.
Alternative scenario Above 1292.50 look for further upside with 1297.00 & 1304.00 as targets.
Comment The RSI is mixed and calls for caution.
EUR/JPY Daily Outlook
Daily Pivots: (S1) 126.31; (P) 126.84; (R1) 127.25; More....
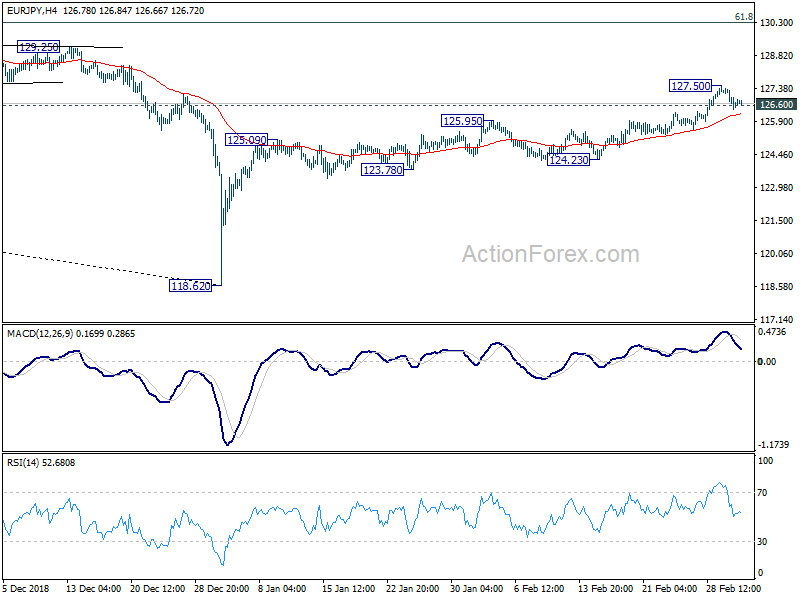
A temporary top is in place at 127.50 with current retreat. Intraday bias in EUR/JPY is turned neutral for some consolidations. In case of deeper retreat, downside should be contained by 124.23/125.95 support zone to bring rise resumption. On the upside, break of 127.50 will resume the rally from 118.62 towards 61.8% retracement of 137.49 to 118.62 at 130.28 next.
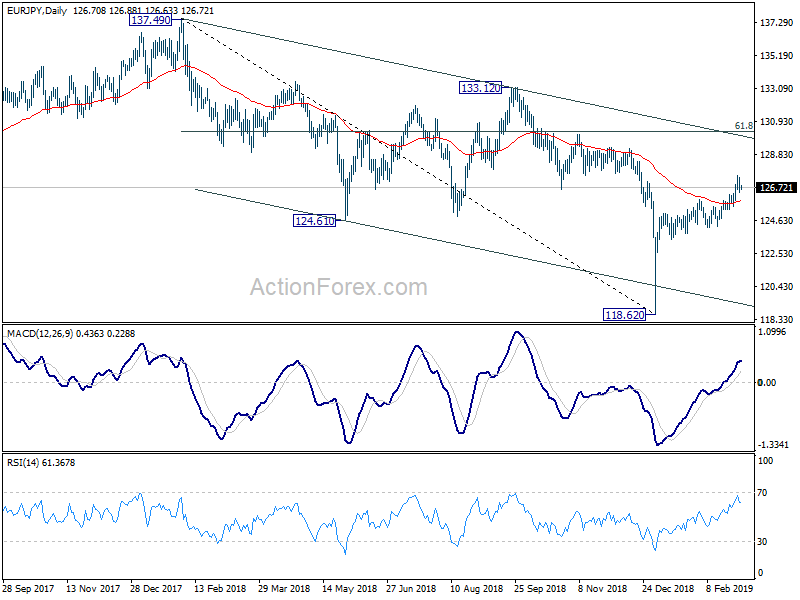
In the bigger picture, current development argues that medium term decline from 137.49 (2018 high) has completed with three waves down to 118.62 already. Decisive break of 133.12 resistance will confirm this bullish case. And whole up trend from 109.03 (2016 low) might resume through 137.49 in that case. On the downside, break of 124.23 support will invalidate this case and turn focus back to 118.62 instead.
Are Equity Bulls Running Out Of Steam?
Global equity markets have enjoyed one of the best starts to a year since 1991. The Shanghai Shenzhen CSI 300 Index gained 25% year-to-date after losing a third of its value in 2018. Most developed equity markets rose by double digits in the first two months of 2019, leading to an 11% gain on the MSCI World Index. This V-shaped recovery in equity markets was led by two key factors; central banks turning to a dovish stance, and expectations of a U.S.-China trade deal that will put an end to tariffs.
On Monday, media reports stated that the U.S. and China are in the final stages of completing a trade deal. However, U.S. stock indices tumbled instead of rising. The Dow Jones Industrial Average fell 414 points during the trading session before recovering some of the losses. The S&P 500 ended 0.4% lower after falling 1.3% midday. The reaction in U.S. equities is a classic case of "buy the rumor, sell the news". A trade agreement seems to be priced in to a large extent, but it's the details of the agreement that will either provide an extension to the bull market or put an end to it. The best-case scenario will be a deal that immediately removes tariffs from both sides and includes reforms on technology transfers and intellectual property. However, implementation of the latter part is the most complicated, and thus investors expect some tariffs to be retained.
China's Premier Li Keqiang announced today that the country was targeting an economic growth in the range of 6-6.5% in 2019, down from a target of 6.5% for 2017 and 2018. His message today wasn't optimistic, as he expects externally generated risks to remain on the rise, which is in line with the global growth downgrade announced by the IMF.
The latest data from China has shown that the services sector has continued to struggle, with the Caixin- Markit Services Purchasing Manager's Index falling to 51.1, a four-month low.
So far, bad global economic data has meant good news for equity markets, as it indicates a pause in monetary tightening and probably the beginning of a phase of easing. Weakening growth may be fine to some extent, but if signs of a global recession increase, investors will begin running through the exit doors.
The VIX Index has shown that anxiety is likely to return after surging above 16 yesterday, hitting its highest level since 15 February. So far, the 2815 resistance level on the S&P 500 has remained intact; failing to break above this week may lead to further selling pressure.
BTCUSD Below Major Support
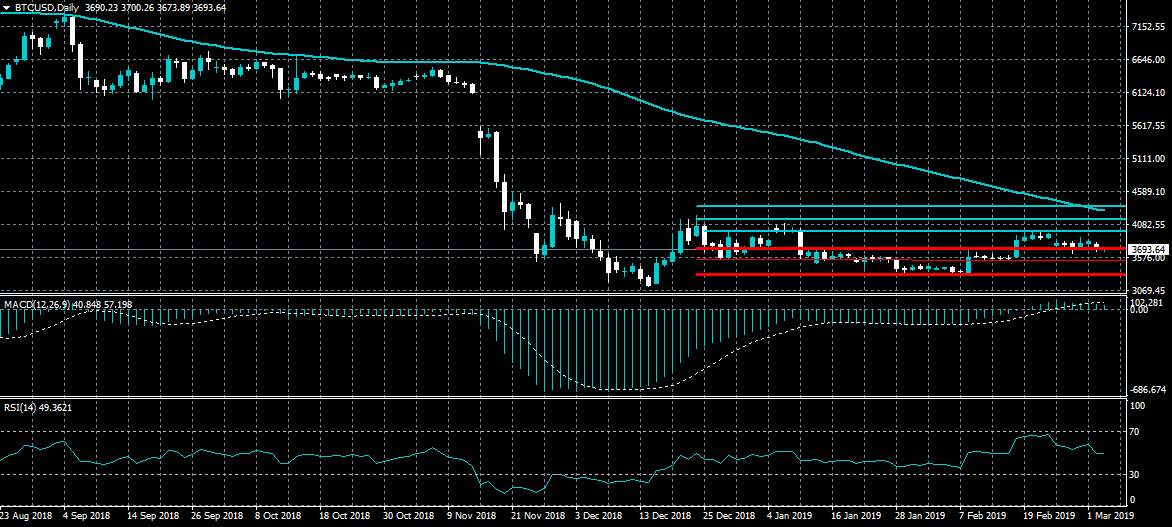
Bitcoin has fallen below the important $3,700 support level in early Tuesday trade, with the number one cryptocurrency at increasing risk of losing its short-term bullish bias. The broader cryptocurrency market is also under pressure, with a number of top digital currencies declining on light trading volumes. A sustained break below the $3,700 level should accelerate technical selling toward the $3,550 support level.
The BTCUSD pair is bearish while trading below the $3,700 level, key technical support is found at the $3,550 and $3,330 levels.
If the BTCUSD pair moves back the $3,700 level, buyers may test towards the $3,980 and $4,100 resistance levels.
GBPUSD 1.3100 Key Weekly Support
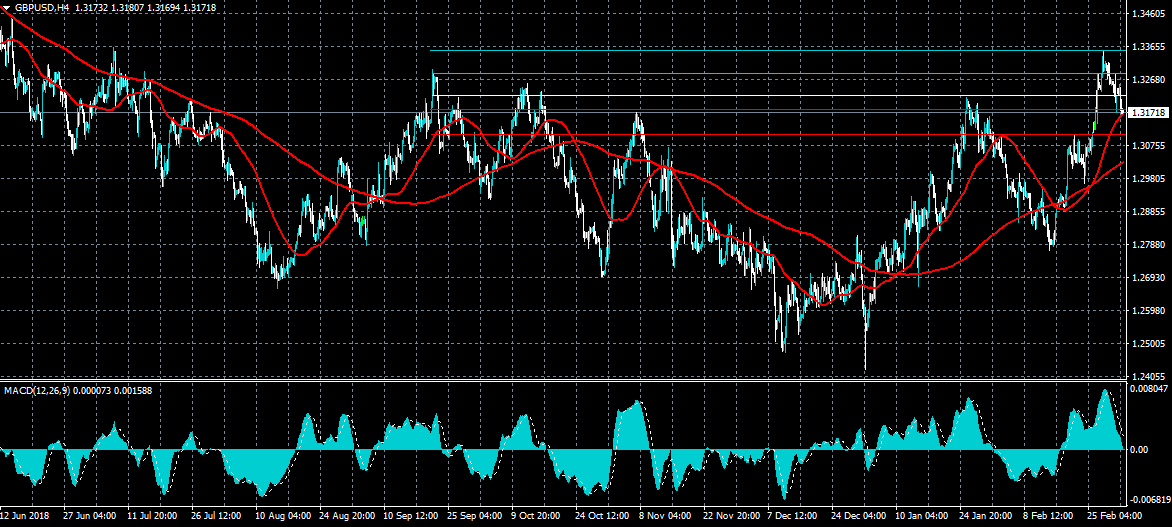
The British pound is under selling pressure against the greenback on Tuesday, with the pair now trading below the key 1.3200 support level. The GBPUSD pair is now testing minor support around the 1.3170 level, with key weekly support below, at 1.3100. Technicals indicators on the four-hour time suggest that the GBPUSD pair has further scope to trade lower in the short-term.
The GBPUSD pair is bearish while trading below the 1.3200 level, key technical support is found at the 1.3155 and 1.3100 levels
If the GBPUSD pair trades above the 1.3200 level, buyers may test towards the 1.3230 and 1.3260 resistance levels.
EURUSD Further Losses Expected
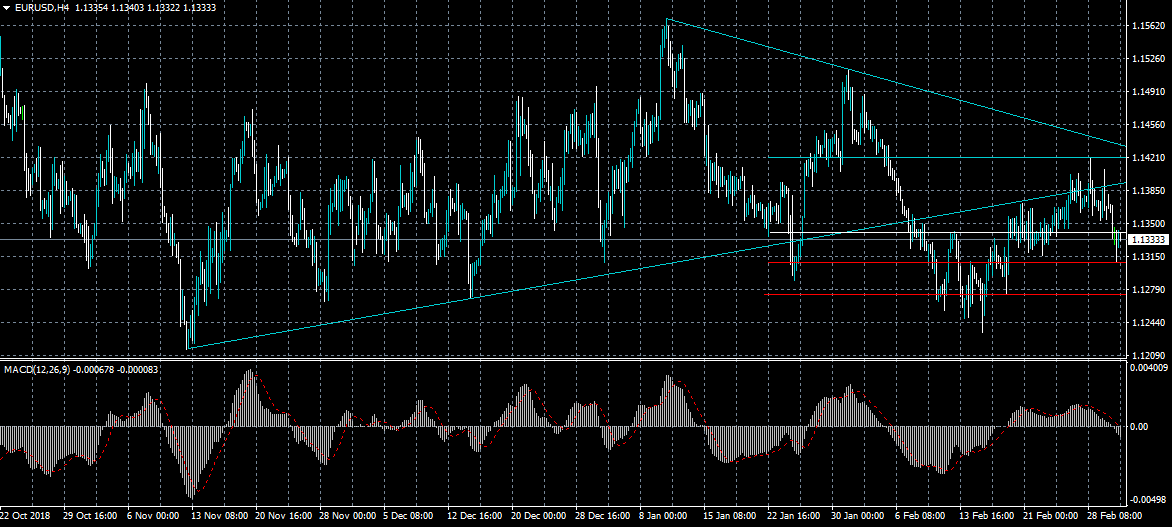
The euro remains under bearish pressure against the US dollar on Tuesday, with the pair briefly dropping towards the key 1.1300 support level. Further intraday losses are expected while the EURUSD pair trades below the 1.1337 level, which is former support now turned key resistance. Technical indicators on the four-hour time frame continue to suggest that more weakness is likely for the EURUSD pair.
The EURUSD pair is bearish while trading below the 1.1337 level, key support remains at the 1.1300 and 1.1275 levels.
If the EURUSD pair trades above the 1.1337 level, key technical resistance is found at the 1.1370 and 1.1390 levels.
Aussie Little Changed Following RBA Interest Rates Decision
After rising initially, US stocks declined sharply as traders started to worry about the trade deal between US and China. Over the weekend, reports emerged that a formal trade deal was being finalized. Word to date is that China will get tariff relief while the US will get more purchases from China. China has also pledged to initiate a legislation to prevent forced technology transfers. Investors are worried that Trump could change his mind. Another reason for the sharp decline in stocks was that investors were using an old strategy of buying on the rumors and selling on the news.
The Australian dollar was relatively unchanged after RBA made its interest rates decision. The bank left interest rates unchanged as widely expected. The bank’s last move was seen in July 2016, when rates were lowered to 1.5%, an historic low. The decision to leave rates unchanged provides support to an economy that is cooling. Just last month, the bank lowered its GDP growth forecast to 2.4%. This is after forecasting that the economy will grow by 3.2% in November last year. Tomorrow, the country will release the final reading of the GDP growth, which is expected to show some weakness. Traders expect the data to show that the economy expanded by 2.5% in the third quarter.
Traders will continue to focus on sterling as the clock ticks on Brexit. The country is expected to leave the European Union on March 29th this year. As a result, data released recently has been weaker than expected. Yesterday, the construction PMI fell to 49.5, which is a sign that activity in the sector is slowing down. Today, the retail sales monitor numbers of -0.1% were better than the expected -0.2%. The retail sector could see some more activity as people buy in preparation for the exit date. Later today, the services PMI numbers will be released. The numbers are expected to show that the PMI slowed to 49.9 from last month’s 50.
EUR/USD
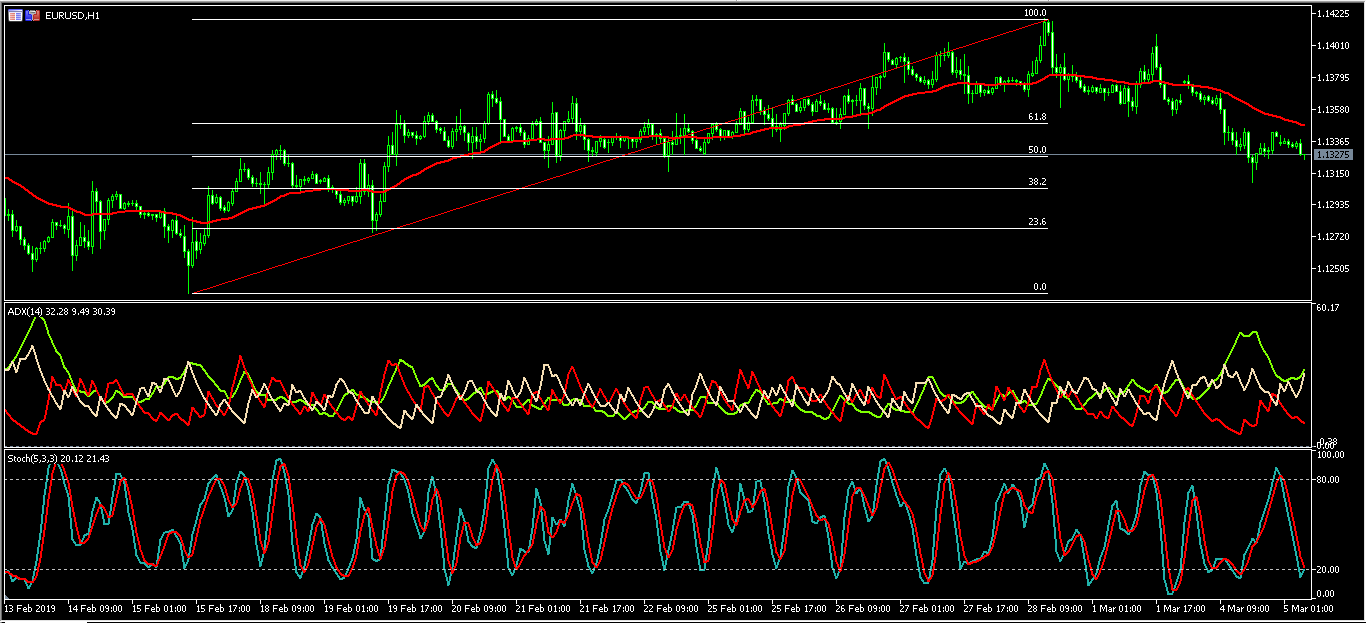
On Friday, the EUR/USD pair started to decline after reaching a high of 1.1418. Yesterday, in the European session, the pair reached the 50% Fibonacci Retracement level of 1.1326. In the overnight session, the pair continued to decline and reached the 38.2% Fibonacci Retracement level of 1.1310. The pair has gone back to the 50% Fibonacci level. On the hourly chart, the Average Directional Index (ADX) has fallen to 32 from yesterday’s high of 47. The price is below the 21-day and 42-day EMAs while the stochastics indicator has declined to the oversold level. The pair will likely continue to decline today.
GBP/USD
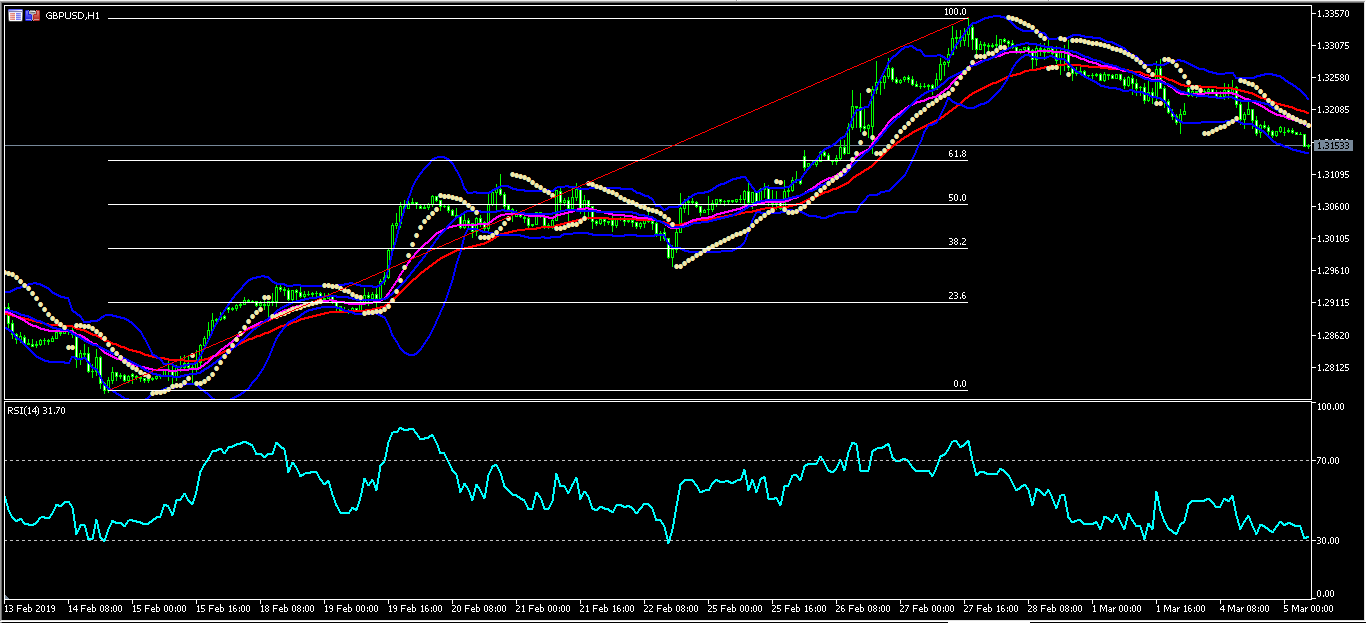
Since Friday, the GBP/USD pair has been declining. The pair has declined from the YTD high of 1.3353 and overnight, it reached a low of 1.3150. This price is slightly below the 21-day and 42-day EMAs as shown below. The price is also along the lower band of the Bollinger Bands while the RSI has moved to the oversold level of 30. The Parabolic SAR too indicates that the pair could continue moving lower. If it does, it will likely test the 1.3060 level, which is also the 50% Fibonacci Retracement level.
XAU/USD
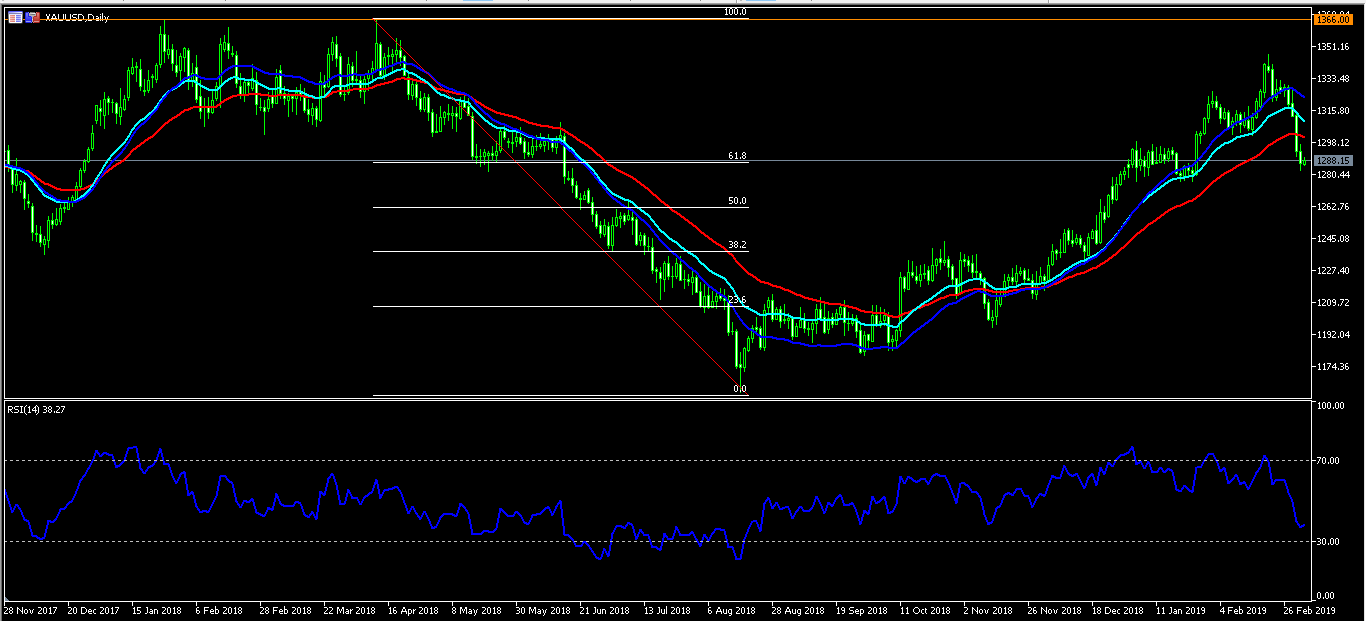
Since August last year, the price of gold has moved from a low of $1160 to a high of $1350. Since last week, the XAU/USD pair has lost momentum, with the price declining sharply. The pair has reached a low of 1280. This level is below the 21-day and 42-day EMAs. It is also sharply lower than the 50-day double EMA, while the RSI has moved to the oversold level. The pair will likely drop to the 50% Fibonacci Retracement level of 1260, and then resume the upward trend.
EUR/GBP Daily Outlook
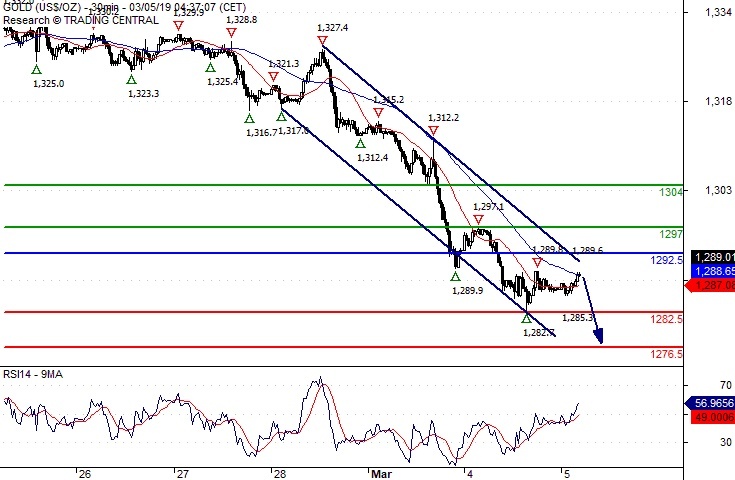
Daily Pivots: (S1) 0.8568; (P) 0.8590; (R1) 0.8624; More...
EUR/GBP is staying in consolidation above 0.8529 temporary low. Intraday bias remains neutral first. In case of further recovery, upside should be limited well below 0.8840 resistance to bring fall resumption. On the downside, break of 0.8529 will target long term projection target at 0.8416 next.
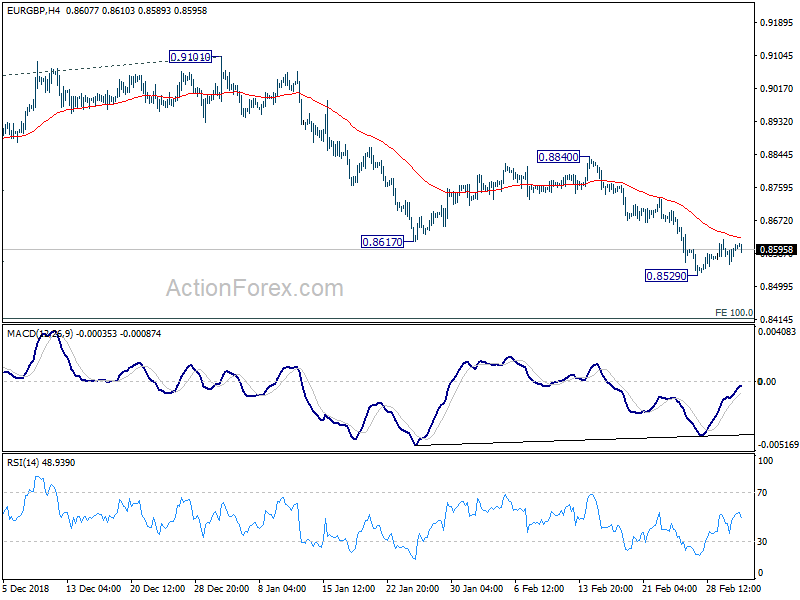
In the bigger picture, EUR/GBP is seen as staying in long term range pattern started at 0.9304 (2016 high). Current fall from 0.9305 (2017 high), is seen a a falling leg inside the pattern. Such decline is now targeting 100% projection of 0.9305 to 0.8620 from 0.9101 at 0.8416 and possibly below. But for now, we'd expect strong support around 0.8312 support to contain downside and bring rebound.