Sample Category Title
US Federal Court Rules Trump Tariffs Unconstitutional
According to media reports, the US Court of International Trade has:
- declared the tariffs imposed by President Donald Trump illegal;
- ruled that the President exceeded his authority;
- blocked the tariffs, emphasising that under the US Constitution, only Congress has the power to impose tariffs.
The decision was made unanimously by a panel of three judges. Financial markets reacted with:
- a rise in US stock indices;
- strengthening of the US dollar — most notably seen today on the USD/CHF chart, as demand for so-called safe-haven assets declined in light of the tariff reversal.
Technical Analysis of the USD/CHF Chart
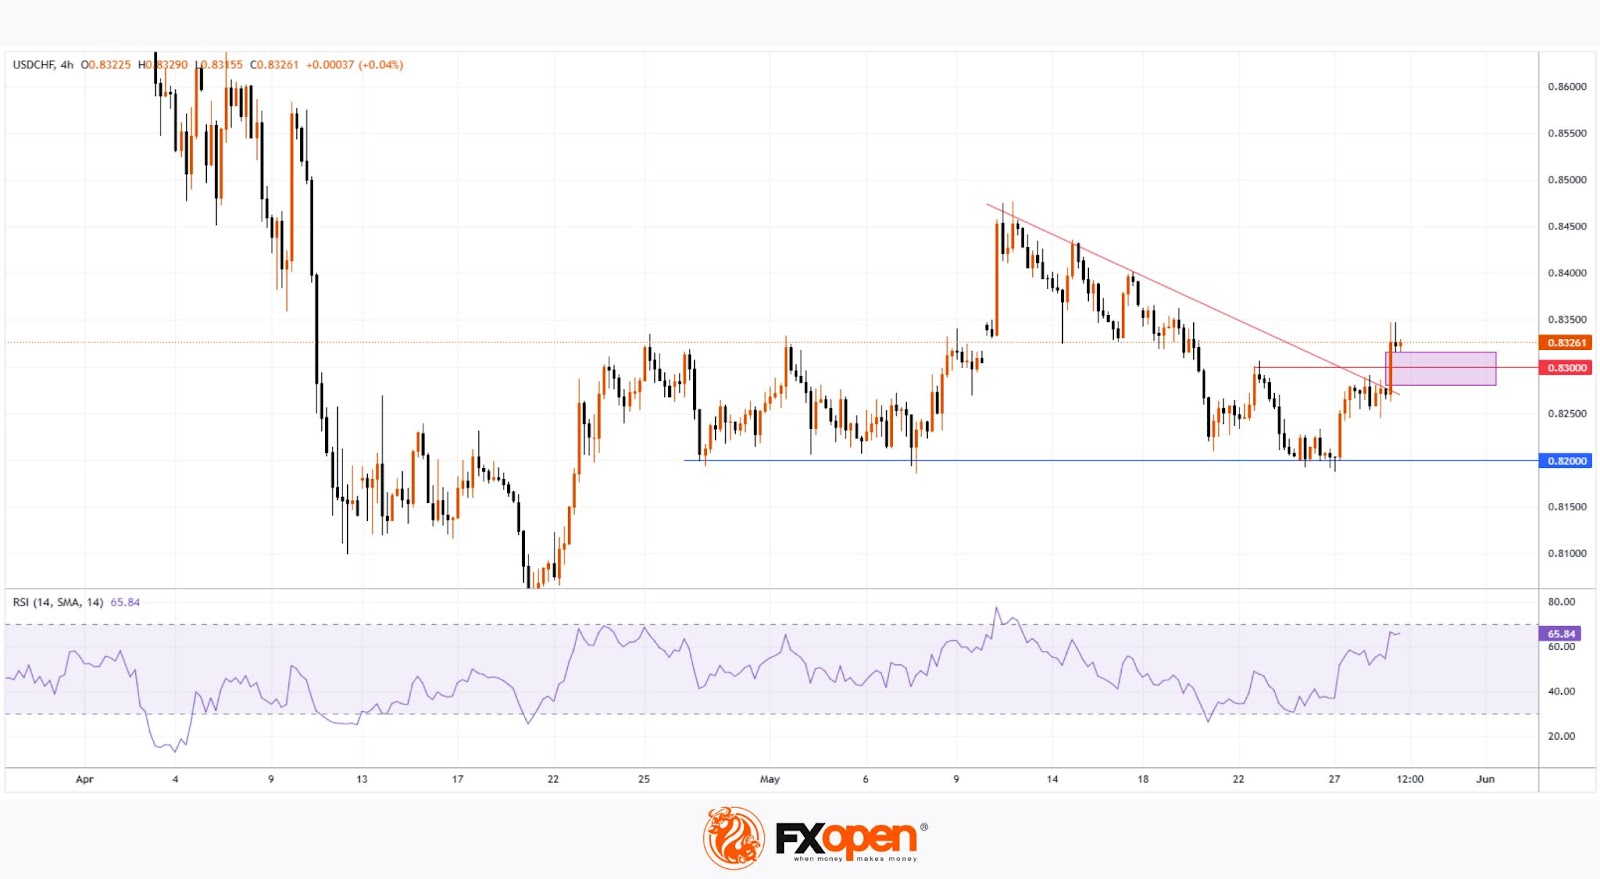
The bullish momentum has broken upward through:
- a local downward trendline (shown in red);
- resistance at the 0.8300 level, near the May 22 high.
Additionally:
- the RSI indicator on the 4-hour chart has moved upwards to the overbought territory;
- the area highlighted with a purple rectangle resembles a bullish Fair Value Gap.
Could this upward momentum lead to a sustained uptrend? There is reason for doubt.
Consider the steep decline in USD/CHF in early April (driven mainly by the introduction of Trump's tariffs) and the relatively small size of today's bullish candle compared to that prior drop.
Price action seems to suggest that market participants are skeptical about any lasting change in the situation. The Trump administration has already filed an appeal, and it’s possible the White House could succeed in defending its position.
Trade over 50 forex markets 24 hours a day with FXOpen. Take advantage of low commissions, deep liquidity, and spreads from 0.0 pips. Open your FXOpen account now or learn more about trading forex with FXOpen.
This article represents the opinion of the Companies operating under the FXOpen brand only. It is not to be construed as an offer, solicitation, or recommendation with respect to products and services provided by the Companies operating under the FXOpen brand, nor is it to be considered financial advice.
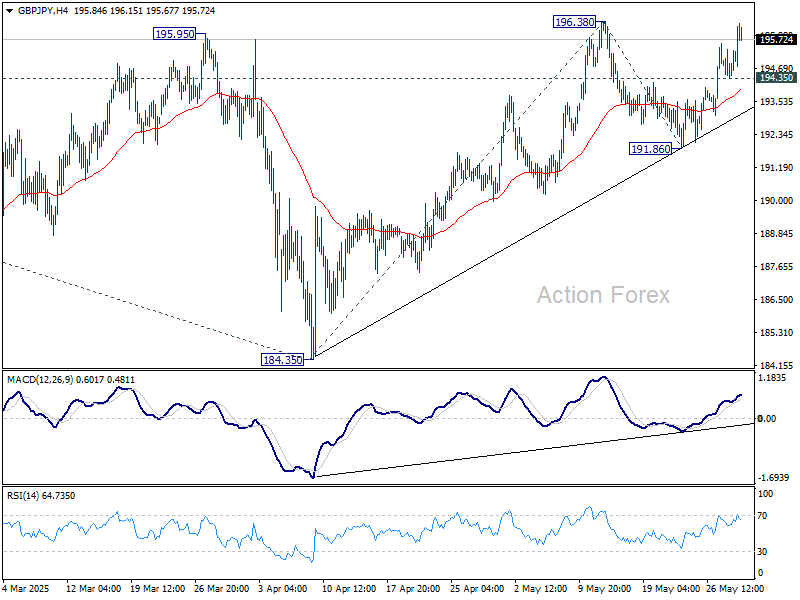
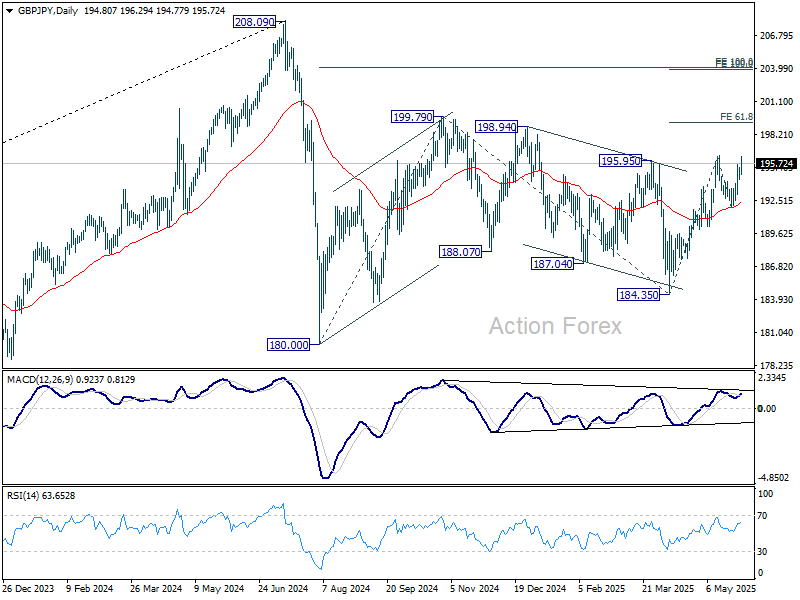
GBP/JPY Daily Outlook
Daily Pivots: (S1) 194.55; (P) 194.97; (R1) 195.56; More...
Intraday bias in GBP/JPY stays on the upside for the moment. Firm break of 196.38 resistance will resume whole rally from 184.35 and target 61.8% projection of 184.35 to 196.38 from 191.86 at 199.29 next. On the downside, below 194.35 minor support will turn intraday bias neutral first. But near term outlook will stay bullish as long as 191.86 support holds, in case of retreat.
In the bigger picture, price actions from 208.09 are seen as a correction to rally from 123.94 (2020 low). Strong support should be seen from 38.2% retracement of 123.94 to 208.09 at 175.94 to contain downside. However, sustained break of 175.94 will bring deeper fall even still as a correction.
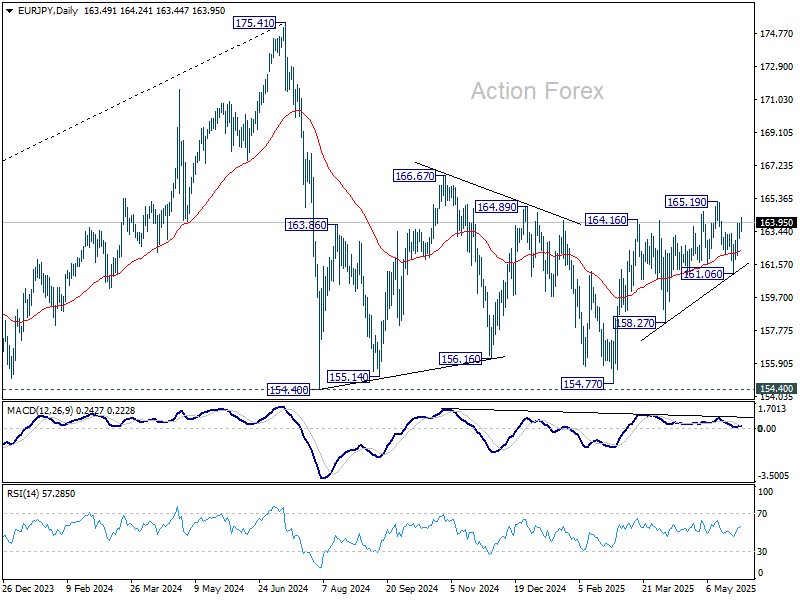
EUR/JPY Daily Outlook
Daily Pivots: (S1) 163.13; (P) 163.52; (R1) 163.96; More...
Intraday bias in EUR/JPY remains on the upside for retesting 165.19 resistance. Firm break there will resume while rise from 154.77 to 166.67 resistance. On the downside, below 163.05 minor support will turn intraday bias neutral first.
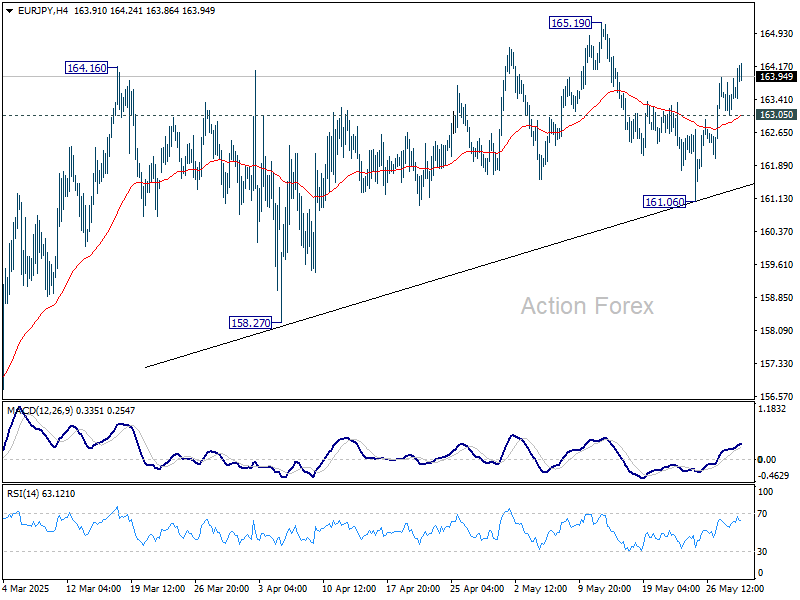
In the bigger picture, price actions from 175.41 are seen as correction to rally from 114.42 (2020 low). Strong support should be seen from 38.2% retracement of 114.42 to 175.41 at 152.11 to contain downside. However, sustained break of 152.11 will bring deeper fall even still as a correction.
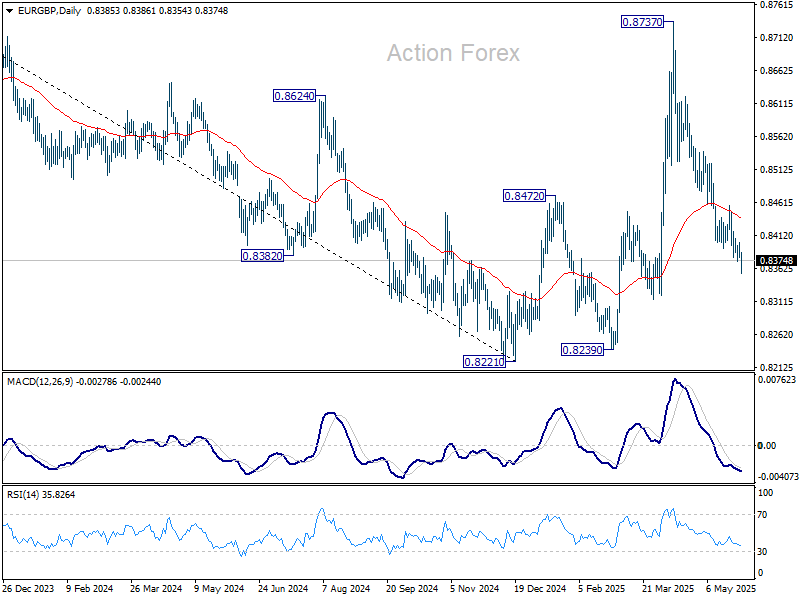
EUR/GBP Daily Outlook
Daily Pivots: (S1) 0.8375; (P) 0.8389; (R1) 0.8396; More...
Intraday bias in EUR/GBP remains on the downside, and fall from 0.8737 is in progress for 0.8314 support. Break there will bring retest of 0.8239 low. On the upside, above 0.8400 minor resistance will turn intraday bias neutral first. But outlook will stay bearish as long as 0.8458 resistance holds.
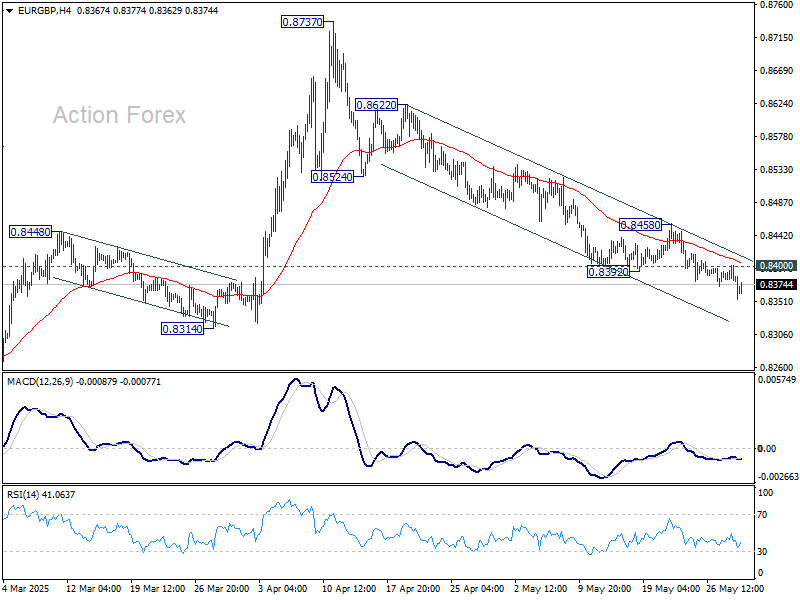
In the bigger picture, current development suggests that price actions from 0.8221 medium term bottom are merely forming a corrective pattern. However, there is no clear momentum to break through 0.8201 key support (2022 low) yet. Hence, range trading is expected between 0.8221/8737 for now.
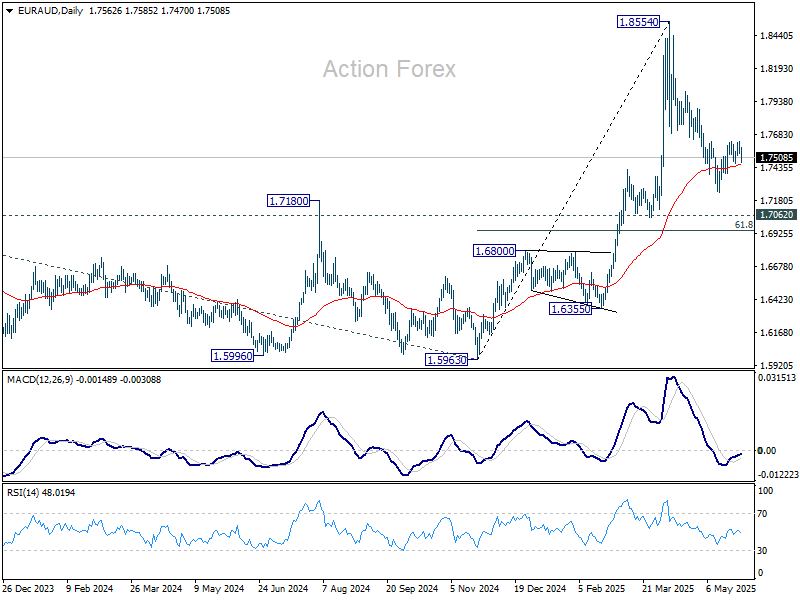
EUR/AUD Daily Outlook
Daily Pivots: (S1) 1.7531; (P) 1.7584; (R1) 1.7624; More...
Intraday bias in EUR/AUD remains neutral for the moment. On the upside, firm break of 1.7628 resistance will suggest that fall from 1.8554 as completed as a correction, and retain larger bullishness. Intraday bias will be back on the upside for stronger rebound. However, below 1.7245 will resume the fall to 61.8% retracement of 1.5963 to 1.8554 at 1.6953.
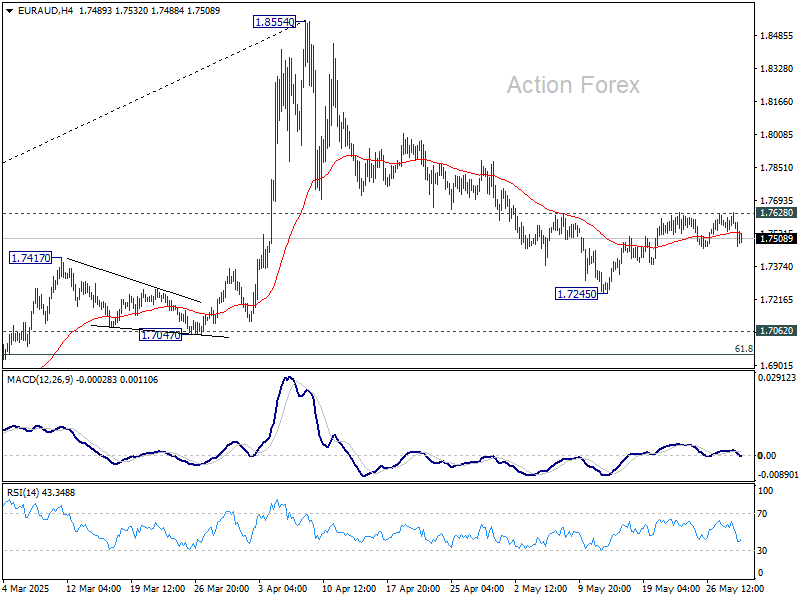
In the bigger picture, as long as 1.7062 resistance turned support (2023 high) holds, up trend from 1.4281 (2022 low) should still be in progress. Break of 1.8554 will target 100% projection of 1.4281 to 1.7062 from 1.5963 at 1.8744. However, sustained break of 1.7062 will confirm medium term topping and bring deeper fall back to 1.5963 support.
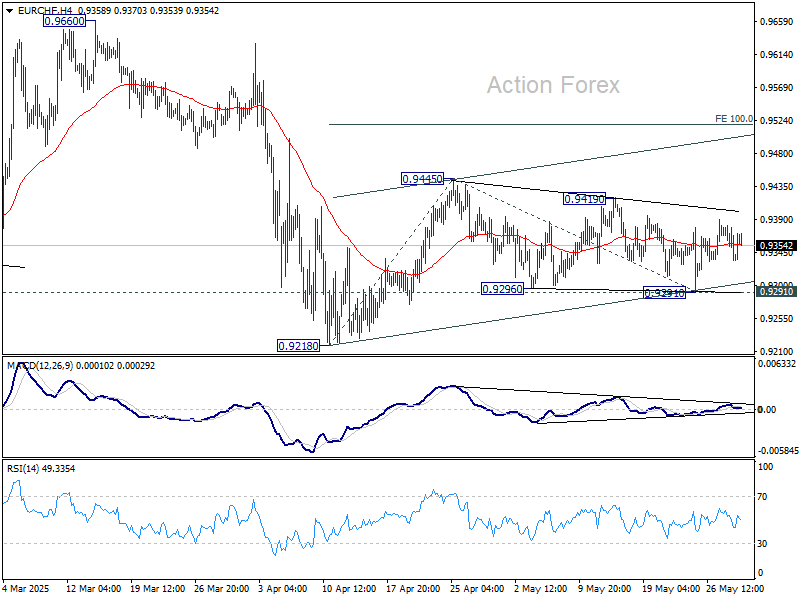
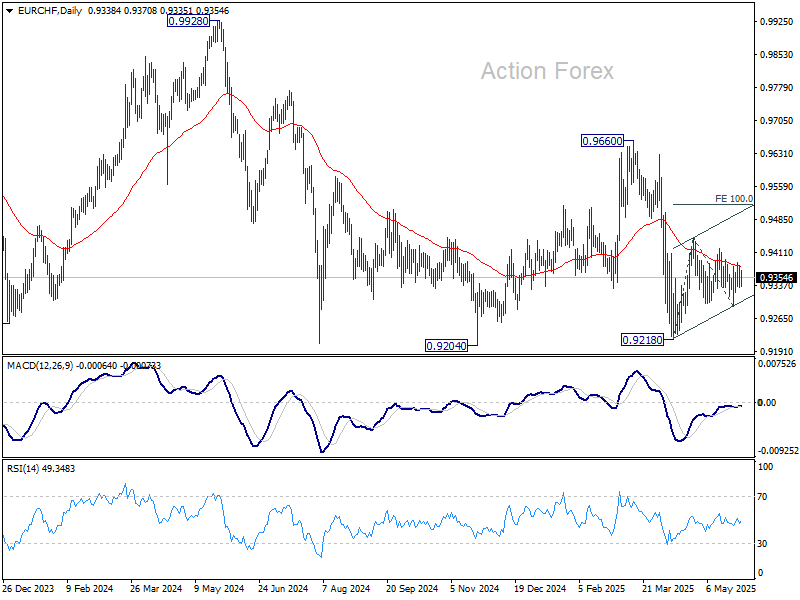
EUR/CHF Daily Outlook
Daily Pivots: (S1) 0.9319; (P) 0.9358; (R1) 0.9379; More....
Sideway trading continues in EUR/CHF and intraday bias remains neutral first. Price actions from 0.9218 are seen as either a corrective move or the third leg of the pattern from 0.9204. On the upside, break of 0.9419 will resume the rise from 0.9218 through 0.9445 resistance. However, firm break of 0.9291 support will bring retest of 0.9218 low.
In the bigger picture, prior rejection by long-term falling channel resistance (now at 0.9548) retains medium term bearishness. That is, down trend from 1.2004 (2018 high) is still in progress. Firm break of 0.9204 (2024 low) will confirm resumption. This will remain the favored case as long as 0.9660 resistance holds.
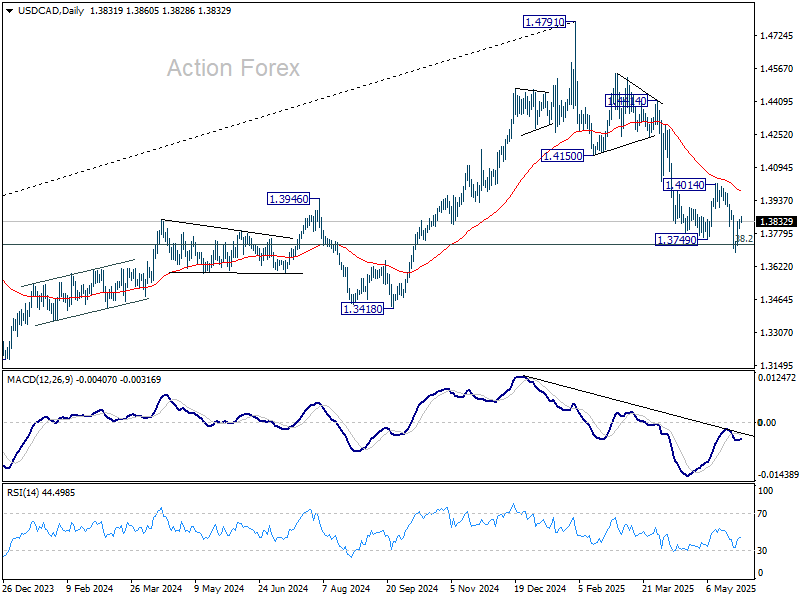
USD/CAD Daily Outlook
Daily Pivots: (S1) 1.3812; (P) 1.3828; (R1) 1.3855; More...
Intraday bias in USD/CAD remains neutral and more consolidations could be seen above 1.3685. Upside should be limited well below 1.4014 resistance to bring another fall. Break of 1.3685 will resume whole decline from 1.4791.
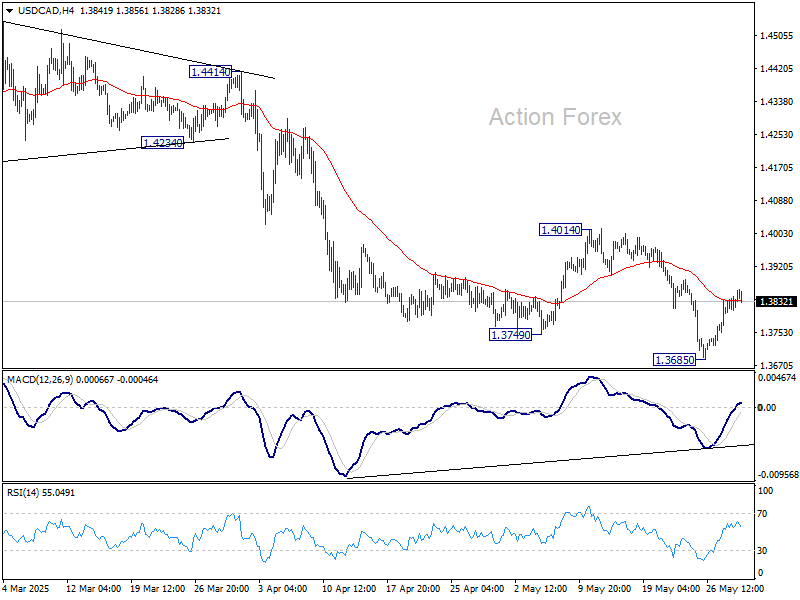
In the bigger picture, price actions from 1.4791 medium term top could either be a correction to rise from 1.2005 (2021 low), or trend reversal. In either case, further decline is expected as long as 1.4014 resistance holds. Firm break of 38.2% retracement of 1.2005 (2021 low) to 1.4791 at 1.3727 will pave the way back to 61.8% retracement at 1.3069.
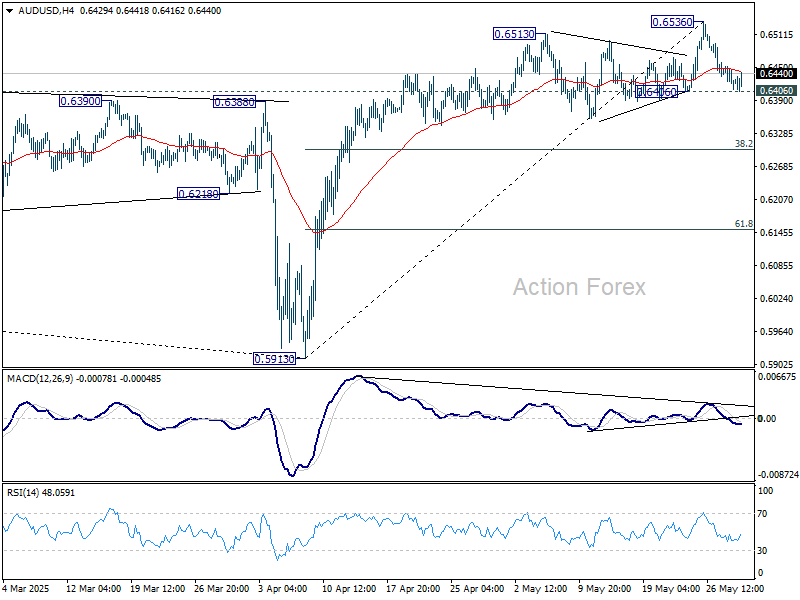
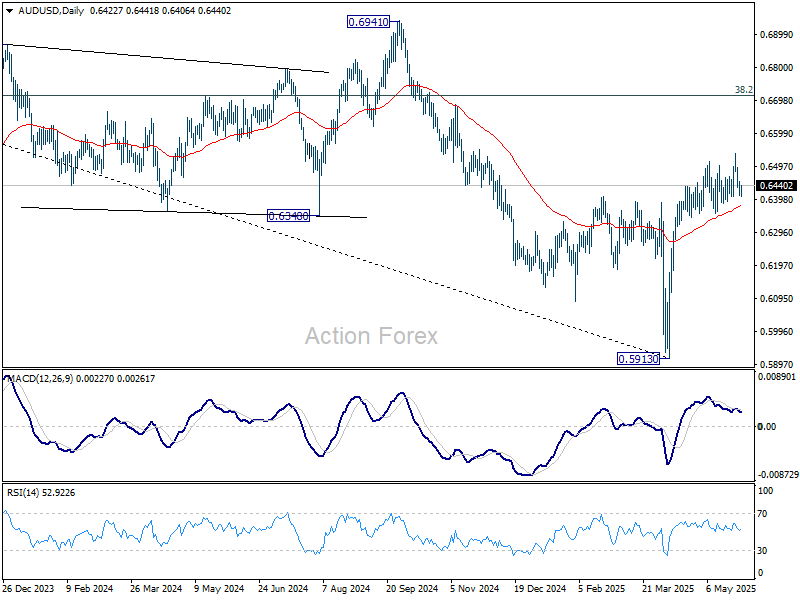
AUD/USD Daily Report
Daily Pivots: (S1) 0.6407; (P) 0.6430; (R1) 0.6451; More...
AUD/USD is holding above 0.6406 support and intraday bias remains neutral. Further rally remains in favor. Break of 0.6536 will resume whole rally from 0.5913. However, firm break of 0.6406 will confirm short term topping, and turn bias back to the downside for 38.2% retracement of 0.5913 to 0.6536 at 0.6298.
In the bigger picture, 55 W EMA (now at 0.6439) is considered taken out. A medium term bottom should already be in place at 0.5913. Rise from there could either be a corrective move, or reversing whole down trend from 0.8006 (2021 high). In either case, further rise is now expected as long as 55 D EMA (now at 0.6376) holds. Next target is 38.2% retracement of 0.8006 to 0.5913 at 0.6713.
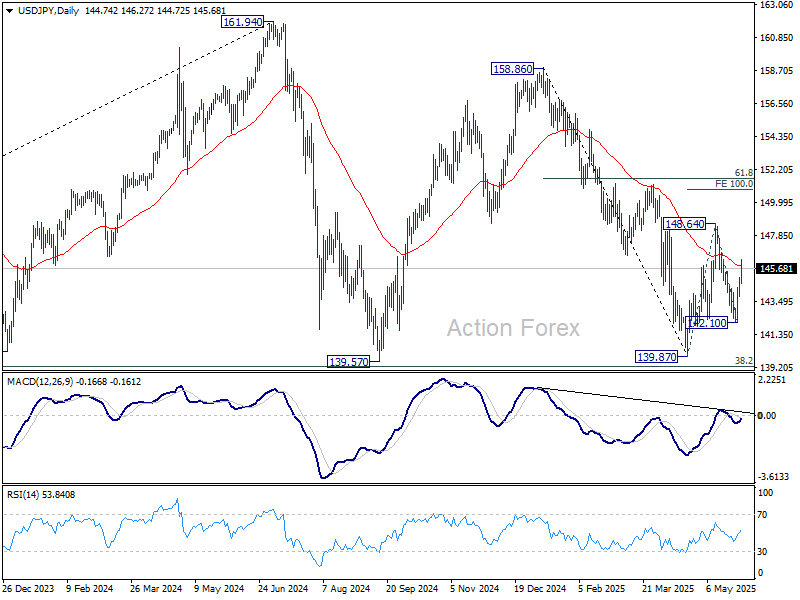
USD/JPY Daily Outlook
Daily Pivots: (S1) 144.12; (P) 144.60; (R1) 145.35; More...
Intraday bias in USD/JPY remains on the upside for the moment. Rise from 142.10 is in progress for 148.64 resistance first. Firm break there will resume the rebound from 139.87 to 100% projection of 139.87 to 148.64 from 142.10 at 150.87. On the downside, below 144.72 minor support will turn intraday bias neutral first.
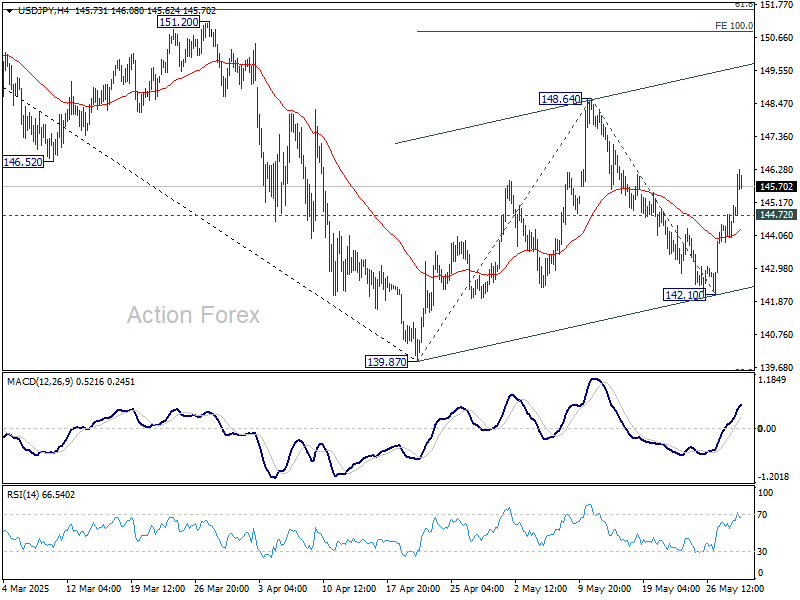
In the bigger picture, price actions from 161.94 are seen as a corrective pattern to rise from 102.58 (2021 low), with fall from 158.86 as the third leg. Strong support should be seen from 38.2% retracement of 102.58 to 161.94 at 139.26 to bring rebound. However, sustained break of 139.26 would open up deeper medium term decline to 61.8% retracement at 125.25.
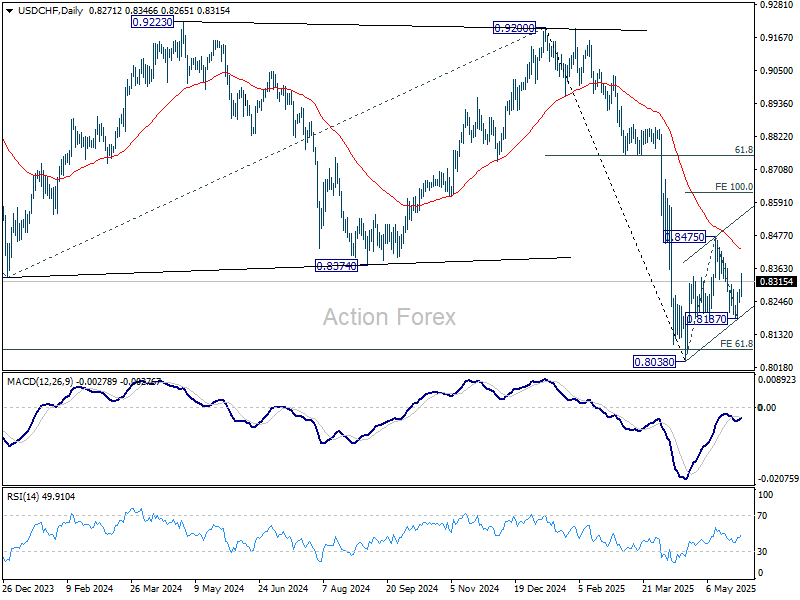
USD/CHF Daily Outlook
Daily Pivots: (S1) 0.8247; (P) 0.8269; (R1) 0.8293; More….
USD/CHF's break of 0.8305 minor resistance suggests that pull back from 0.8475 has already completed at 0.8187. Corrective pattern from 0.8038 is now in another rising leg. Intraday bias is back on the upside for 0.8475 resistance first. Firm break there will target 100% projection of 0.8038 to 0.8475 from 0.8187 at 0.8624. For now, risk will stay on the upside as long as 0.8187 holds, in case of retreat.
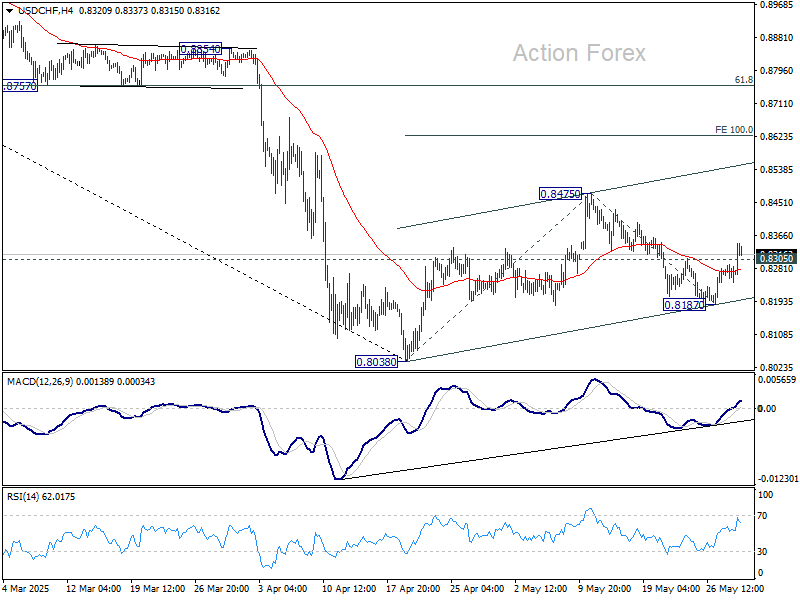
In the bigger picture, long term down trend from 1.0342 (2017 high) is still in progress and met 61.8% projection of 1.0146 (2022 high) to 0.8332 from 0.9200 at 0.8079 already. In any case, outlook will stay bearish as long as 55 W EMA (now at 0.8713) holds. Sustained break of 0.8079 will target 100% projection at 0.7382.