
Sample Category Title
Tariff Saga Act Three: Legal Worries
What began as early trade optimism yesterday – triggered by the US Court of International Trade deeming Trump’s tariffs illegal – turned out to be too good to be true. Things quickly got messy when Trump appealed the decision, prompting the US Court of Appeals to pause the ruling in order to review arguments from both sides. Meanwhile, a separate federal court issued a similar but more limited decision on the tariffs. As a result, the initial ruling that had cancelled the tariffs is now effectively on hold.
As such, uncertainty has surged – no one is quite sure what’s legal and what’s not anymore. Some reports suggest the Trump administration could still find legal grounds to uphold its tariff policies. One of the most cited tools is Section 232 of the Trade Expansion Act of 1962, which allows for industry-specific tariffs on cars, steel, and aluminium on national security grounds. Other potential avenues include Section 301, which deals with unfair trade practices, and Section 122, apparently designed to manage trade deficits and defend the US dollar. In short, there are a lot of legal levers in the air – and most of us aren’t lawyers.
But you don’t need to be a lawyer to smell the thick uncertainty about what the US government might do next – and how trade partners will respond. If tariffs are ultimately found to be unlawful, the willingness of partners to make concessions during trade talks may shrink – not exactly ideal, especially given the critical window for negotiations. And whether there’ll be legal clarity ahead of the June 9th deadline for European trade negotiations – which could end with 50% tariffs, or not – is anyone’s guess.
So it’s under this heavy cloud of uncertainty that the early risk-on rally yesterday fizzled out. The S&P500 rapidly erased its earlier gains, though it still managed to close up around 0.40%. The Nasdaq held on to 0.21%, after earlier surging 2%, thanks in part to Nvidia, which ended the day over 3% higher and just below the $140/share mark.
Beyond better-than-expected earnings and forecasts that confirmed robust AI demand was enough to offset Chinese weakness, Nvidia also got a boost from a US Department of Energy announcement: the company, alongside Dell, has been awarded a contract to build a new flagship supercomputer for the National Energy Research Scientific Computing Center. Dell rose roughly 2% in after-hours trading and looks poised to break out of its one-year descending trend channel.
Elsewhere, the Dow Jones was little changed. Chinese and Japanese stocks gave back some of their recent gains, and both US and European futures are pointing slightly lower this morning. It’s not chaotic – but it’s far from ideal.
In the FX
Ongoing uncertainty around US fiscal and trade policy continues to weigh on the US dollar. Meanwhile, the economic impact of aggressive Trump policies – both on trade and government offices – is starting to show in the data. Figures released yesterday confirmed a contraction in US GDP in Q1, with spending growth more than halving and the trade deficit ballooning as firms rushed to import goods ahead of possible tariffs. Inventories rose. A key price gauge showed a sharp reversal in inflation pressures.
Donald Trump reportedly met with Federal Reserve (Fed) Chair Jerome Powell to press for rate cuts. The US 2-year yield dipped below 4% as markets ramped up dovish bets. But the man is unlikely to give Trump the rate support he wants while trade uncertainty and inflation pressures mount. Most US companies have already said they’ll pass tariff costs onto consumers. Their international counterparts say they’ll do the same. Add in rising shipping costs driven by trade flow disruptions, and the conclusion is clear: prices will rise. Whether that spike is temporary remains to be seen – but either way, it complicates the Fed’s job.
Today’s PCE data – the Fed’s preferred inflation gauge – could surprise to the downside or meet expectations, but the full effects of the ‘tariff tsunami’ likely haven’t reached shore yet. The data will need to be taken with a pinch of salt.
In Europe, the inflation outlook is heading in the opposite direction. The tariffs won’t affect European consumers, and the euro’s recent appreciation is helping lower energy and commodity costs. April inflation numbers across the Eurozone – due today – are expected to show further softening in European price dynamics. Sufficiently weak figures should keep European Central Bank (ECB) doves comfortable with the easing path, which in turn supports the EZ growth narrative and the euro.
OPEC decision in sight
US crude is wavering just above the critical $60/barrel level this week. OPEC is preparing to announce its third major output restoration over the weekend. The cartel is expected to bring an additional 411,000 barrels per day to the market starting in July – about 1% of current production – citing ‘rising demand as official justification. But the official statement feels thin, given waning demand prospects amid global trade tensions. OPEC may simply be trying to appease Trump – or punish member states that failed to comply with past quotas. Whatever the rationale, if trade tensions persist, the rising supply could send oil prices meaningfully lower. A drop of another $10/barrel in the second half of the year can’t be ruled out.
EUR/AUD Daily Outlook
Daily Pivots: (S1) 1.7527; (P) 1.7591; (R1) 1.7709; More...
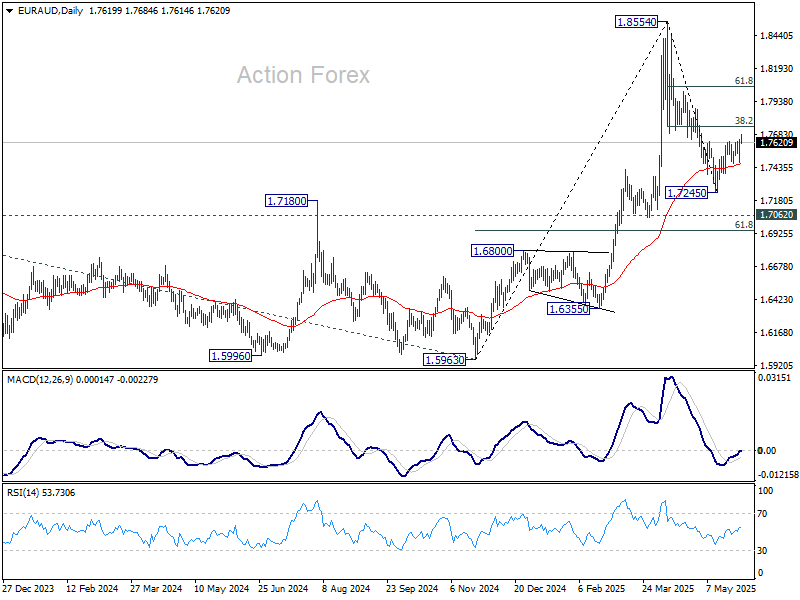
EUR/AUD's break of 1.7628 resistance argues that fall from 1.8554 might have completed as a correction at 1.7245. Intraday bias is back on the upside for 38.2% retracement of 1.8554 to 1.7245 at 1.7745. Firm break there will solidify this bullish case and target 61.8% retracement at 1.8054. On the downside, however, break of 1.7460 support will bring retest of 1.7245 instead.
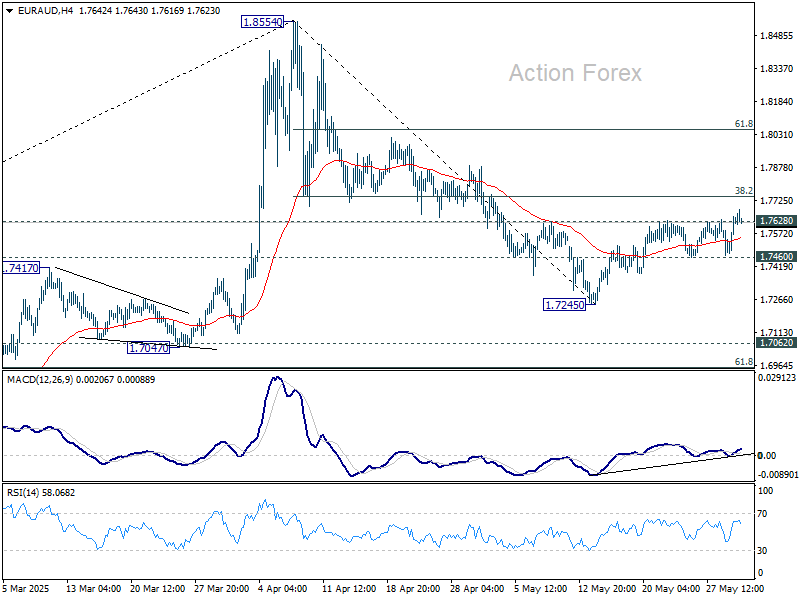
In the bigger picture, as long as 1.7062 resistance turned support (2023 high) holds, up trend from 1.4281 (2022 low) should still be in progress. Break of 1.8554 will target 100% projection of 1.4281 to 1.7062 from 1.5963 at 1.8744. However, sustained break of 1.7062 will confirm medium term topping and bring deeper fall back to 1.5963 support.
Markets Turn Cautious Again on Trade Stalemates; Euro Picking Up Momentum in Some Crosses
Asian markets returned to a risk-off tone today, with investor sentiment once again weighed down by the lack of clarity on the US tariff front and the apparent stalling of key trade negotiations. The week’s earlier relief rally following the U.S. court ruling against President Trump’s sweeping reciprocal tariffs has faded, as the legal battle drags on and policy direction remains uncertain. The result is renewed market hesitancy, with equities pulling back and safe-haven flows nudging Yen higher.
In currency markets, the tone is cautious and directionless, with almost all major pairs and crosses confined to last week's ranges. After a volatile stretch, there’s little momentum to drive breakouts. For the day, Yen is the strongest performer, supported by risk aversion, followed by the Dollar and Kiwi. On the weaker side, the Euro is underperforming, trailed by the Aussie and Sterling. Swiss Franc and Loonie are trading near the middle of the pack.
Thursday’s session in the US captured this shifting mood well as stocks closed well off their intraday highs. That optimism was first driven by the US Court of International Trade’s ruling that struck down most of Trump’s global tariff orders. However, the relief was short-lived. The US Court of Appeals paused that ruling to consider the administration’s appeal, setting a new timeline for responses from both plaintiffs and the government in early June. The pause has restored uncertainty to a situation markets briefly hoped was resolved.
Further dampening sentiment were remarks from US Treasury Secretary Scott Bessent, who confirmed that US-China trade talks are “a bit stalled.” He did, however, hold out the possibility of further engagement in the coming weeks, including a potential leader-level call. Still, Bessent acknowledged that the magnitude and complexity of the negotiations likely require direct involvement from both presidents, a signal that near-term breakthroughs remain unlikely.
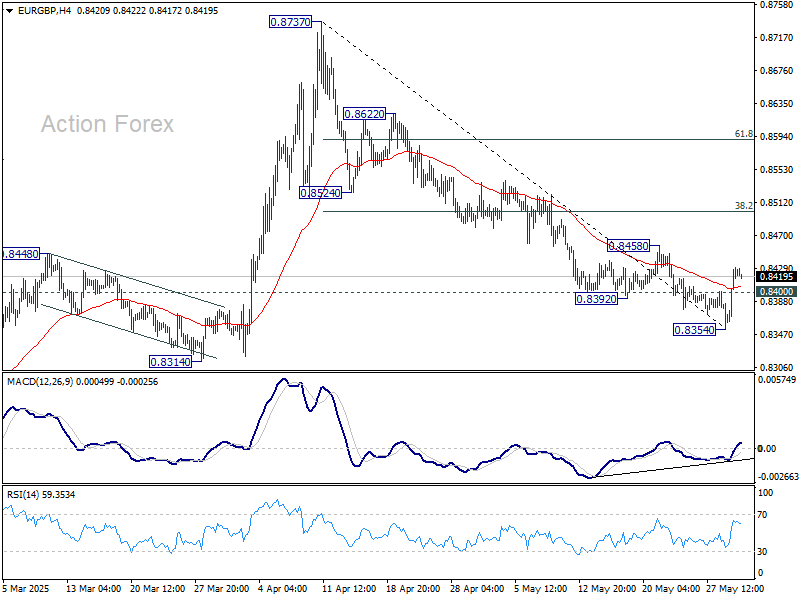
Technically, however, EUR/GBP's break of 0.8400 minor resistance suggests short term bottoming at 0.8354, on bullish convergence condition in 4H MACD. While the rebound might still be a corrective move, further rise is now in favor through 0.8458 resistance to 38.2% retracement of 0.8737 to 0.8354 at 0.8500.
In Asia, at the time of writing, Nikkei is down -1.08%. Hong Kong HSI is down -1.54%. China Shanghai SSE is down -0.30%. Singapore Strait Times is down -0.24%. Japan 10-year JGB yield is down -0.015 at 1.506. Overnight, DOW rose 0.28%. S&P 500 rose 0.40%. NASDAQ rose 0.39%. 10year yield fell -0.053 to 4.424.
Looking ahead, Germany CPI flash is the main focus in European sess. Switzerland will publish KOF economic barometer. Eurozone will release M3 money supply. Later in the day, attention will be on Canada GDP, and US PCE inflation.
Japan's industrial production falls -0.9% mom in April, but May rebound expected
Japan's industrial production fell by -0.9% mom in April, a milder decline than the expected -1.4%. The Ministry of Economy, Trade and Industry maintained its view that production "fluctuates indecisively," reflecting ongoing uncertainty, particularly around global trade developments.
While the ministry said the impact of US tariffs was limited in April, some firms have voiced concern about the manufacturing outlook as policy risks persist.
The breakdown of the data shows a mixed picture: six of 15 industrial sectors saw declines, including production machinery, fabricated metals, and transport equipment excluding motor vehicles. However, eight sectors recorded gains, with electronic parts and business-oriented machinery showing notable strength.
Manufacturers surveyed expect a sharp 9.0% rebound in May, followed by a -3.4% dip in June.
Also released, Japan's retail sales grew by a stronger-than-expected 3.3% yoy in April, outpacing the consensus of 2.9% yoy. Meanwhile, the unemployment rate remained steady at 2.5%.
Tokyo core inflation accelerates to 3.6%, driven by food and services costs
Tokyo's core CPI (excluding fresh food) accelerated to 3.6% yoy in May, up from 3.4% yoy and above market expectations of 3.5% yoy, marking the fastest pace since January 2023. This marks the third consecutive year that core inflation has exceeded the Bank of Japan’s 2% target.
While headline CPI ticked down slightly from 3.5% yoy to 3.4% yoy, the underlying core-core measure (excluding food and energy) also edged up fro 2.0% yoy to 2.1% yoy, suggesting broad-based inflation persistence.
The surge in non-fresh food prices, up 6.9% yoy, remains a dominant driver—highlighted by a staggering 93.2% yoy jump in rice prices.
Another notable development is the uptick in services inflation, which climbed to 2.2% yoy from 2.0% yoy , indicating that businesses are beginning to pass on higher labor costs.
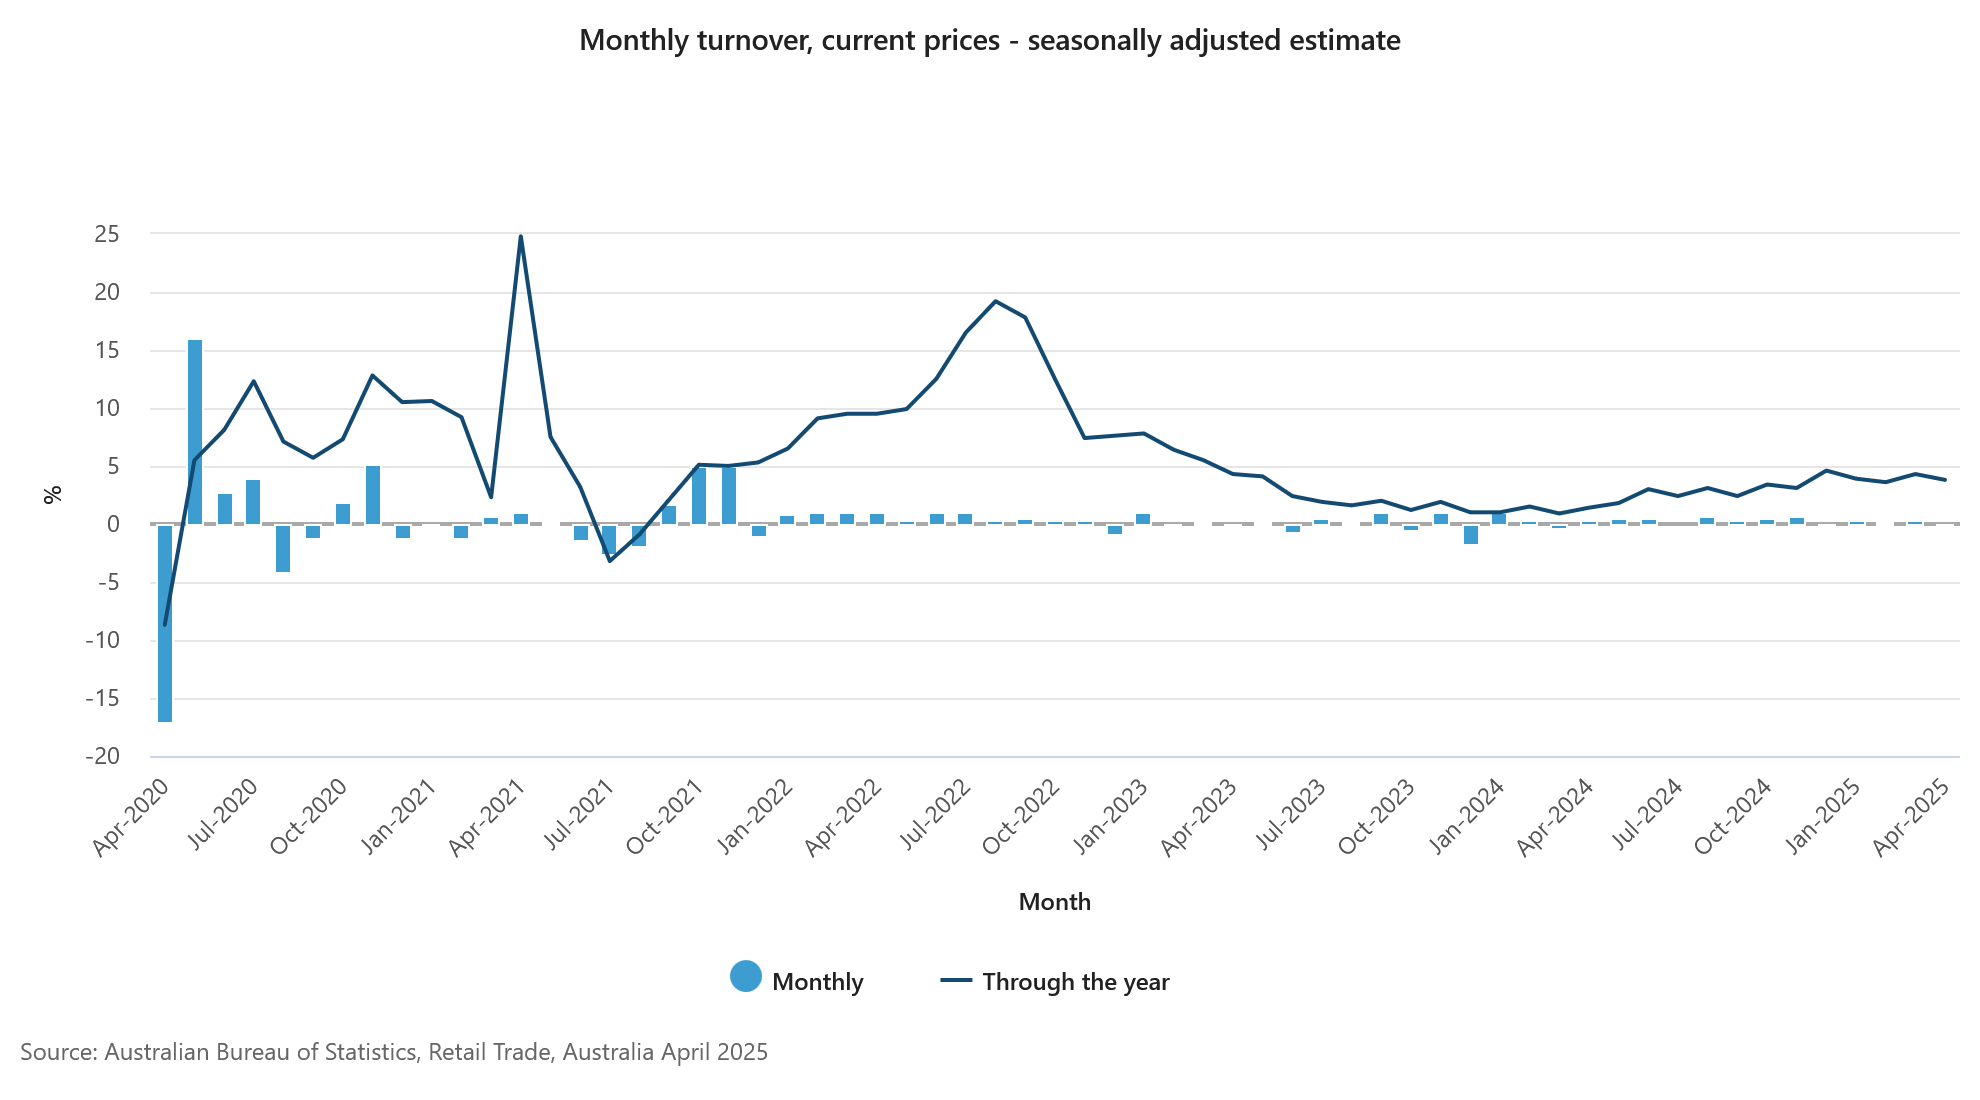
Australia retail sales down -0.1% mom in April, weighed by weak clothing demand
Australia’s retail sales turnover unexpectedly declined by -0.1% mom in April, missing expectations for a 0.3% mom rise. On an annual basis, sales were up 3.8% compared to April 2024/
The Australian Bureau of Statistics noted that the decline was driven primarily by reduced spending on clothing. The weakness was partly offset by a rebound in Queensland, where businesses recovered from disruptions caused by ex-Tropical Cyclone Alfred in March.
RBNZ's Silk: Data to guide timing and need for further cuts
RBNZ Assistant Governor Karen Silk said that interest rates are currently within the estimated neutral band of 2.5% to 3.5%.
She noted that the full impact of previous easing has yet to filter through the economy, making any future adjustments highly dependent on incoming data.
The OCR track indicates "whatever we do is going to be data-dependent, and then we will be looking to the data to help us to decide when or if we cut further from here," she added.
Fed’s Logan: Policy well positioned, ready to respond to shifting risks
Dallas Fed President Lorie Logan said overnight that with inflation "trending gradually back to target", the labor market "holding strong", and risks to Fed’s dual mandate are "roughly balanced.
Speaking at an event, Logan emphasized that "monetary policy is in a good place", and there is no immediate need for a policy shift.
Logan also highlighted the potential impact of fiscal policy and regulatory changes, noting they could stimulate investment and consumer demand, while elevated economic uncertainty or financial volatility might dampen activity.
Fed's Daly: Modestly or moderately restrictive policy still needed
San Francisco Fed President Mary Daly, in a Reuters interview, emphasized that above-target inflation remains her "focus" while the labor market is in "solid shape".
With inflation still running above the Fed's 2% target and uncertainty around the pace of its decline, Daly said it's appropriate for monetary policy to remain in a “modestly or moderately restrictive” stance to guide inflation back to target.
Daly added that she's closely watching for any signs of labor market weakening but hasn’t observed such signals yet. At the same time, she remains attentive to whether inflation continues to gradually ease or risks becoming sticky or re-accelerating.
BoE's Bailey stresses caution on rate cuts amid inflation surprises and trade uncertainty
BoE Governor Andrew Bailey emphasized the need for a “gradual and careful” approach to future interest rate cuts in light of lingering global trade uncertainty and its impact on domestic inflation.
His comments follow last week’s stronger-than-expected inflation data, which showed UK CPI jumping to 3.5% in April from 2.6%. Bailey noted it remains unclear how much of the increase is due to seasonal factors, and said the BoE will closely examine the next set of inflation data ahead of its June policy decision.
Bailey acknowledged that while core inflation is "gradually grinding down", the pace of improvement remains sluggish. He also highlighted a renewed rise in food price inflation, which—although not unique to the UK—has a significant influence on public inflation perceptions.
EUR/AUD Daily Outlook
Daily Pivots: (S1) 1.7527; (P) 1.7591; (R1) 1.7709; More...
EUR/AUD's break of 1.7628 resistance argues that fall from 1.8554 might have completed as a correction at 1.7245. Intraday bias is back on the upside for 38.2% retracement of 1.8554 to 1.7245 at 1.7745. Firm break there will solidify this bullish case and target 61.8% retracement at 1.8054. On the downside, however, break of 1.7460 support will bring retest of 1.7245 instead.
In the bigger picture, as long as 1.7062 resistance turned support (2023 high) holds, up trend from 1.4281 (2022 low) should still be in progress. Break of 1.8554 will target 100% projection of 1.4281 to 1.7062 from 1.5963 at 1.8744. However, sustained break of 1.7062 will confirm medium term topping and bring deeper fall back to 1.5963 support.
Cliff Notes: Learning to Live with Uncertainty
Key insights from the week that was.
In Australia, the April Monthly CPI Indicator rose 0.8% in the month, leaving annual headline inflation steady at 2.4% – around the mid-point of the RBA’s target band. Being the first month of the quarter, the main updates of interest were on durable goods which are surveyed only once per quarter. There were a few upside surprises here relative to Westpac’s forecast, particularly around footwear, textiles and household contents. The monthly trimmed mean estimate consequently ticked up from 2.7%yr to 2.8%yr, posing some upside risk to our Q2 CPI forecast. As this indicator only provides a ‘partial’ look at inflation, the next two months’ releases are necessary to get a full view.
In the run-up to Q1 GDP next week, we also received two partial indicators of investment.
Construction activity was weaker than expected, holding flat in the quarter to be up 3.5% over the year to March. The main disappointment was the ‘lumpy’ infrastructure segment, down 1.0% in Q1 despite a healthy project pipeline of public sector and renewable initiatives. It was nonetheless encouraging to see residential construction hold to its uptrend, though the current rate of construction is still falling well short of the demands from a growing population. Thankfully, cost pressures look to be easing, suggesting the intense capacity constraints that plagued the sector over recent years are starting to abate.
Private CAPEX also subsequently disappointed, the –0.1% decline in Q1 bringing the annual pace down into negative territory at –0.5%yr. The non-mining sector was the chief culprit behind the weak print (–0.9%), reflecting a broad-based pull-back in equipment spending; the mining sector provided an offset (+1.9%). 2025-26 CAPEX plans continue to capture a subdued outlook for investment, but there hasn’t been a material response to the volatility in the global outlook brought about by President Trump’s trade actions. As detailed in our recent Quarterly Business Snapshot, Australian businesses are well placed overall; and, as discussed in talking about trade, resilient to current global trade uncertainty.
Our Q1 GDP preview will be published later today on Westpac IQ.
Offshore, the US was again the focus in a quiet week for data.
The FOMC's May meeting minutes showed FOMC members remain confident in the underlying health of the US economy, with economic activity and labour market conditions both characterised as "solid". Inflation was meanwhile described as "somewhat elevated" and the "significant uncertainties" for inflation and expectations from trade and migration policies called out. There was only limited discussion of the different activity scenarios constructed by staff, and FOMC members views also highlighted the high degree of uncertainty currently present. Staff projections for inflation lifted, but members also noted "significant uncertainty surrounded those effects". The committee is well aware of the difficult task in managing the dual mandate, noting that "Participants emphasized the importance of ensuring that longer-term inflation expectations remained well anchored... [and that] the Committee might face difficult trade-offs if inflation proves to be more persistent while the outlook for growth and employment weaken."
Overall, the minutes gave little away in forward guidance or a reaction function to tariff-related impacts on the economy. The FOMC is clearly in 'wait and see' mode, which seems appropriate given the uncertainty around bilateral trade negotiations; the potential for tariffs to again be lifted by President Trump; and now the uncertainty over the legal standing of the tariffs themselves, which is to be decided through the appeals process after the US Court of International Trade this week determined President Trump had exceeded his authority with the bilateral tariffs of Liberation Day and those related to fentanyl. President Trump and the administration believe they will win on appeal and President Trump continues to argue the FOMC should lower interest rates without delay, as made clear by reports after the first meeting for this term between President Trump and FOMC Chair Powell this week.
Closer to home, the Reserve Bank of New Zealand cut their overnight cash rate by 25bps to 3.25% in a 5-1 vote. The decision was accompanied by a fresh set of forecasts which showed a lower central expectation for GDP growth. They also showed inflation is expected to peak at 2.7% in the September quarter and decelerate to 1.9% by early 2026. Governor Hawkesby noted the RBNZ would begin the next meeting with "no bias", insinuating they are not on a pre-set path and will focus on the data between now and then. Most notably, the projected OCR was revised down with the low point for policy rate now 2.85% from 3.10% previously. In light of these views and recent data, our New Zealand colleagues have revised the timing of their call, now expecting the next cut to come in August instead of July.
RBNZ’s Silk: Data to guide timing and need for further cuts
RBNZ Assistant Governor Karen Silk said that interest rates are currently within the estimated neutral band of 2.5% to 3.5%.
She noted that the full impact of previous easing has yet to filter through the economy, making any future adjustments highly dependent on incoming data.
The OCR track indicates "whatever we do is going to be data-dependent, and then we will be looking to the data to help us to decide when or if we cut further from here," she added.
Australia retail sales down -0.1% mom in April, weighed by weak clothing demand
Australia’s retail sales turnover unexpectedly declined by -0.1% mom in April, missing expectations for a 0.3% mom rise. On an annual basis, sales were up 3.8% compared to April 2024/
The Australian Bureau of Statistics noted that the decline was driven primarily by reduced spending on clothing. The weakness was partly offset by a rebound in Queensland, where businesses recovered from disruptions caused by ex-Tropical Cyclone Alfred in March.
Japan’s industrial production falls -0.9% mom in April, but May rebound expected
Japan's industrial production fell by -0.9% mom in April, a milder decline than the expected -1.4%. The Ministry of Economy, Trade and Industry maintained its view that production "fluctuates indecisively," reflecting ongoing uncertainty, particularly around global trade developments.
While the ministry said the impact of US tariffs was limited in April, some firms have voiced concern about the manufacturing outlook as policy risks persist.
The breakdown of the data shows a mixed picture: six of 15 industrial sectors saw declines, including production machinery, fabricated metals, and transport equipment excluding motor vehicles. However, eight sectors recorded gains, with electronic parts and business-oriented machinery showing notable strength.
Manufacturers surveyed expect a sharp 9.0% rebound in May, followed by a -3.4% dip in June.
Also released, Japan's retail sales grew by a stronger-than-expected 3.3% yoy in April, outpacing the consensus of 2.9% yoy. Meanwhile, the unemployment rate remained steady at 2.5%.
Tokyo core inflation accelerates to 3.6%, driven by food and services costs
Tokyo's core CPI (excluding fresh food) accelerated to 3.6% yoy in May, up from 3.4% yoy and above market expectations of 3.5% yoy, marking the fastest pace since January 2023. This marks the third consecutive year that core inflation has exceeded the Bank of Japan’s 2% target.
While headline CPI ticked down slightly from 3.5% yoy to 3.4% yoy, the underlying core-core measure (excluding food and energy) also edged up fro 2.0% yoy to 2.1% yoy, suggesting broad-based inflation persistence.
The surge in non-fresh food prices, up 6.9% yoy, remains a dominant driver—highlighted by a staggering 93.2% yoy jump in rice prices.
Another notable development is the uptick in services inflation, which climbed to 2.2% yoy from 2.0% yoy , indicating that businesses are beginning to pass on higher labor costs.
Fed’s Logan: Policy well positioned, ready to respond to shifting risks
Dallas Fed President Lorie Logan said overnight that with inflation "trending gradually back to target", the labor market "holding strong", and risks to Fed’s dual mandate are "roughly balanced.
Speaking at an event, Logan emphasized that "monetary policy is in a good place", and there is no immediate need for a policy shift.
Logan also highlighted the potential impact of fiscal policy and regulatory changes, noting they could stimulate investment and consumer demand, while elevated economic uncertainty or financial volatility might dampen activity.
Fed’s Daly: Modestly or moderately restrictive policy still needed
San Francisco Fed President Mary Daly, in a Reuters interview, emphasized that above-target inflation remains her "focus" while the labor market is in "solid shape".
With inflation still running above the Fed's 2% target and uncertainty around the pace of its decline, Daly said it's appropriate for monetary policy to remain in a “modestly or moderately restrictive” stance to guide inflation back to target.
Daly added that she's closely watching for any signs of labor market weakening but hasn’t observed such signals yet. At the same time, she remains attentive to whether inflation continues to gradually ease or risks becoming sticky or re-accelerating.