Sample Category Title
USDJPY Back To Range Trading
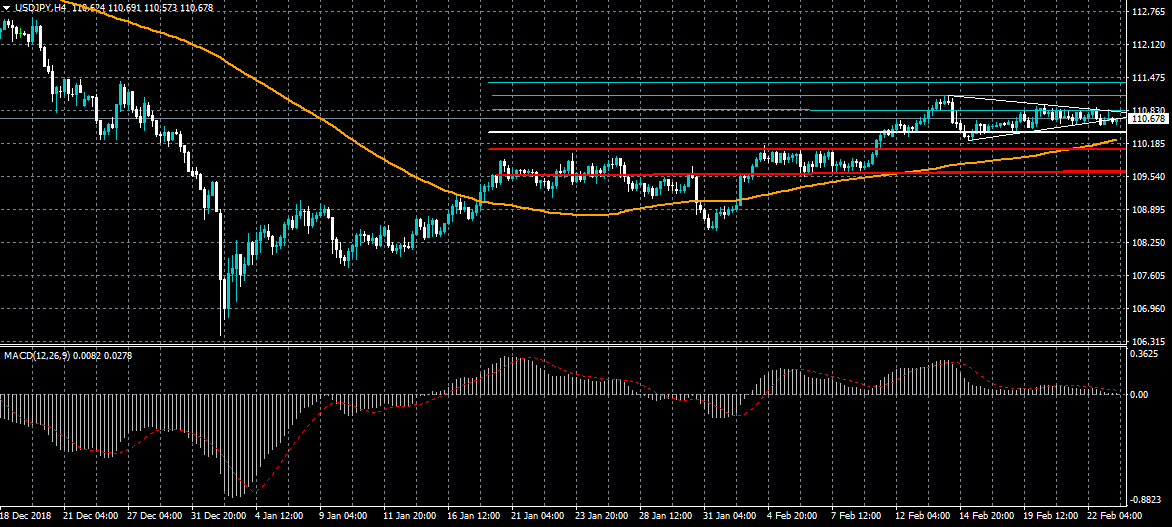
The US dollar is has moved back to range-bound trading conditions against the Japanese yen currency, despite US President Donald Trump extending trade talks between the Washington and Beijing. Technical failure before the 111.00 level has seen the USDJPY pair move back towards the lower end of its recent range, with the 110.60 level key support below. Price is also trading below a well-defined symmetrical triangle pattern on the four-hour time frame.
The USDJPY pair is only bullish while trading above the 110.80 level, key technical resistance remains at the 111.12 and 111.40 levels.
If the USDJPY pair trades below the 110.60 level, sellers may test towards the 110.40 and 110.24 support levels.
EUR/USD – Euro Slightly Higher On Light-Data Monday
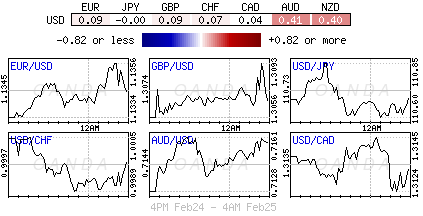
EUR/USD has edged higher in the Monday session. Currently, the pair is trading at 1.1362, up 0.25% on the day. It’s a very quiet start to the week, with no eurozone or German events. The are no major indicators in the U.S., so traders can expect limited movement from the pair. On Tuesday, Germany releases GfK Consumer Climate and the U.S. posts CB Consumer Confidence. As well, Federal Reserve Chair Jerome Powell testifies before the Senate Banking Committee.
German and eurozone indicators were sluggish last week, raising concerns that after a slowdown in the fourth quarter, Q1 will also be a soft quarter. Last week’s numbers were weak, but the euro still managed to post a winning week against the greenback. On Friday, Germany’s fourth-quarter GDP showed no change, after a contraction of 0.2% in the third quarter. The Ifo Business Climate survey slowed for a sixth successive month, indicating concern in the business sector about the country’s economic outlook. Manufacturing and inflation data also disappointed. The manufacturing PMI contracted for a second straight month, while German CPI declined in January for the first time in a year.
In the eurozone, Flash Manufacturing PMI fell for a seventh successive month and came in at 49.7 fo February, below the 50-line which separates contraction from expansion. It marked the first decline since June 2013. Final Core CPI, which was above 2.0% just a few months ago, fell to 1.4% in January. If German and eurozone data continues to point to a slowdown, investors could sour on the euro.
WTI OIL Outlook: WTI Maintains Positive Tone And Eyes 100WMA
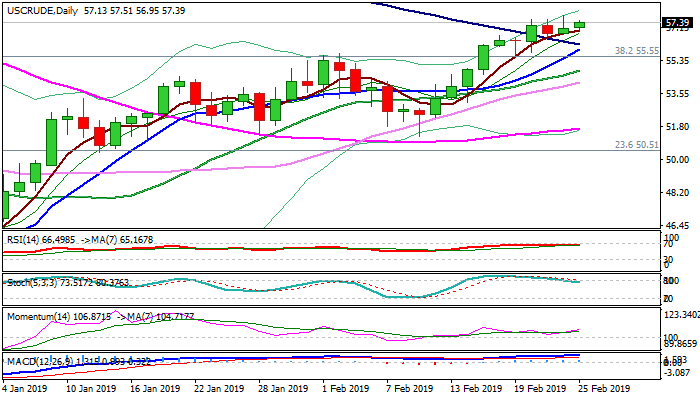
WTI oil bounced on Monday following short-lived probe below $57 handle (session low at $56.95) and aiming towards last Friday's high at $57.79 (the highest since mid-Nov 2018).
Optimistic tones from US/China trade talks and production cut by main world oil exporters, for now offset negative signals from rising US oil output and maintain bullish bias.
Bullish daily techs continue to support for attack at targets at $58.14/32 (16 Nov lower high/100WMA), however, reversal of daily stochastic from overbought territory may delay bulls.
Extended consolidation above broken 100SMA ($56.19) would keep bulls intact, as support is reinforced by rising 10SMA ($55.96) on track to form bull-cross and further boost bulls.
Res: 57.79, 58.14, 58.32, 59.62
Sup: 56.95, 56.64, 56.19, 55.96
The Analytical Overview Of The Main Currency Pairs
The EUR/USD currency pair
Technical indicators of the currency pair:
Prev Open: 1.13330
Open: 1.13322
% chg. over the last day: -0.06
Day's range: 1.13282 – 1.13587
52 wk range: 1.1214 – 1.2557
EUR keeps trading in a long flat. The market participants are waiting for addtional drivers. The negotiations between the Washington and Beijing remain in the spotlight. On Sunday, Donald Trump claimed that he is ready postpote the increase of the fee on Chinese wares after productive negotiations. Keep and eye on the subject and open positions from the key levels of 1.13400 and 1.13650.
The Economic News Feed for 25.02.2019 is calm.
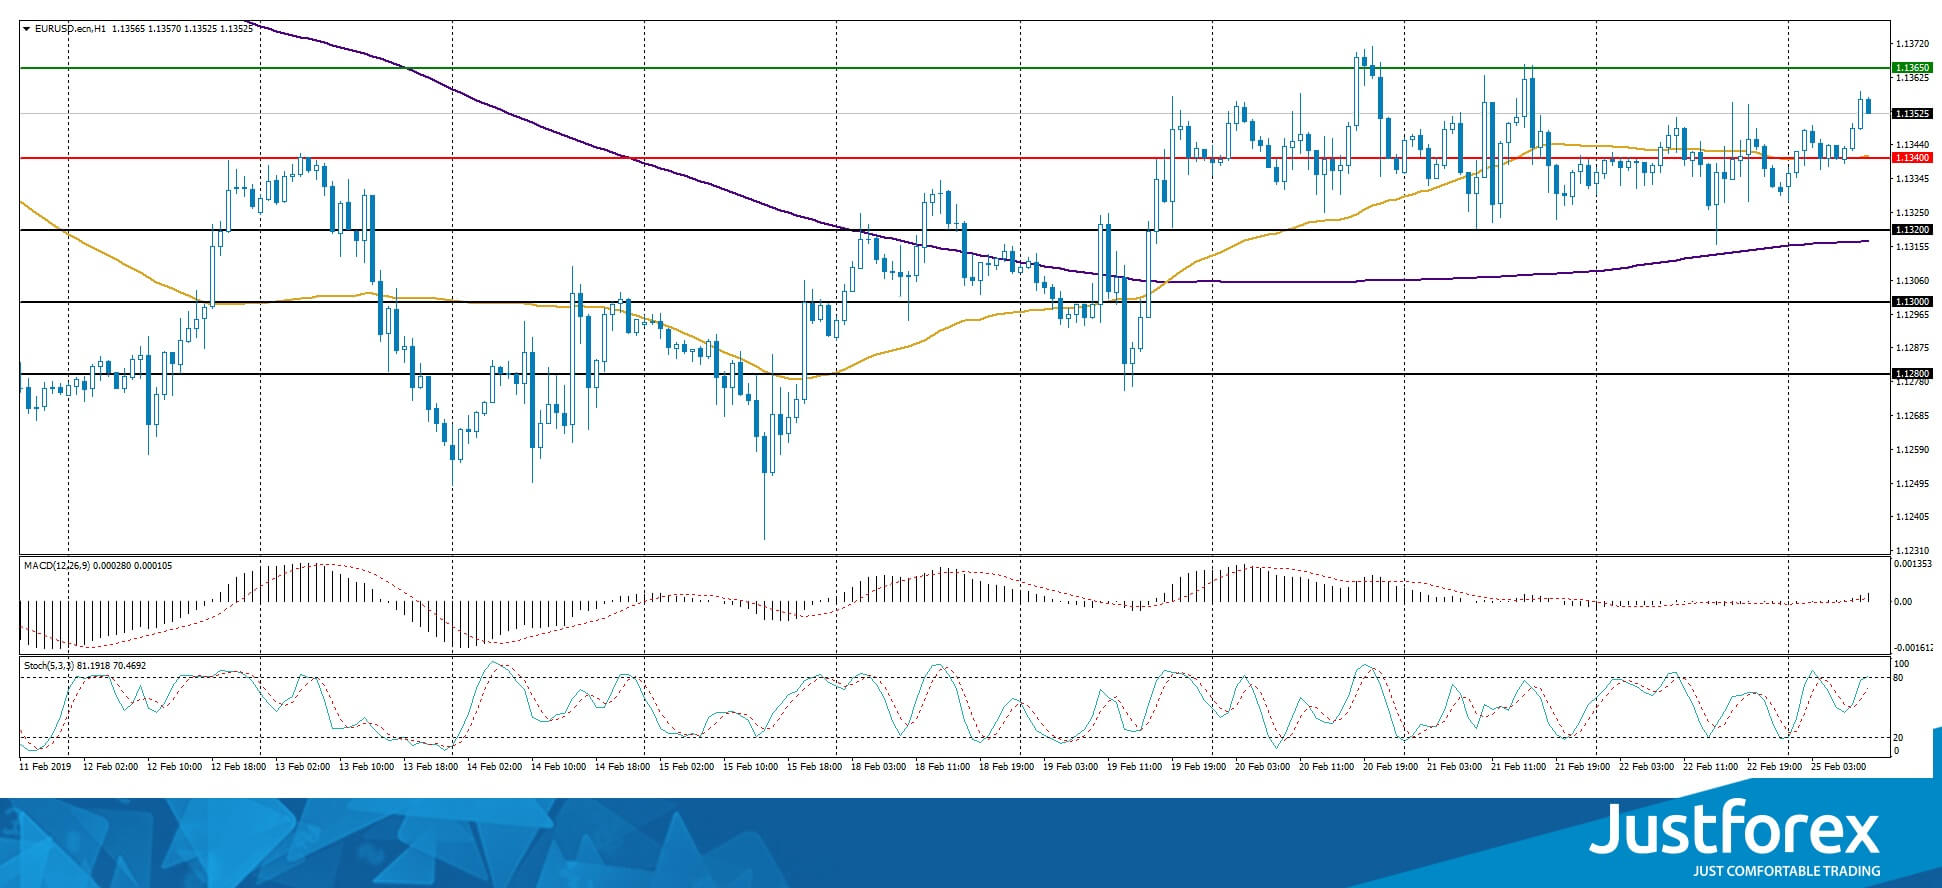
The indicators do not provide precise signals, the price is consolidating next to 50 MA and 200 MA, which act as dynamic support and resistance levels.
The MACD histogram is in the positive zone, which gives a weak signal to buy EUR/USD
The Stochastic Oscillator is in the neutral zone, the %K line is crossing the %D line. There are no signals at the moment.
Trading recommendations
Support levels: 1.13400, 1.13200, 1.13000
Resistance levels: 1.13650, 1.14000
If the price fixes at the 1.13650 level. expect the quotes to grow toward the round 1.14000.
Alternatively, the quotes can descend toward 1.13200-1.13000.
The GBP/USD currency pair
Technical indicators of the currency pair:
Prev Open: 1.30251
Open: 1.30704
% chg. over the last day: +0.11
Day's range: 1.30439 – 1.30991
52 wk range: 1.2438 – 1.4378
GBP/USD remains ambiguous. There is no defined trend, the investors are closely watching the Brexit situation. The British government reviews different options to postpone the separation, should Theresa May fail to reach an aggreement until March 12. The GBP/USD quotes are testing the 1.31000. 1.30400 acts as the key support. You should open positions from these levels.
Keep an eye on the statements by the Head of the Bank of England.
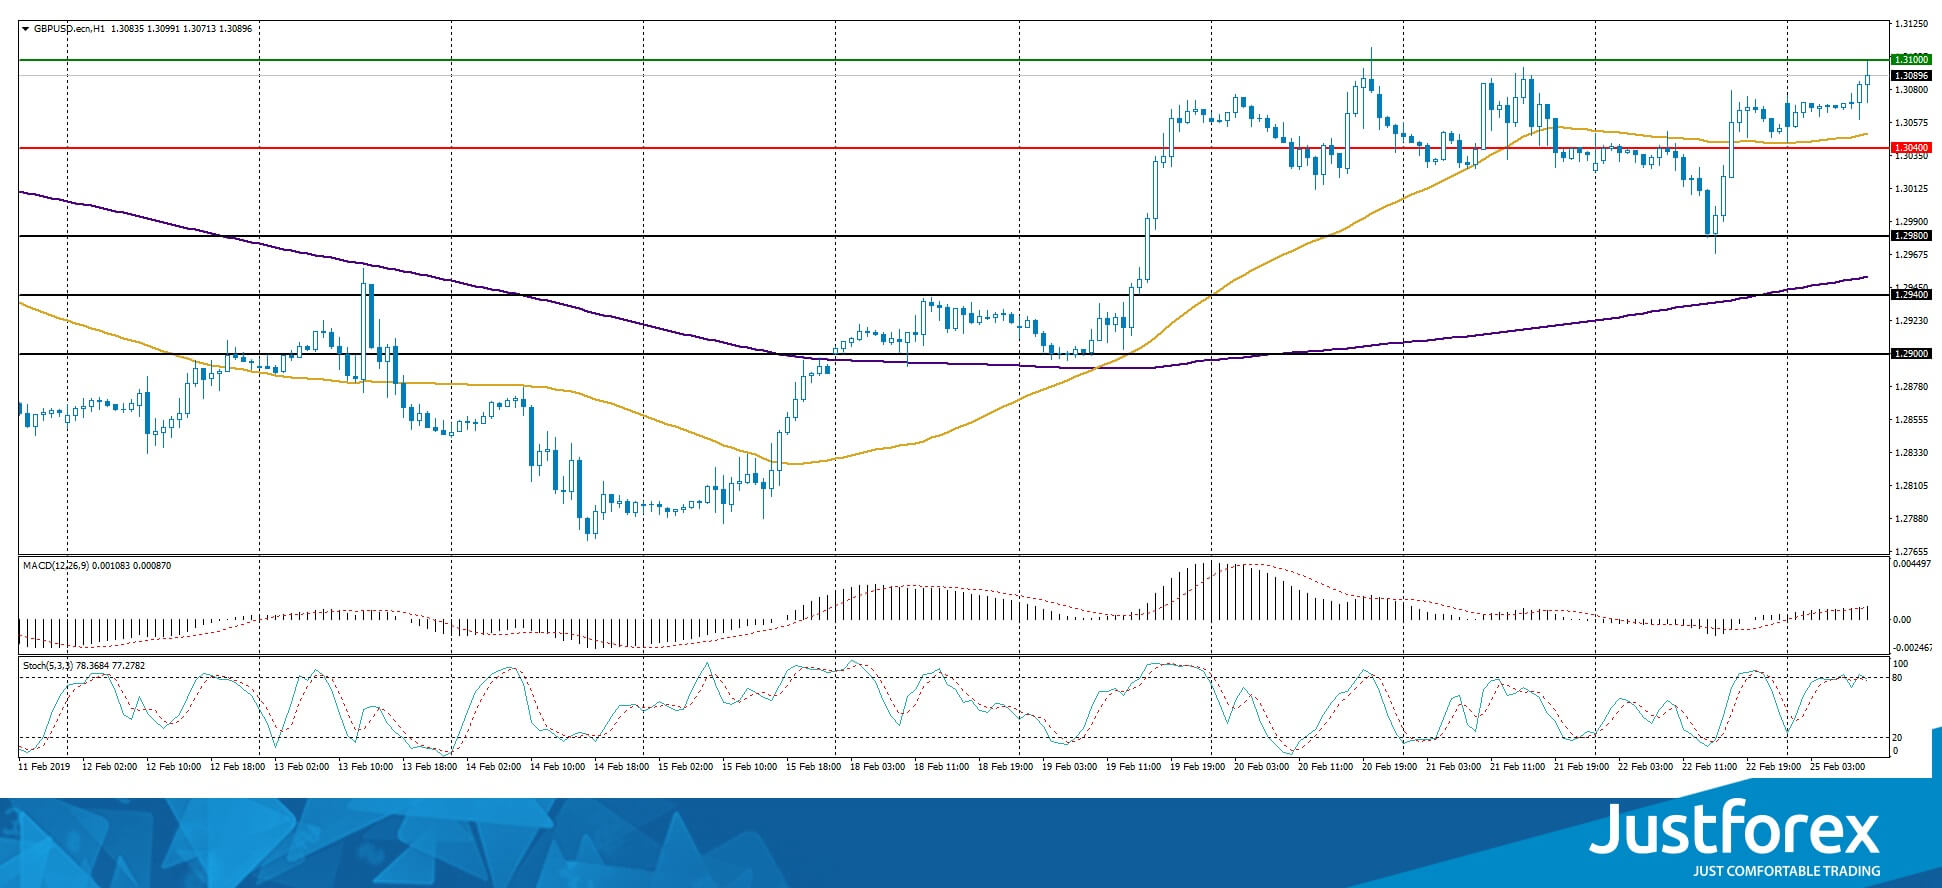
The price fixed above 50 MA and 200 MA which points to the power of the buyers.
The MACD histogram is in the positive zone and keeps rising, which points to the bullish mood.
The Stochastic Oscillator is near the overbought zone, the %K line is crossing the %D line. There are no signals at the moment.
Trading recommendations
Support levels: 1.30400, 1.29800, 1.29400
Resistance levels: 1.31000, 1.31500
If the price fixes above the round 1.31000, expect the quotes to grow toward 1.31400-1.31600.
Alternatively, GBP/USD can correct toward 1.30200-1.29800.
The USD/CAD currency pair
Technical indicators of the currency pair:
Prev Open: 1.32252
Open: 1.31342
% chg. over the last day: -0.72
Day's range: 1.31216 – 1.31455
52 wk range: 1.2248 – 1.3664
USD/CAD started to descend. The demand for the commodity currencies grew due to the progress in the US/China negotiations. On Friday, February 22, CAD strengthened against the USD by 100 points and updated the key extremums. The quotes are testing the key support of 1.31250 with 1.31600 acting as the mirror resistance. The quotes have prospects for further descend, you should open positions from the key levels.
The Economic News Feed for 25.02.2019 is calm.
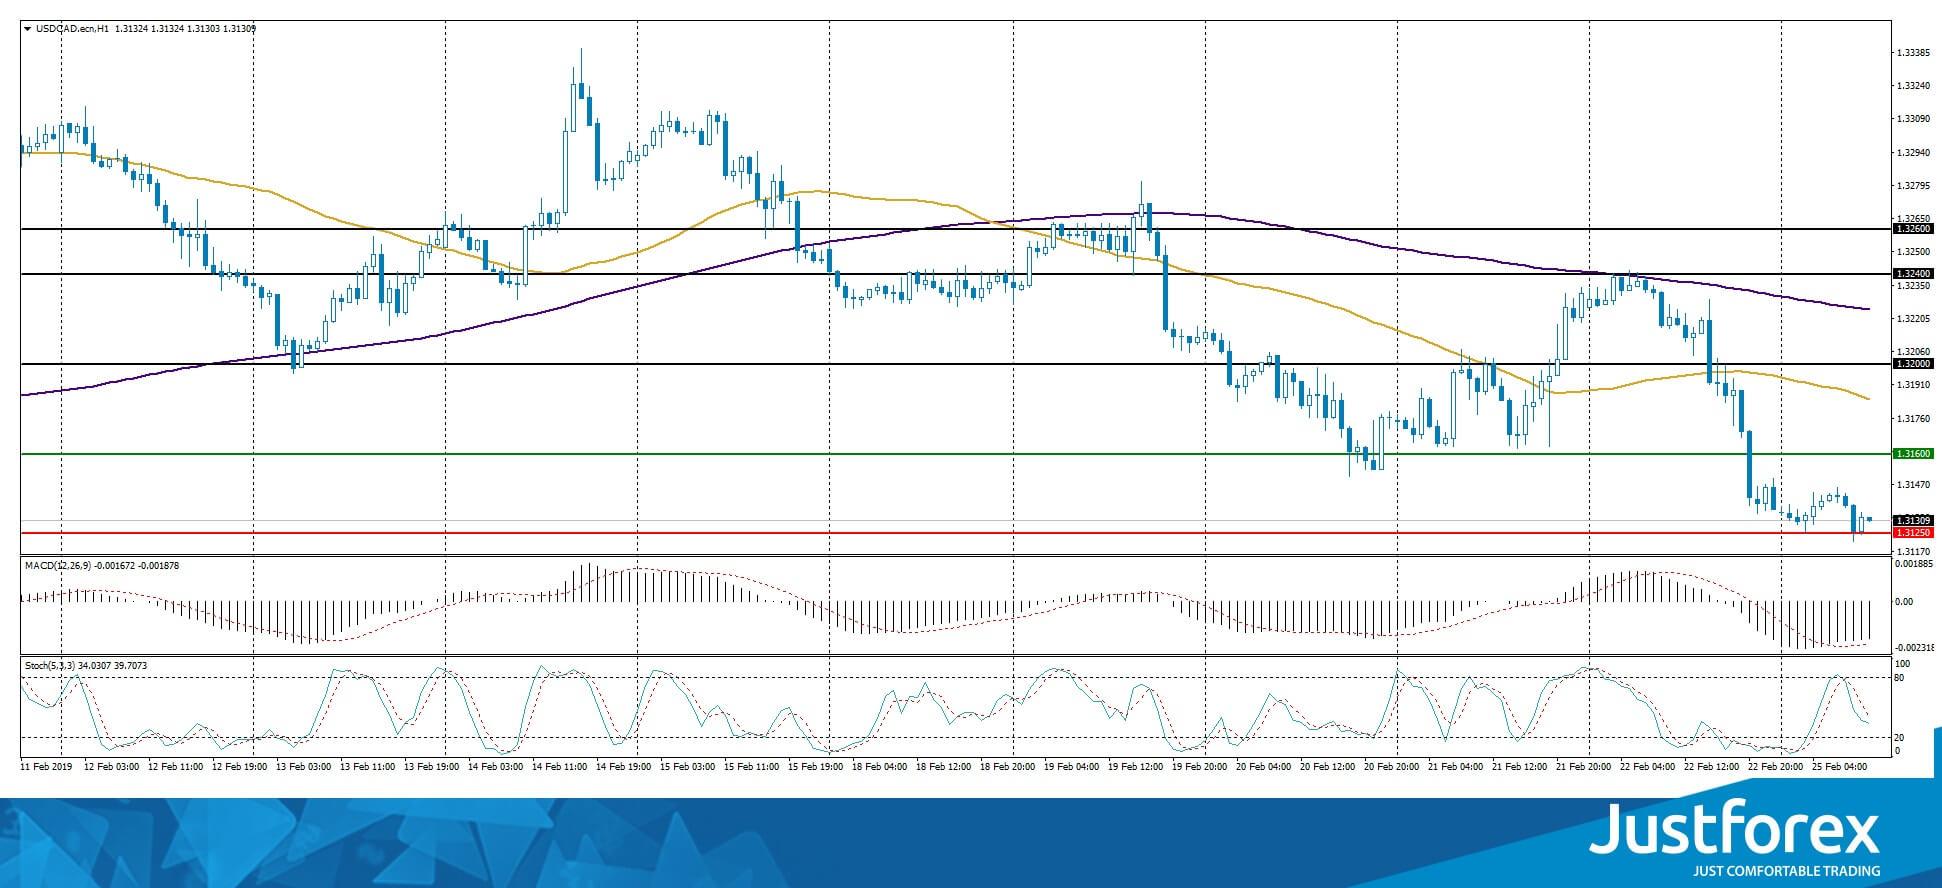
The indicators point to the power of the buyers: the price fixed above 50 MA and 200 MA.
The MACD histogram is in the negative zone but above the signal line, which gives a weak signal to sell USD/CAD.
The Stochastic Oscillator is in the neutral zone, the %K line is below the %D line which points to the bearish mood.
Trading recommendations
Support levels: 1.31250, 1.30750
Resistance levels: 1.31600, 1.32000, 1.32400
If the price fixes below the local support of 1.31250, expect the quotes to fall toward 1.30800-1.30600.
Alternatively, the quotes can grow toward 1.31800-1.32000.
The USD/JPY currency pair
Technical indicators of the currency pair:
Prev Open: 110.689
Open: 110.650
% chg. over the last day: -0.01
Day's range: 110.577 – 110.861
52 wk range: 104.56 – 114.56
USD/JPY keeps moving in a flat. The technical picture is ambiguous. The financial market participants are waiting for additional drivers. The quotes are testing the support and resistance levels of 110.600 and 110.850 and have a tendency to descend. Keep an eye on the US Treasury bonds yield and open positions from the key levels.
The Economic News Feed for 25.02.2019 is calm.
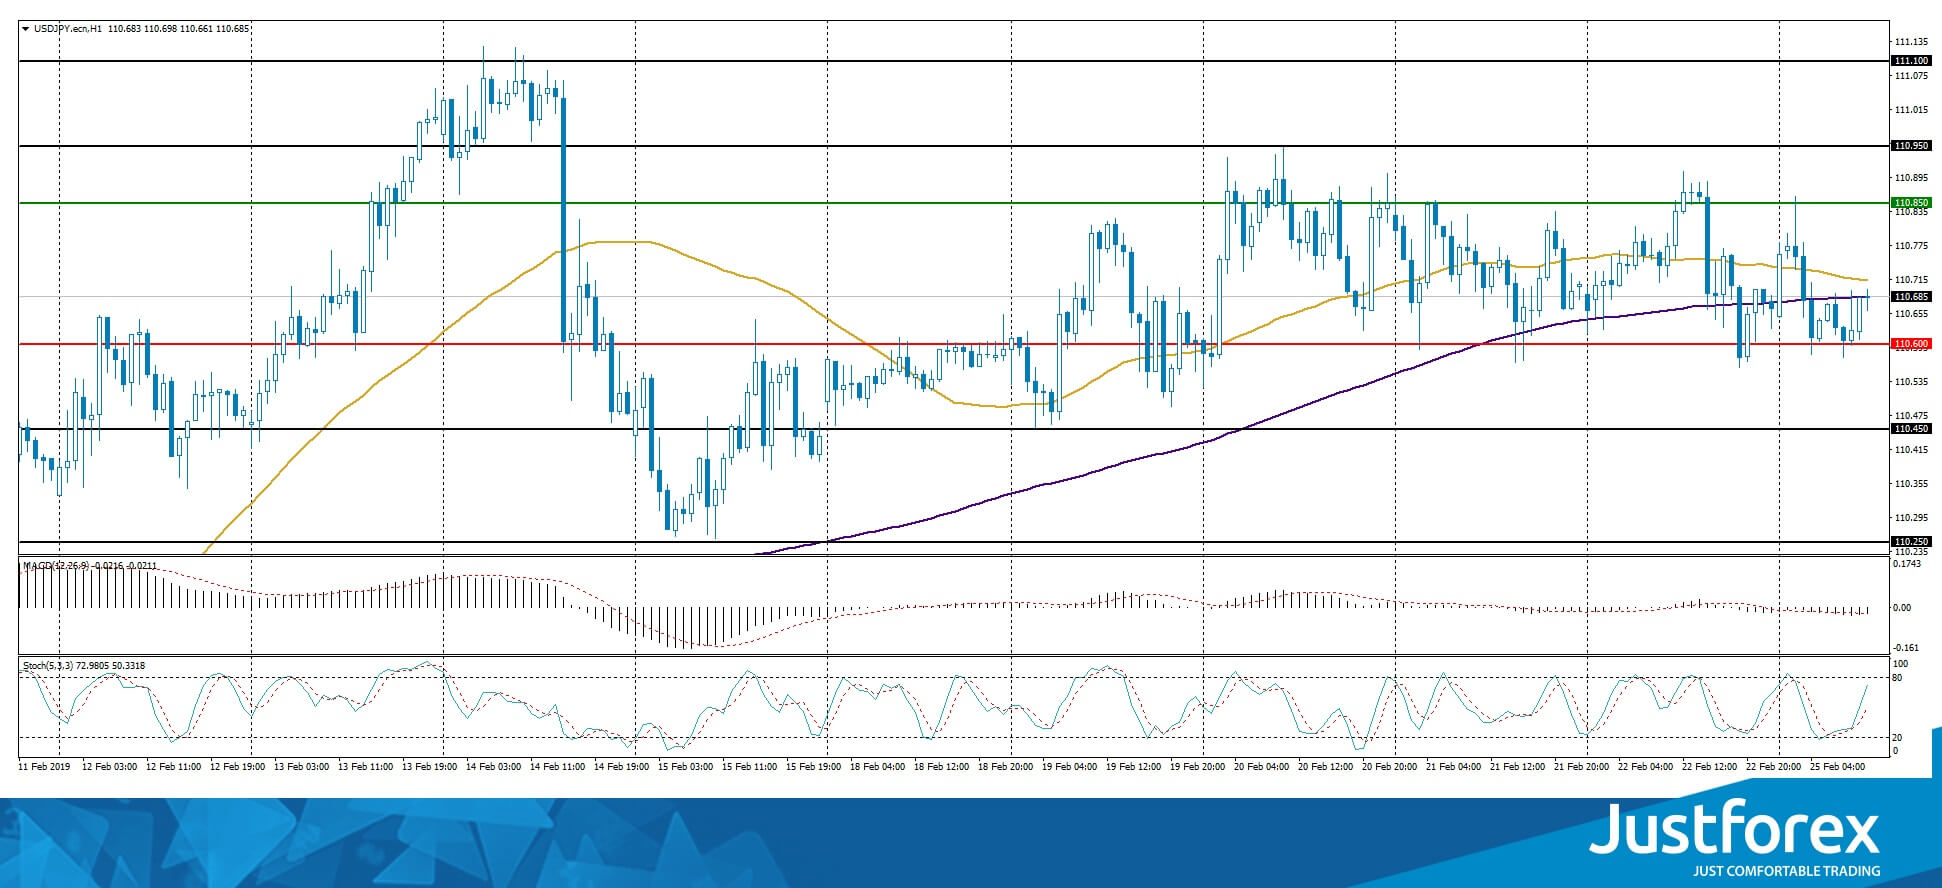
The indicators provide no signals, the price has crossed over 50 MA and 200 MA.
The MACD histogram is in the negative zone, which points to the bullish mood.
The Stochastic Oscillator is in the neutral zone, the %K line is above the %D line which gives a signal to buy USD/JPY.
Trading recommendations
Support levels: 110.600, 110.450, 110.250
Resistance levels: 110.850, 111.100, 111.500
If the price fixes below 110.600, expect the quotes to move toward 110.400-110.250.
Alternatively, the quotes can correct toward 111.100-111.400.
Investors Are Focused On The US-CHINA Trade Negotiations
On Friday, the US dollar fell slightly against a basket of major currencies, as demand for risky assets increased. Investors continue to monitor the negotiations between the US and China closely. So far, negotiations are succeeding. President Donald Trump said on Sunday that he would postpone tariff increases for Chinese goods in the US. This week, the leaders of the two countries will hold a summit at which a deal can be signed. On Friday, the dollar index (#DX) closed the trading session with a slight decrease (-0.10%).
Investors are also focused on Brexit. It became known that if the parliamentarians did not approve the agreement on the British exit from the EU before March 12, the Brexit process could be postponed.
On Friday, important economic reports from the Eurozone were published. The German IFO business climate index fell to 98.5 and was worse than the expected 99.0. The Eurozone consumer price index counted to 1.4% (y/y) in January, as experts forecasted. Statistics Canada published weak retail sales data for December: the core retail sales index fell by 0.5%; the volume of retail sales in the country decreased by 0.1%.
Market Indicators
- On Friday, the bullish sentiment was observed in the US stock market: #SPY (+0.62%), #DIA (+0.63%), #QQQ (+0.74%).
- The 10-year US government bonds yield is at 2.65-2.66%.
The news feed on 25.02.2019:
- Today, the publication of important economic news is not expected. We recommend paying attention to the speech by the Bank of England Governor Carney.
Fed Bostic: Room to run with rate hikes if economy runs fine
Atlanta Fed President Raphael Bostic said there is "room to run" with Fed's rate hikes. as long as the economy is "running fine" and there is no sign of contraction. He expects the economy growth between 2.2-2.5% this year. But inflation is expected to rise above 2% target.
Bostic is still aiming at lifting Federal funds rate to neutral. And a slow approach is a good path for Fed. He's currently seeing one rate hike this year and one in 2020.
Gold Retreats Within SMAs, Indicators Seem Too Weak
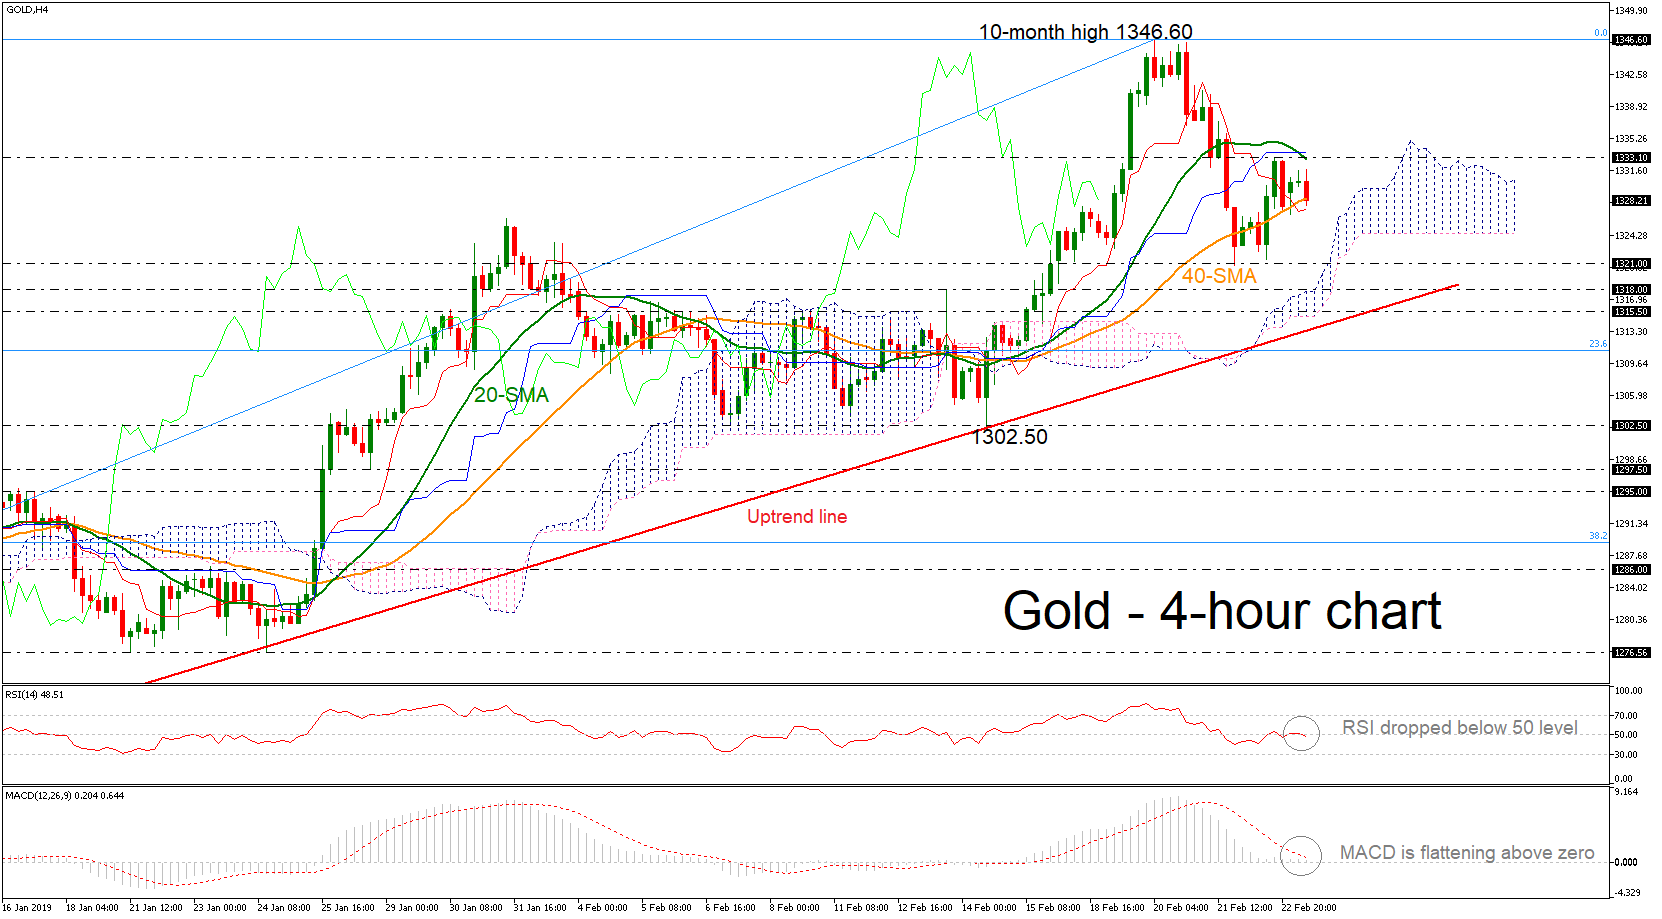
Gold prices are consolidating within the 20- and 40-simple moving averages (SMAs) in the 4-hour chart as well as within the red Tenkan-sen and blue Kijun-sen lines. The momentum indicators seem flat also, as the RSI is flattening near the neutral threshold of 50, while the MACD is holding above the zero line with very weak momentum in the short-term.
If the price surpasses the 1333.10 resistance level, which overlaps with the 20-SMA, this could send price towards the 10-month high of 1346.60. Immediate resistance to further gains would likely come from the 1357 barrier, taken from the highs on April 2018. If there is a successful break above this area, further resistance could be met around the 1365 strong obstacle, which halted bullish movements in the preceding year.
If the yellow metal reverses course, lower support would initially come from the 1321 level. Slipping below this level could take prices towards the 1315.50 – 1318 support zone, taken from the inside swing highs on February 8 and February 13 respectively. Failure to hold above this region would switch the focus back to the downside and would increasingly turn to the 23.6% Fibonacci of the upleg from 1196 to 1346.60 near 1311, penetrating the medium-term rising trend line.
In the more medium-term picture, the price is extending gains, endorsing the bullish view following the upward reversal at the 19-month low of 1160.
Nuclear Week Ahead For Global Markets
This week is an opportunity for those who love volatility, we have a string of events which are going to keep the market participants on their toes.
The events which are going to gather the most amount of attention are: the U.S.- China trade deal, Theresa May's efforts to avoid Brexit from derailing and Trump's meeting with Korean president. To finish off we will also hear from Jerome Powell, the chairman of the Federal Reserve and Michael Cohen's testimony in Congress.
Can it get any better? Probably, no, because a heap of geopolitical news along with economic data release is going to keep things really wild and this is going to bring several opportunities in the markets.
Trade Negotiations
Donald Trump decided that enough progress has been made on U.S.-China trade discussions, and in order to continue to sail in this direction, it is vital to not slap more tariffs on China- for now. The president was going to double the tariffs on more than $200 billion of Chinese imports on March 1st. Thanks to the constructive dialogues between the two countries which have avoided this situation.
Trump has decided to delay the process of adding tariffs on China (the official statement is still due). He is hopeful that the momentum will continue like this. The president wants to conclude the summit with Xi Jinping in Florida on a positive note. For now, everything sits under the label of "substantial progress has been made" and this has pushed the Chinese stock markets higher.
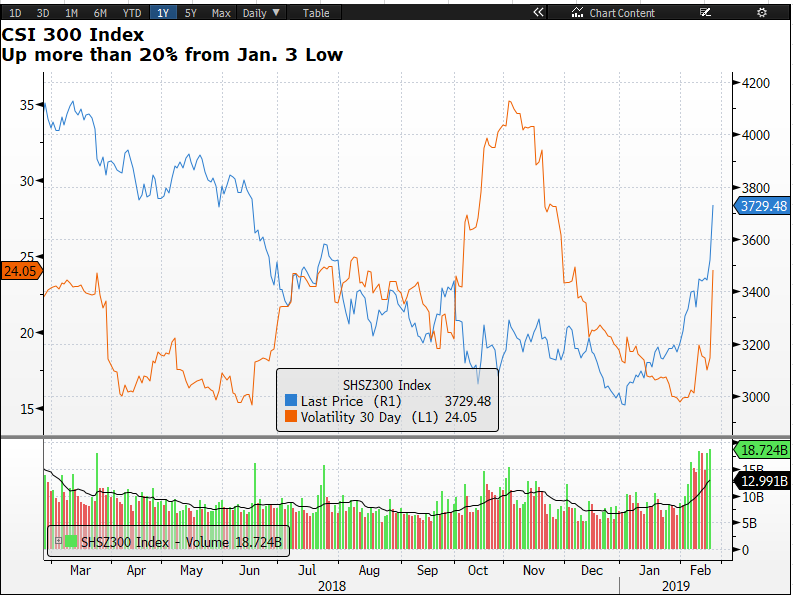
The Chinese CSI 300 index has jumped more than 4.6 percent, in order words, it is up nearly 20 percent from its low of Jan.3 and this is all on the back of the heavy volume, nearly three times the daily average. The 30-day price volatility has soared to 24.05 percent versus the average of 17.14 percent over the past month. Year to date, the index is up nearly 24 percent.
Brexit Deadlock
A deal in dessert has been touted a lot in the past few days as European leaders and British prime minister, Theresa May, are all attending a conference in Egypt. Departure terms are still untied between the two parties and there is no clarity what the future will look when it comes to Brexit. Lawmakers over in the parliament are fully prepared to seize the control of Brexit when the prime minister will return.
She is expected to come back home empty-hand, the EU leaders have made it clear several times that there is no deal except the current one. This gridlock in Brexit is running against time and the prime minister has openly refused to postpone the March 29 Brexit deadline. She has pushed back the deadline for a parliament vote on her Brexit deal, an attempt to buy more time and a huge gamble. Previously, she promised to bring a deal in the parliament on Wednesday, but now, it will only be a general vote. The chances are that her strategy is going to backfire because the MPs are likely to take control of Brexit and push the prime minister to the side. The lawmakers have decided to take the option of no-deal Brexit scenario off the table and they are frustrated with the prime minister because she was already granted more time at two different occasions, it is time for action now.
Jerome Powell and Michael Cohen's testimony
Market participants would need to work extra hard on coming Wednesday because, on one hand, it will be Jerome Powell who will be giving his second testimony. Trade tariffs, Fed's stance about its monetary policy and the health of the US economy (in the light of the upcoming US GDP data) are just some of the matters which will engage higher volatility. On the other hand, investors will have to keep an eye on Michael Cohen's testimony. Trump's former lawyer, Cohen, will be testifying at an open congressional hearing about his knowledge of the 2016 campaign, something Trump labels's it as “Witch hunt”. In addition to this, Wednesday will also be the day when President Trump will meet North Korea's leader Kim in Hanoi. All eyes will be on one key issue: Trump's efforts to make North Korea abandon its nuclear arsenal.
Critical Numbers For Crypto Bull Market To Stay Alive
It was another chaotic weekend for the crypto markets. While football fans were busy watching the Manchester United and Liverpool game, a huge crash took place in the crypto markets that wiped off over $15 billion from the market cap. In other words, crypto markets are once again on the back foot to begin the week with a big hole to fill.
The crypto market cap started the year at $126 billion and reached a peak of $143 on February 24, before dropping back to $128 billion today. The key questions were what drove this move and whether the effect of JPM’s coin has vanished?
Well, the reality is there is nothing abnormal about huge moves in the crypto market over the weekend, mainly because of thinner volume and bigger order sizes. So, a move like this does not shake HODLERs’ foundation.
In fact, for them, it is more of an opportunity, as long as there is no substantial deviation in the fundamentals. Looking at the sentiment, it is only improving.
Having said this, bull traps are certainly set by bears and if you look into the price action for the crypto market over the last 24 hours, it may seem like a trap. It appears that the price was driven up by algos and bulls fell victim to this. But for me, this may not be true, there is more to this.
Speaking from a technical perspective, all top three crypto coins (Bitcoin, Ethereum and Ripple) have returned to their previous ugly price range. For Ripple, the critical level is $0.30. It needs to stay above this point in order to convince traders that the bull run has strength. Similarly, Ethereum’s price needs to stay above last week’s low at $125. As for Bitcoin, the critical number is the low of February 18th at $3,565.
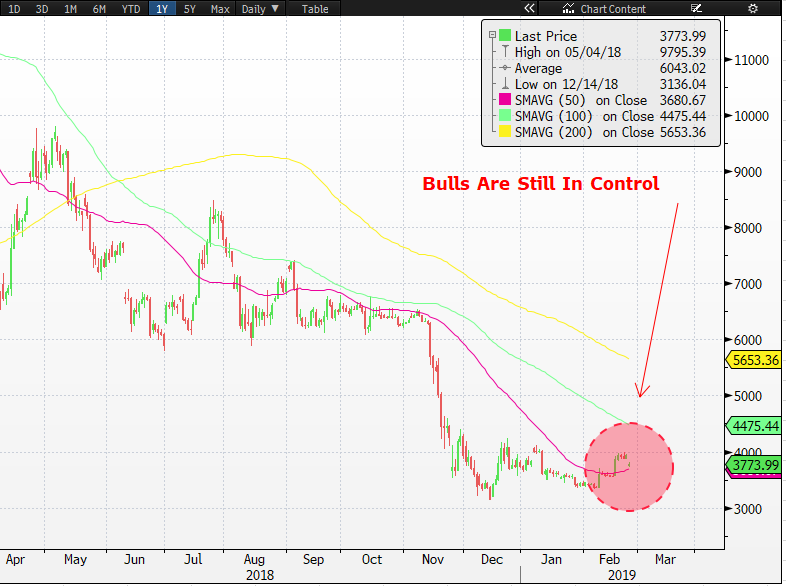
Looking at the daily chart for Bitcoin, it becomes clear that the price is trading above the 50-day moving average, but still well below the 100-day and 200-day moving averages. This confirms that the bulls are still somewhat in control of the price and as long as it stays above the 50-day moving averages, the hopes are for the bitcoin price to continue its move higher.
Theresa May And Donald Trump Lose Oscar For Best Drama
Global equities are starting this new trading week better bid, along with the Chinese yuan, after President Trump yesterday postponed the March 1st date for hiking tariffs on Chinese imports as he sees progress in U.S-China trade talks.
This is certainly development, however, be forewarned, China sees the final stages of trade talks as possibly ‘harder.’
On the geopolitical front, sterling (£1.3073) is still afloat as U.K PM Theresa May pushed back the deadline for Parliament to vote on her Brexit deal by two-weeks to mid-March. It’s a gamble she hopes will buy more time for negotiations – on the flip side, she risks fuelling another revolt.
There are whispers that Article 50 could be extended to avoid a hard Brexit on March 29. The U.K are talking two-months, while Brussels is supposed to be leaning towards two-years!
On Tuesday, President Donald Trump and North Korea leader Kim Jong Un are expected to meet for a second summit.
On the central bank front, Fed Chair Powell will deliver his semi-annual testimony on monetary policy and the state of the U.S economy over two days (Feb 26/27) to House and Senate committees. In addition, several of his colleagues will also be speaking this week.
On tap this week: U.K inflation hearings & U.S consumer confidence (Feb 25), CAD CPI, U.K Parliamentary Brexit vote, ANZ business confidence & AUD private capital expenditure (Feb 27), U.S advanced GDP (Feb 28), CAD GDP & U.S ISM manufacturing PMI (Mar 1).
1. Stocks get the green light
In Japan, the Nikkei rallied to a 10-week high overnight on news that President Trump confirmed he would delay a planned tariff increase on Chinese imports. The Nikkei share average rallied +0.48%, while the broader Topix rose +0.7%.
Down-under, Aussie resource shares ended higher overnight on China trade optimism. The S&P/ASX 200 index rose +0.3% at the close of trade. The benchmark firmed +0.5% on Friday. In S. Korea, the Kospi index closed +0.9% higher.
In China, stocks posted their biggest single-day gains in more than three-years overnight after “productive” Sino-U.S trade talks. China’s Shanghai Composite index surged +5.6%, while the blue-chip CSI300 index also posted its biggest one-day rise, closing out +5.9% higher.
Note: SCI fell -11% in Q4, 2018, however ytd the index is up +18.7%, while the CSI300 has rallied +23.4%.
In Hong Kong, investors reaction was a tad more muted, with the Hang Seng index +0.5% higher, while the Hang Seng’s China Enterprises index was +1.9% higher.
In Europe, regional bourses trade higher across the board following a strong session in Asia and higher U.S futures. Investors await trade talks signal.
U.S stocks are set to open in the ‘black’ (+0.35%).
Indices: Stoxx600 +0.22% at 371.0, FTSE +0.13% at 7185, DAX +0.36% at 11455, CAC-40 +0.31% at 5213, IBEX-35 +0.49% at 9212, FTSE MIB +0.91% at 20256, SMI +0.2% at 9354, S&P 500 Futures +0.35%
2. Oil dips on U.S exports, but trade talks offer support, gold higher
Oil prices have eased a tad, weighed down by plentiful supply as U.S exports soar. However, providing support on pullbacks is investor optimism that the U.S and China would soon resolve their trade disputes that have hurt global economic growth.
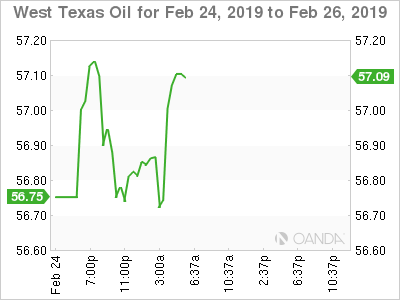
Brent crude oil futures are at +$66.94 a barrel, down -18c, or -0.3%, from Friday’s close. U.S West Texas Intermediate (WTI) crude futures are at +$57.15 per barrel, down -11c, or -0.2%, from their last settlement.
U.S. crude oil production has hit a record +12M bpd, an increase of more than +2M bpd since early 2018. Exports hit a record +3.6M bpd this month. These record numbers are forcing other producers, especially in the Middle East, to start offering their crude at discounts.
Note: OPEC+ led cuts as well as U.S sanctions against Iran’s and Venezuela’s oil exports helped push oil prices to new 2019 highs last week.
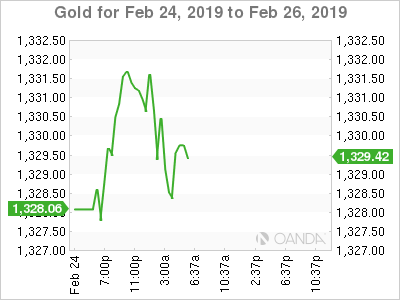
Ahead of the U.S open, the ‘yellow’ metal has edged higher as the ‘big’ dollar comes under pressure vs. G10 and the yuan after President Trump said he would delay an increase in tariffs on Chinese goods. Spot gold has rallied +0.2% to +$1,330.26 per ounce, while U.S gold futures are steady at +$1,332.70.
Note: A stronger yuan (+0.2% to ¥6.689) makes bullion cheaper for China, the world’s leading consumer.
3. Italy’s BTP’s rally after Fitch rating
Italian government bonds are outperforming their broader euro zone bond partners this morning, rallying up to -11 bps after ratings agency Fitch affirmed Italy’s credit rating at BBB.
Italy’s 10-year BTP yield is down -11 bps to +2.74% percent, pushing its spread over higher rated Germany to a three-week low of +259.5 bps.
Note: The rally in Italian debt reverses last Friday’s sell-off ahead of Fitch’s review of Italy’s credit rating. They affirmed Italy’s BBB credit rating with a “negative,” nothing that it reflects “the extremely high level of general government debt and the absence of structural fiscal adjustment” as well as “uncertainty arising from the current political dynamic.”
Elsewhere, productive trade talk comments from President Trump is also giving a lift to riskier assets – German Bund yields have pulled away from last week’s lows and have backed up +0.025% to +0.122%, while the yield on 10-year Treasuries is little changed at +2.66%.
4. Sterling finds some support, EUR little changed, Yuan higher
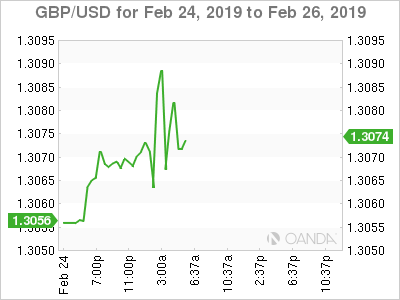
The pound has rallied slightly on the news of U.K PM Theresa May accepting that March 12 will be the final day her Brexit withdrawal deal will be put to the test. The pound is up by +0.2% at $1.3081. EUR/GBP is flat at €0.8682. The relief comes from hopes that the Article 50 deadline (Mar 29) “will likely be extended given that the vote could take place just 17 days before the U.K. is officially due to exit the European Union.”
EUR/USD continues to hover atop of €1.13, largely unmoved by the delay in higher U.S tariffs on Chinese imports. Last week, data from both sides of the Atlantic came in soft and both the ECB and Fed members stressed the risks of slowdown in their own economies. EUR/USD is last up +0.2% at €1.1352.
Overnight, China held the yuan roughly flat, though the PBoC did set its latest strongest fix since Feb. 1. The PBoC put the dollar’s trading midpoint at ¥6.7131 vs. Friday’s ¥6.7151. In the offshore market, it strengthened outright on Trump’s comments, rising +0.3% to ¥6.6878.
5. Kiwi retail sales for December beat expectations
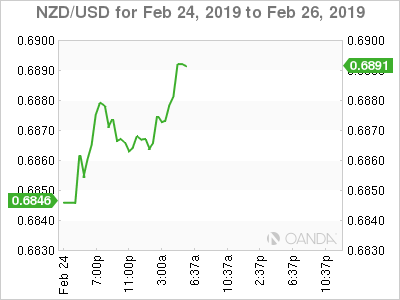
Data on this week’s open down-under from Stats New Zealand showed that Kiwi retail sales volumes rose more than expected in Q4 2018, supported by spending on pharmaceuticals, duty-free goods, and food services.
Retail sales volumes rallied a seasonally adjusted +1.7% in Q4 from a revised +0.3% gain in Q3, 2018 – market expectations were looking for a +0.5% headline print.
According to analysts, helping retail sales top expectations were lower retail-fuel prices, a tight labor market, continued government-spending support and higher producer incomes.
Stats NZ indicated that strong spending in Q4 led to 11 of the 15 retail industries recording higher sales volumes – for instance, they grew a record +8.2% for pharmaceutical, while food and beverage services jumped +4.2%.