Sample Category Title
USD/JPY Outlook: Triangular Consolidation Extends, Weakening Momentum Warns Of Pullback
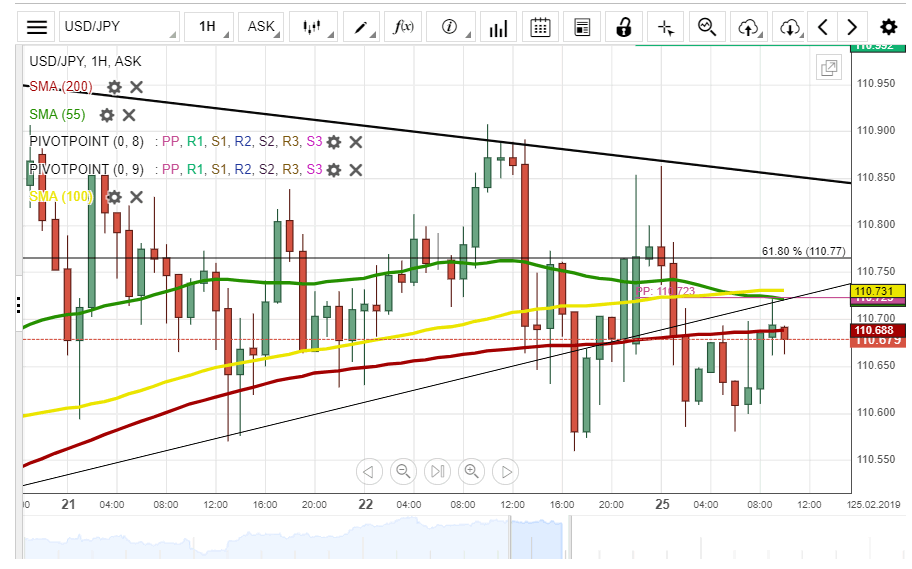
The pair remains directionless and within narrow range on Monday, on track to mark another daily action by tight Doji.
Bulls continue to lose momentum since double rejection (13/14 Feb) on approach to 200SMA which sees increasing downside risk.
Also, the greenback is weighed by further optimistic tones from US/China trade talks.
The near-term action pressures pivotal support, provided by support line of triangular consolidation (110.54) break of which would generate initial bearish signal and expose lower pivot at 110.22 (15 Feb consolidation low/broken Fibo 61.8% of 113.70/104.59) and confirm pullback on break. Alternative scenario would require break through triangle resistance and lift above 111.12 (14 Feb high) to re-expose key 200SMA barrier (111.30).
Res: 110.90, 111.12, 111.30, 111.55
Sup: 110.54, 110.22, 109.89, 109.64
GBP/USD Remains Bullish After Bounce At 38.2% Fib
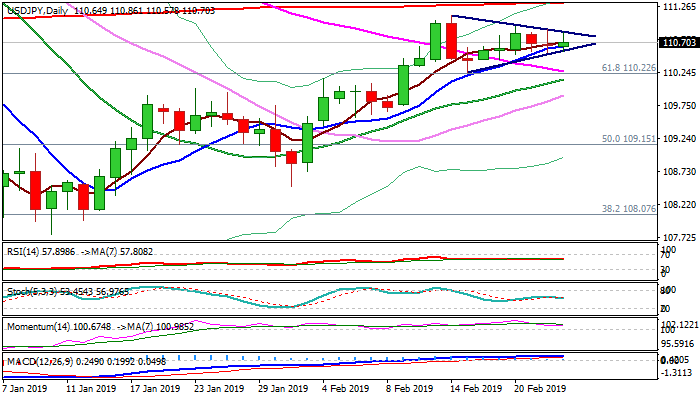
A GBP/USD retracement could see price retest the support zone, which could be a bouncing spot for an upside as well. The bullish view is invalidated if price is able to break below all of the support zones. In that case a larger bearish correction is taking place.
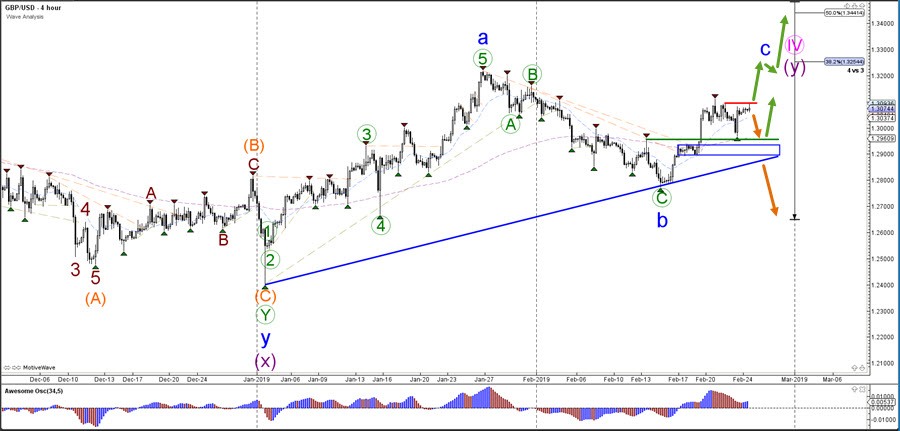
The GBP/USD most likely completed a wave 4 (green) at the 38.2% Fibonacci retracement level. This is way for the moment the GBP/USD is either expecting a bullish breakout as part of wave 5 (green) of wave C (blue) or a bearish retracement to test the support zone again.
BoE, FCA and CFTC announced measures to ensure continuity of derivatives trading and clearing post-Brexit
Bank of England, UK's Financial Conduct Authority and US Commodity Futures Trading Commission announced measures today to ensure Brexit, in whatever form "will not create regulatory uncertainty regarding derivatives market activity between the UK and US". Measures include continued supervisory co-operation, extension of existing CFTC relief to EU firms to UK after Brexit. Also, US trading venues, firms and CCPs will be able to continue providing services in the UK.
In a joint statement, BoE Governor Mark Carney said "As host of the world's largest and most sophisticated derivative markets, the US and UK have special responsibilities to keep their markets resilient, efficient and open.
"The measures we are announcing today will do that. Market participants can be confident that the clearing and trading of derivatives between the UK and US will maintain the high standards of today when the UK leaves the EU".
Carney also warned that "The biggest issue from a financial stability perspective, from a market integrity perspective, from a continuity perspective, is a no-deal scenario by the end of March."
Full statement here.Full statement here.
https://www.youtube.com/watch?v=XyPdOyQty3o
How to Determine Trends on Forex Market
A trend, on the Forex market, is a dominant direction of price movement. For example, if the price is rising, then the trend is ascending — and vice versa. The ability to determine trends at their very beginning is the main quality that differentiates a successful trader from an amateur.
There are quite a lot of methods for trend identification — from the casual visual inspection and to specialised custom indicators. This article will review the most interesting and usable ones.
Visual Analysis
Visual analysis is the most simplistic ways to determine a trend. All you need is a chart and your eyes — even one will do. To identify a trend visually:
- Spot the highs on the segment of the chart you analyzing;
- Spot the bottoms on the segment of the chart you are analyzing;
- Draw one line through the highs, the other through the bottoms.
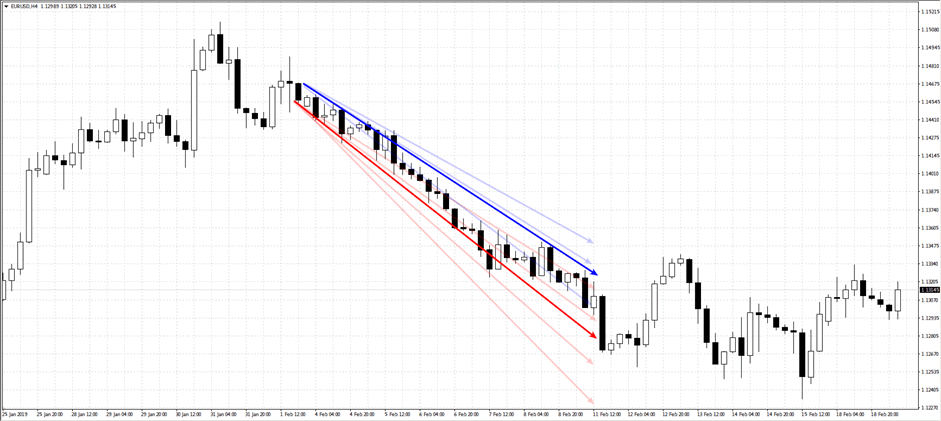
Transparent lines show trends at different timeframes, opaque lines indicate their average values.
The direction of those lines would be the trend. If both lines are moving up — the market is experiencing an upward trend. If both are moving down — downward trend. If lines are moving away from each other — the market is ranging. If the lines are moving sideways — the market is flat.
The problem with a visual analysis is the sample size. You need the trend to be going for a while in order to identify it visually, and this deprives you of a lot of profits you’d get if you saw it early. That’s why professional traders are using indicators to identify trends.
Moving Averages
Moving averages represent the average cost of the asset throughout the certain number of candlesticks. For example, the popular 50 MA indicator shows the average value of the last 50 daily candlesticks.
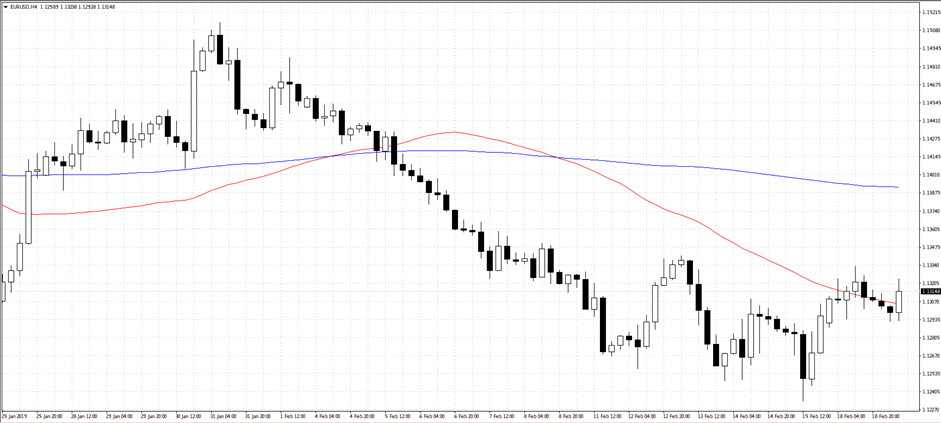
The red line represents the 50 MA, the blue line represents the 200 MA. Those averages are the most influential on the market.
Moving averages are easy to use. When the price goes above the moving average, the trend is ascending. When the price is below the moving average, the trend is descending.
MACD
Identifying trends by moving averages is a good option, but there are ways to make it even simpler and more precise. MACD (Moving Averages Convergence/Divergence indicator) shows you the difference between 200 MA and 50 MA — two most influential moving averages on the market.
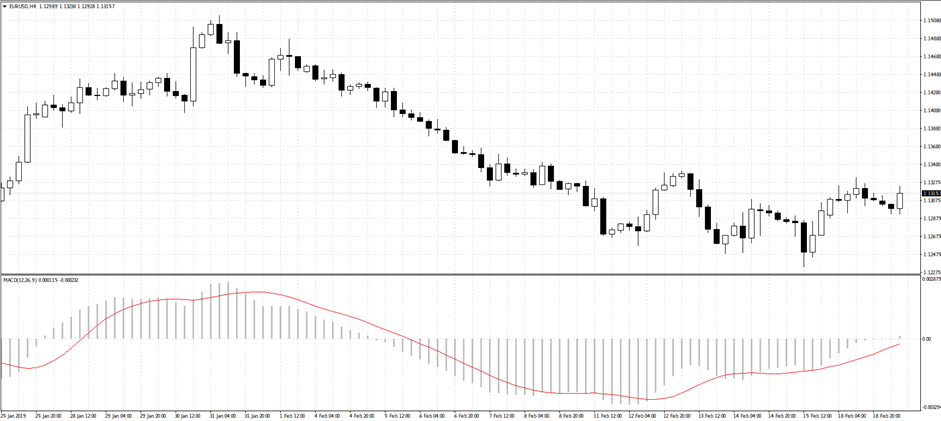
Compare the MACD indication with the moving averages from the previous picture.
Once the point 0 is crossed, MACD indicates the beginning of a new trend. If the trend moves towards the positive sector, the trend is ascending. If it moves towards the negative sector, the trend is descending.
Originally MACD did not differentiate between weak and strong trends but the modern versions of the indicator have signal lines — sectors which indicate prevalent trends. Inexperienced traders should use only those trends that reach the signal lines since they offer much more reliable performance.
Momentum
The Momentum indicator is a little unconventional when it comes to identifying trends. It measures the rate at which the price changes, which often precedes the beginning of a new trend.
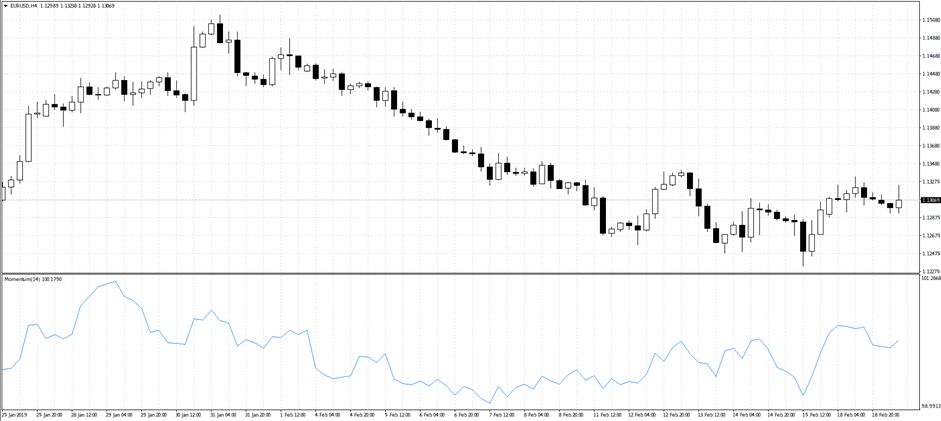
The Momentum indicator corresponds pretty well to the trends but is less precise than the other indicators.
Momentum is an auxiliary indicator, and not it’s not very useful if you can already identify trends visually.
Conclusion
With custom indicators, identifying the trends on Forex is easier than ever. However, if you want to try trend-trailing, you need a reliable broker with fast and reliable order processing. If you haven’t got one yet — check out JustForex. They’ve got a decent educational program, responsive support, and low spreads. And, most importantly, they will double your deposit, as long as it is more than 10 USD.
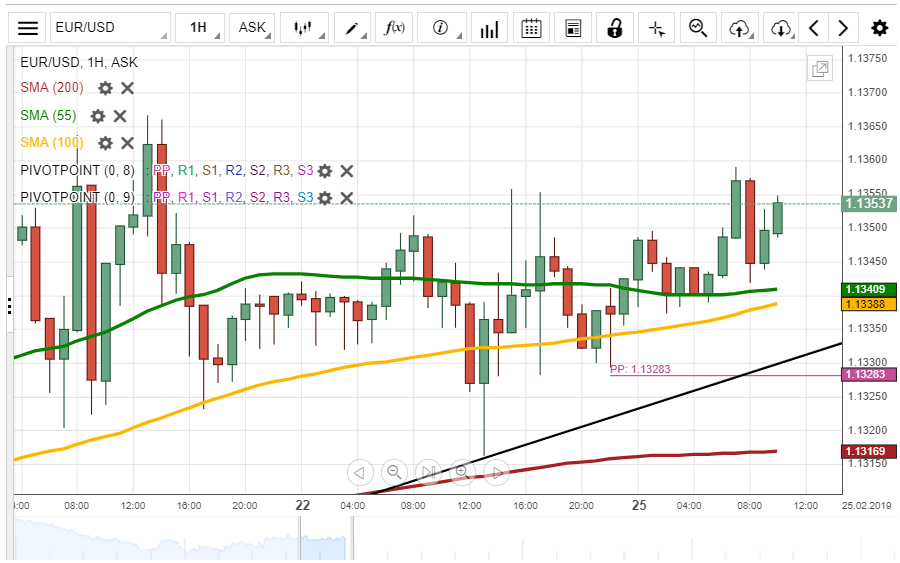
EUR/USD Is Expected To Go Up
On Monday, the EUR/USD no longer had close by resistance levels on the hourly chart. Namely, the weekly pivot points had changed, and the closest by technical resistance was located at the 1.1380 mark.
During the morning hours of the day's trading the pair was set to surge to the pivot point at 1.1380. It should occur by using the support of the 55 and 100-hourly simple moving averages, which were located at the 1.1340 level.
Meanwhile, note that above the 1.1380 level there are no additional resistance levels as far as 1.1430.
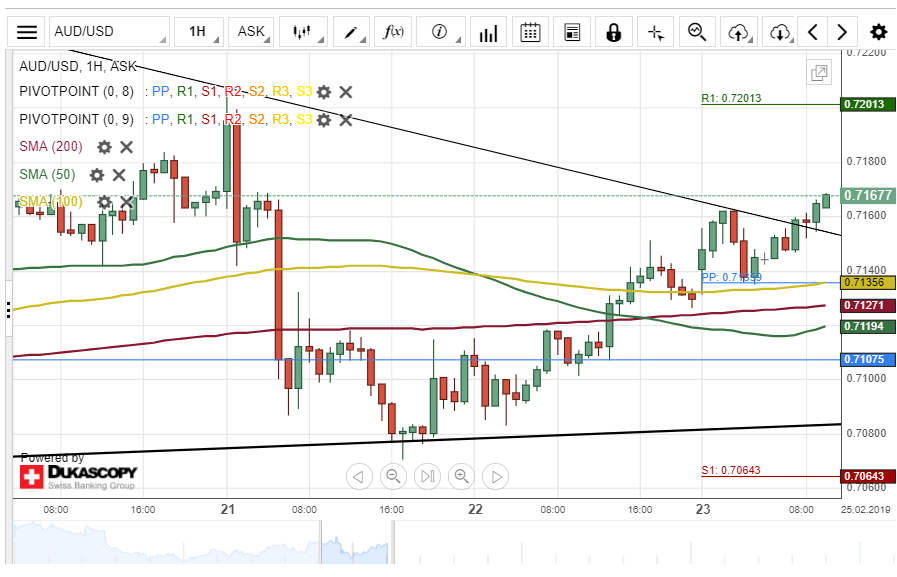
AUD/USD Moving Towards Target
The Australian Dollar appreciated about 68 base points against the US Dollar on Friday. The currency pair breached a resistance cluster formed by the weekly, the monthly PPs and the 100-hour simple moving average at 0.7134.
Today's session began with bullish sentiment, and by the middle of the trading session, the exchange rate has breached the upper boundary of a downtrend line at 0.7152.
Everything being equal, it is likely that the currency exchange rate continues its upside movement within this session. The potential upside target in the next 24hrs will be at a swing high of 0.7201.
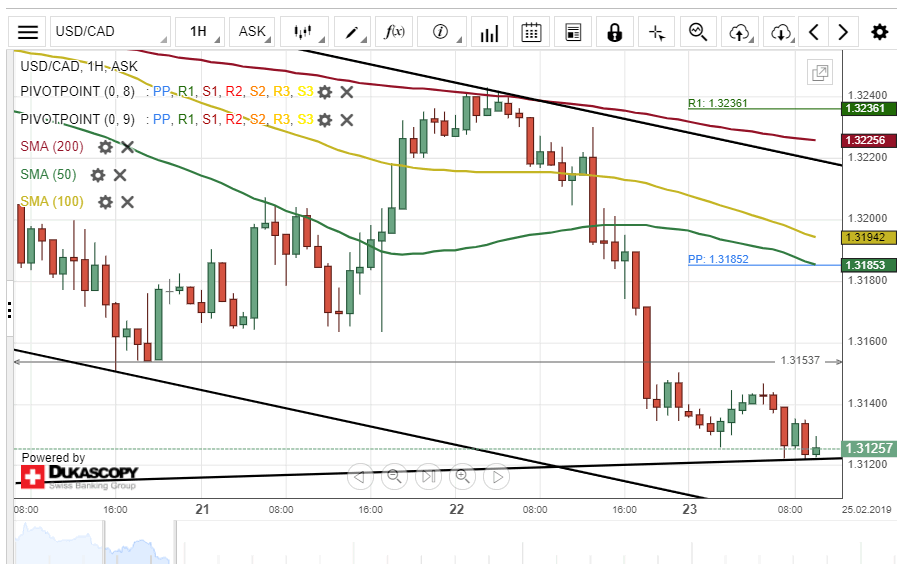
USD/CAD Set For Breakout
The US Dollar depreciated about 100 base points against the Canadian Dollar on Friday. The currency pair was pressured down by the 200-hour simple moving average during the previous session.
Currently, the exchange rate is trading near the lower boundary of an ascending channel pattern at 1.3132 and could be set for a breakout.
If this breakout occurs, it is likely that bearish traders could aim for a support level at 1.3063 today.
Though, if the ascending channel pattern holds, the currency exchange rate will target both the 50– and 100-hour SMAs at 1.3196 within this session.
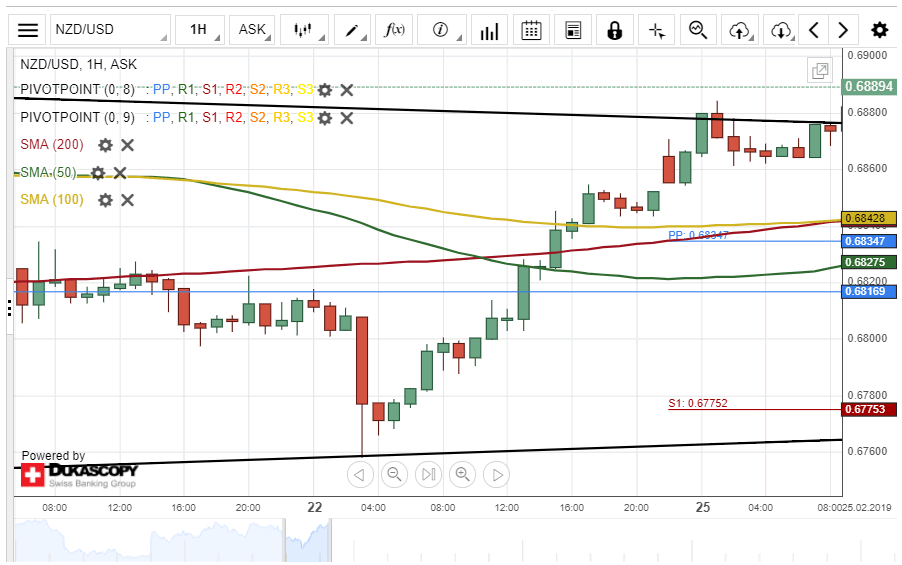
NZD/USD Expects Decline
The New Zealand Dollar appreciated about 95 base points against the US Dollar on Friday. The currency pair breached the 50-, 100– and 200-hour SMAs during Friday's trading session.
Monday's trading session started with bullish sentiment, and by the middle of the European session, the exchange rate has breached the upper boundary of a downtrend line at 0.6878.
As for the short term future, it is likely that the currency exchange rate makes a brief retracement down towards a hidden base of 0.6854. Traders should look for opportunities to trade if the given base hold.
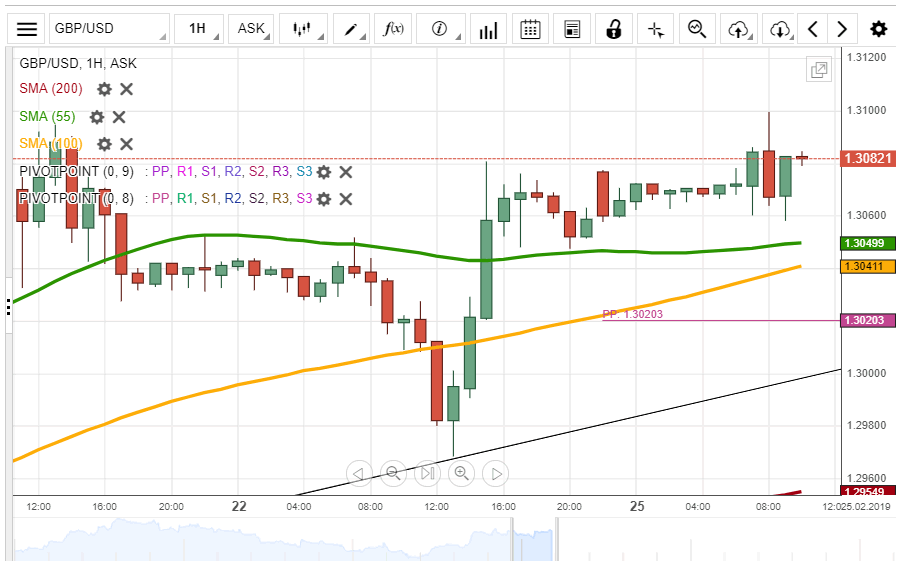
GBP/USD Struggles With 1.3100 Level
The GBP/USD pair is struggling to pass the resistance of the 1.3100 level. The round mark was providing a psychological resistance to the rates surge.
If this level gets passed due to any reason then the pair should aim at the weekly R1, which is located at the 1.3149 level. It could occur, as the 55 and 100-hour simple moving averages approach the rate and push it higher.
On the other hand note that the pair might fail at the attempts of surging and remain in the range between the SMAs at 1.3050 and the 1.3100 level.
USD/JPY Has No Technical Support
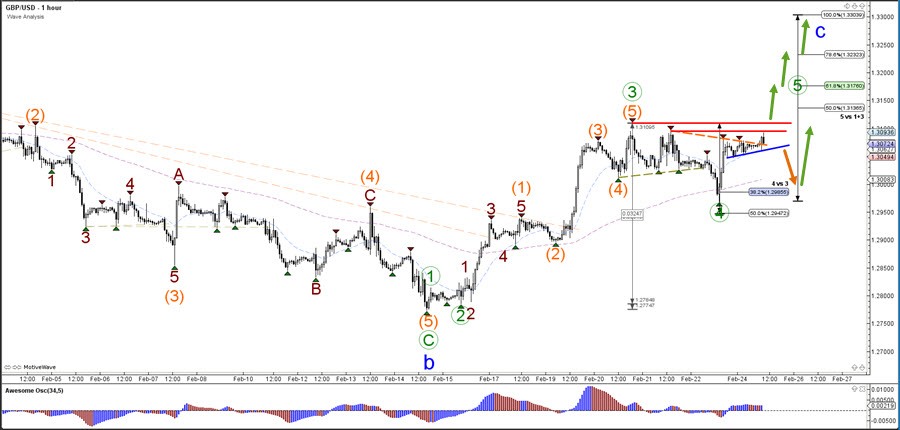
The US Dollar has followed the technical patterns against the Japanese Yen. Namely, the pair has bounced off the upper trend line of a dominant pattern and passed below the support of a junior ascending channel.
On Monday the rate was facing a strong resistance level a t the 110.70 level. There three SMAs together with a Fibonacci retracement level and the weekly PP. It is highly unlikely that this level will be broken.
Instead, the pair is more likely set to decline as low as the weekly S1 at the 110.50 mark. Afterwards, the weekly S2 at 110.23 should be targeted