Sample Category Title
Trump Tariff Delay Keeps Risk Party Going Strong
- USD – Risk-on as Trump delays tariff increase
- STOCKS – Rally keeps going
- GOLD – Holding up nicely despite all the positive trade news
- OIL – Trump perfectly timed his tweet
- Bitcoin – Textbook Short-Covering Mov
USD
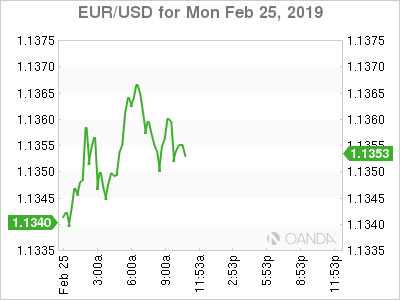
Safe-haven currencies are under pressure to start the trading week as key progress has been made in the US- China trade war. President Trump signaled he will delay any potential increase in tariffs on Chinese goods, a removal of the key risk event of the trading week. The trade war is far from over, but continued progress in the right direction continues to support high-beta currencies against both the US dollar and Japanese yen. The Canadian dollar is the lone standout, and heavily under pressure following the move with declining oil prices.
STOCKS
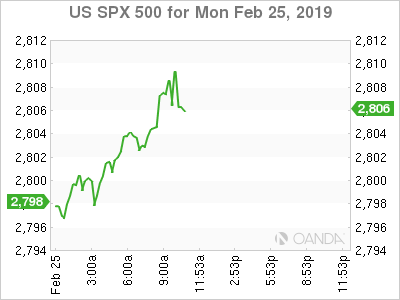
US stock indexes are continuing their V-shaped rally as trade progress was signaled by President Trump over the weekend. The President tweeted, “I will be delaying the U.S. increase in tariffs now scheduled for March 1st.” Financial markets have become overly positive that both China and the US are highly motivated to move forwarded in wrapping up the trade war. Earnings growth forecasts have been halved this year to 5% and while the financial markets have heavily priced in a soft first half of the year, momentum could grow as global slowdown concerns ease as trade war concerns enter a state of calm and accommodative behavior from both the Fed and PBOC keep the party going.
GOLD
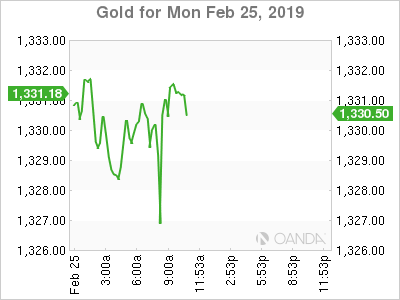
Gold prices are holding up fairly well despite a wrath of optimism with progress in the US-China trade war. The precious metal continues to be supported by accommodative stances from the central banks from the advanced economies along with China. The Fed’s pivot in January was tantamount for gold and any further cementing that the next move from the Fed will be a rate cut could help the yellow metal continue to rise.
The Thursday release of fourth quarter GDP could help solidify expectations for the next move to be a rate cut. Current expectations are for GDP to fall from 3.4% to 2.4%.
OIL
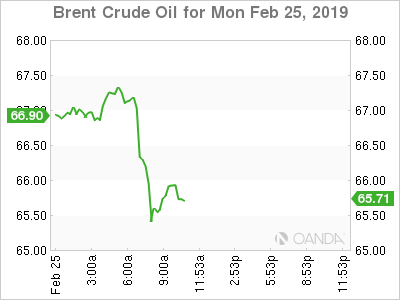
Just when financial markets were starting to become immune to President Trump’s comments, he delivered a gem that sent crude prices sharply lower. The President tweeted, “Oil prices getting too high. OPEC, please relax and take it easy. World cannot take a price hike – fragile!”
Before the morning tweet, crude prices were near 3-month highs after Goldman Sachs noted that oil could rise as much as 13%, with Brent possibly rising to the $70-75 range. The research note focus on oil supplies being tight in March and April. The end of year forecast for Brent was maintained at $60 a barrel.
Oil’s recent leg higher stemmed from optimism on trade talks between China and US. With President Trump signaling he will delay the US increase in tariffs, markets are becoming highly positive that deal will be done.
Bitcoin
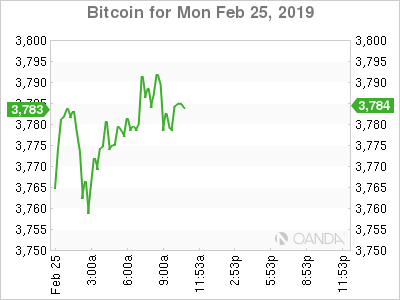
Bitcoin continues to be hampered on growing regulatory concerns, falling usage, security weakness and rising competition. Over the weekend, the price of one Bitcoin rose above the $4,000 mark, in what appears to be a textbook short-covering move. The cryptocurrency remains vulnerable and could see short-sellers once again return to the market.
Sunset Market Commentary
Markets
Global core bonds lose ground today as risk sentiment improved drastically overnight. US President Trump officially extended the March 1 deadline for China, (temporarily) avoiding tariff increases on Chinese import. Asian bourses rallied with Chinese indices gaining up to 6%(!),but the impact on European markets remained rather limited. The uptick in sentiment did weigh on core bonds, with German Bunds edging lower. The German yield curve moves higher with changes in the range of +0.7 bps (2-yr) to +2.0 bps (30-yr). With an empty eco calendar, risk sentiment was today’s only driver. US equity markets opened also higher, weighing on US Treasuries. The US yield curve moves north with changes up to 2.3 bps (10-yr). Italian BTP futures opened higher this morning as Italy escaped a credit rating downgrade from Fitch on Friday (after markets). The BTP reversed some of it opening gains as political uncertainty grew after Deputy PM Di Maio’s 5SM lost hard in regional elections in Sardinia. Peripheral spreads over the German 10-yr yield are tightening with Italy (-9 bps) outperforming.
EUR/USD traded with a cautious positive bias this morning on positive headlines regarding the US-China trade talks. However, European markets were reluctant to join the optimism on Chinese markets. EUR/USD came with reach of last week’s ST top in the 1.1365/70 area, but a real test/break didn’t occur. Interest rates differentials also moved slightly in favour of the US dollar, tempering the case for any meaningful USD losses. EUR/USD is currently trading in the 1.1360 area, marginally stronger than Friday’s level. USD/JPY is holding in the upper half of the 110 big figure as the pair profits, albeit very modestly, from the risk-on sentiment and higher core/US bond yields. In a broader perspective, the dollar is still captured in an indecisive sideways trading pattern as conflicting signals both on trade issues and on global economic developments continue to prevent a clear direction move.
'To delay Brexit or not to delay Brexit’, that appears to be the key question for UK politicians and for sterling traders at the start of yet another ‘key’ week in the Brexit saga. Of late, sterling performed rather strongly as investors assumed that both the EU and the UK would do everything to avoid a no-deal Brexit at the end of March. A delay was and still is one of the options to avoid such a no-deal scenario. However, today sterling didn’t make any further progress anymore. Visibility on the outcome of this week’s appearance of UK PM May before Parliament (tomorrow and on Wednesday) is close to non-existent. A scenario of high profile UK political chaos (including UK ministers and conservative MP’s leaving the government and/or the conservative party) is also still possible. In directionless trading, EUR/GBP hovered in the upper part of the 0.86 big figure. Cable is trading little changed in the 1.3075 area.
News Headlines
The Polish yield curve bear steepened after Polish ruling party leader vowed a fiscal stimulus boost to keep Polish GDP growth north of 4% this year. Yields add up to 12 bps at the 10-yr tenor. The Polish zloty strangely enough fails to profit even if such policy probably makes it more difficult for the Polish central bank to extend its ultra-easy monetary policy. Currently, the NBP envisages unchanged policy rates at least until the end of 2020.
A Spanish election poll showed on Sunday that Socialist PM Sanchez’ party would become the largest group in 350-seat Congress, obtaining 114 seats. An alliance with anti-establishment Podemos wouldn’t result in a ruling majority as the party polls at only 37 seats, coming from 70 currently. A center right coalition between the Party Popular (73) and Ciudadonos (58) also fails to hit reach the 50% mark with extreme right Vox hijacking 45 seats.
Oil slipped 2% to $65/b after US president Trump said on Twitter prices were getting too high. He urged OPEC to relax on production curbs because the “world cannot take a price hike”. Since the start of 2019, oil recovered from a 17 month low at $50/b to about $67/b as production cuts kicked in and growth worries eased somewhat.
EU Tusk: We’ll face an alternative, chaotic Brexit, or an extension
European Council President Donald Tusk said in a new conference in Egypt that " in the situation we are in, an extension would be a rational decision", referring to Brexit. But he also noted that "Prime Minister May still believes she will be able to avoid this scenario".
Tusk added that "for me, it's absolutely clear that there is no majority in the House of Commons to approve a deal. We will face an alternative, chaotic Brexit, or an extension."
And, "the less time there is until the 29th of March, the greater the likelihood of an extension. And this is an objective fact, not our plan or our objective, but an objective fact."
CAD Under Attack as Oil Tumbles after Trump Tells OPEC to Relax
Oil have fallen by more than -2% so far today, reversing earlier gains after U.S President Trump told OPEC producers to “relax” as prices were too high.
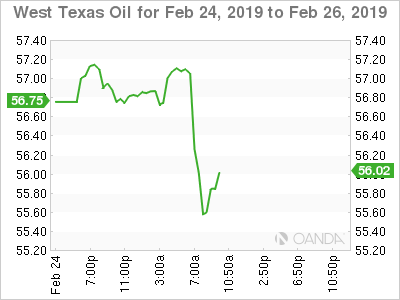
Brent crude oil futures are down -$1.43 at +$65.69 a barrel, having earlier risen to a 2019 high of $67.47. West Texas Intermediate (WTI) crude futures is down -$1.38 at +$55.88 a barrel.
“Oil prices getting too high. OPEC, please relax and take it easy. World cannot take a price hike – fragile!” Trump tweeted.
U.S. crude oil production has hit a record +12M bpd, an increase of more than +2M bpd since early 2018. Exports hit a record +3.6M bpd this month. These record numbers are forcing other producers, especially in the Middle East, to start offering their crude at discounts.
Note: OPEC+ led cuts as well as U.S sanctions against Iran’s and Venezuela’s oil exports helped push oil prices to new 2019 highs last week.
Trump’s tweeted comments this morning follows a rally in crude prices in 2019 supported by a tighter supply outlook although they are still significantly lower than the peak of more than +$85 a barrel hit last October.
Loonie under attack
The commodity sensitive CAD has come under pressure ever since Trump tweeted his concerns at 06:58 am ET. USD/CAD has rallied form an overnight dollar low of C$1.3115 to trade atop of its intraday high of C$1.3155 and still looking to grind higher.

EURNZD Opens With Negative Gap; Remains in Downward Sloping Channel
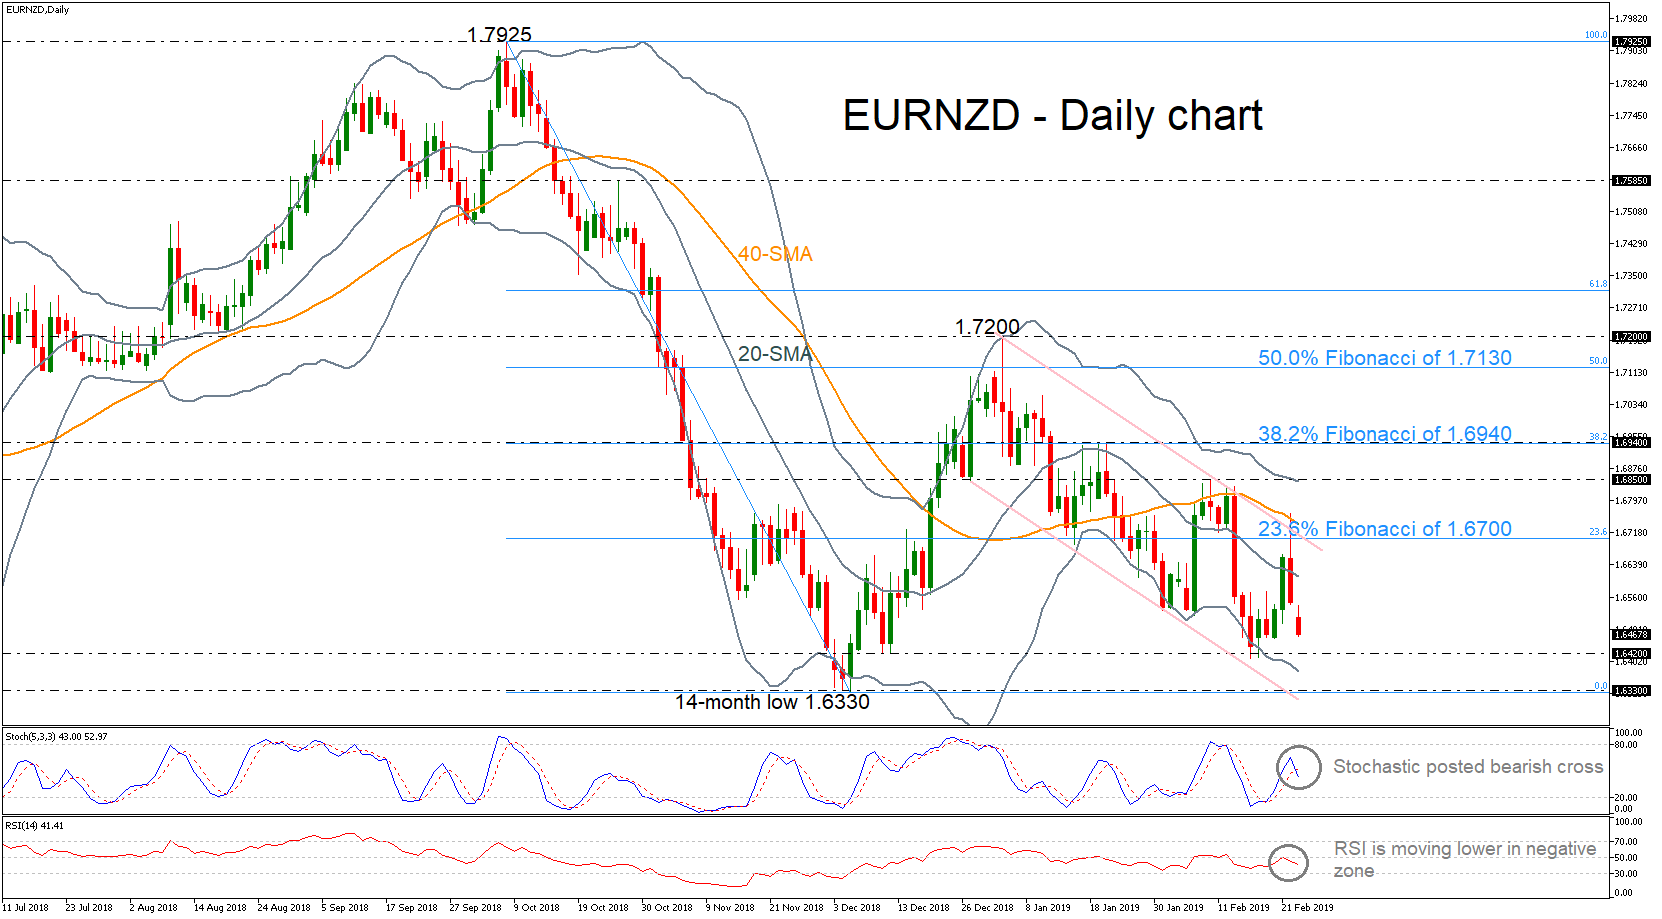
EURNZD opened with a negative gap today continuing the negative movement that started yesterday, following the bounce off the 40-day simple moving average (SMA). Also, the price has been developing within a descending channel over the last couple of months, as the price found a strong obstacle on the 1.7200 psychological level.
Technical indicators in the daily timeframe are reversing back to the downside. The stochastic oscillator is turning lower after the bearish cross within the %K and %D lines, while the RSI indicator is pointing down in the bearish area.
Further losses should see the immediate support level of 1.6420 before resting at the December 14-month low of 1.6330. A drop below this region would reinforce the bearish structure in the medium term and open the way towards the next key support level of 1.6140, identified by the bottom on September 2017.
In the event of an upside reversal, the mid-level of the Bollinger Band could be the immediate resistance to look for, currently at 1.6610. More gains could send prices towards the 23.6% Fibonacci retracement level of the downleg from 1.7925 to 1.6330, near 1.6700. A break above this level would take the pair above the 40-day simple moving average towards the 1.6850 resistance.
In the medium-term picture, euro/kiwi is trying to extend its bearish view, posting a negative tendency. A new lower low below 1.6330 would confirm this structure.
WTI OIL Outlook: US Oil Fell Nearly $2 after Trump Criticized OPEC for Too High Oil Prices
WTI oil price fell nearly $2 on Monday after US President Trump said that oil prices are too high and called OPEC to relax and keep prices steady. WTI contract dipped from $57.48 to the session low at $55.69 after Trump's tweet, in post-news knee-jerk reaction. Fresh weakness broke back below 100SMA ($56.18) that weakened near-term structure, with bearish signal for deeper pullback, expected on daily close below 100SMA. Dips were so far contained just above strong support at $55.55 (broken Fibo 38.2%/top of thick 4-hr cloud), but risk of further easing exists as daily indicators turned south and the latest news soured sentiment. Daily 5SMA crested and turns lower, adding to initial negative signals, which would be confirmed on firm break below 100SMA and violation of $55.55 pivot.
Res: 56.72; 57.51; 57.79; 58.14
Sup: 55.83; 55.55; 54.76; 54.14

USD/JPY Mid-Day Outlook
Daily Pivots: (S1) 110.51; (P) 110.71; (R1) 110.87; More...
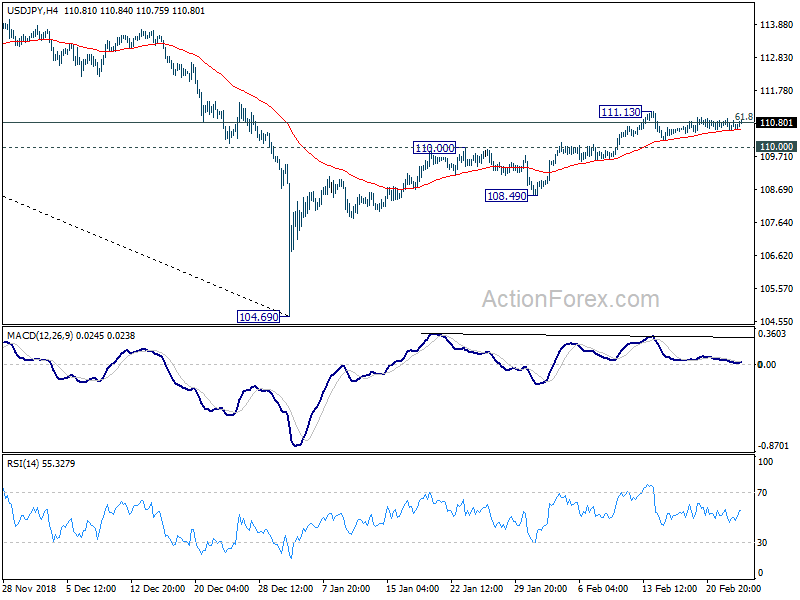
USD/JPY is staying in range below 111.13 and intraday bias remains neutral. On the downside, break of 110.00 resistance turned support will suggest rejection by 61.8% retracement of 114.54 to 104.69 at 110.77 and the rebound from 104.69 has likely completed. Intraday bias will be turned back to the downside for 108.49 support for confirmation. Nevertheless, break of 111.13 should confirm resumption of rise from 104.69 for 114.54 resistance.
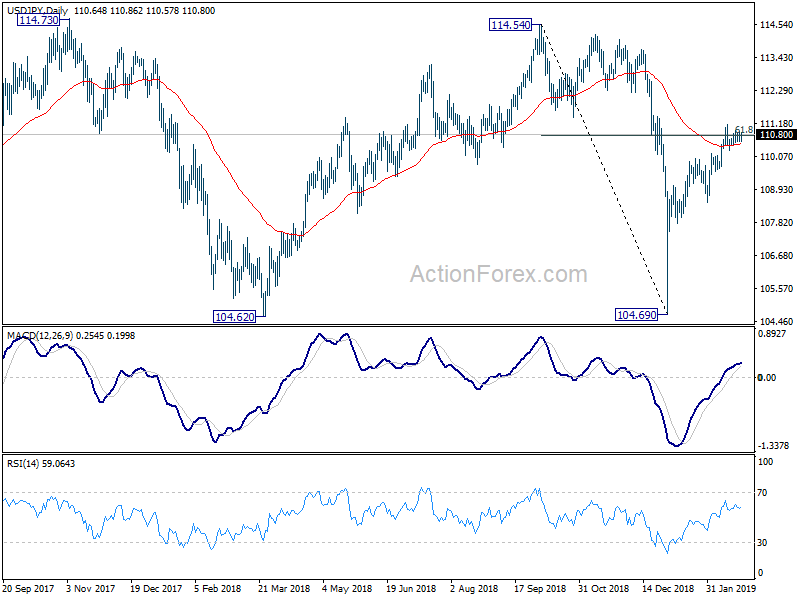
In the bigger picture, while the rebound from 104.69 was stronger than expected, it's struggle to get rid of 55 day EMA completely. Outlook is turned mixed first. On the downside, break of 108.49 support will revive that case that such rebound was a correction. And, larger down trend is still in progress for another low below 104.62. But sustained trading above 55 day EMA will turn focus to 114.54. Decisive break there will confirmation completion of the decline from 118.65 (2016 high).
USD/CHF Mid-Day Outlook
Daily Pivots: (S1) 0.9984; (P) 1.0005; (R1) 1.0022; More....
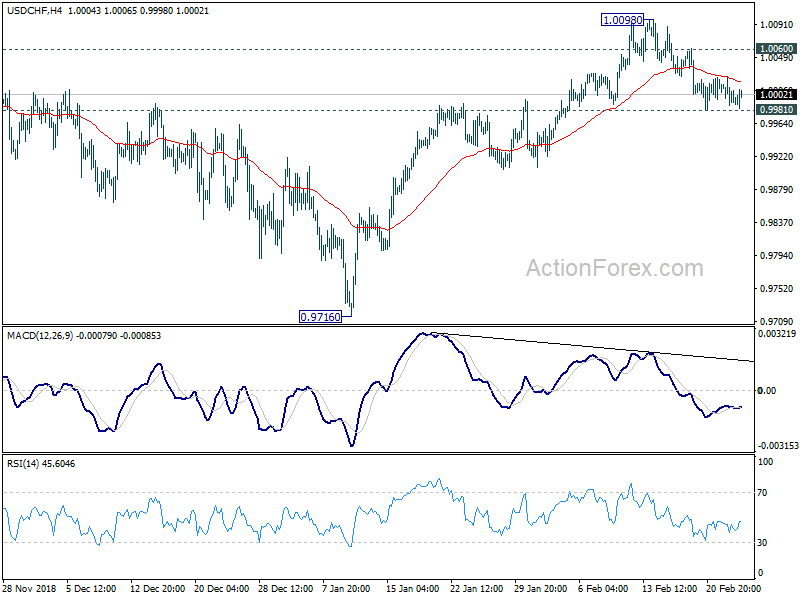
Intraday bias in USD/CHF remains neutral at this point. On the downside, break of 0.9981 will resume the decline from 1.0098. Sustained trading below 55 day EMA (now at 0.9964) should confirm completion of rise form 0.9716, after rejection by 1.0128 resistance. In that case, deeper fall would be seen back towards 0.9716 support. On the upside, break of 1.0098 will extend the rise from 0.9716 to 1.0128 high next.
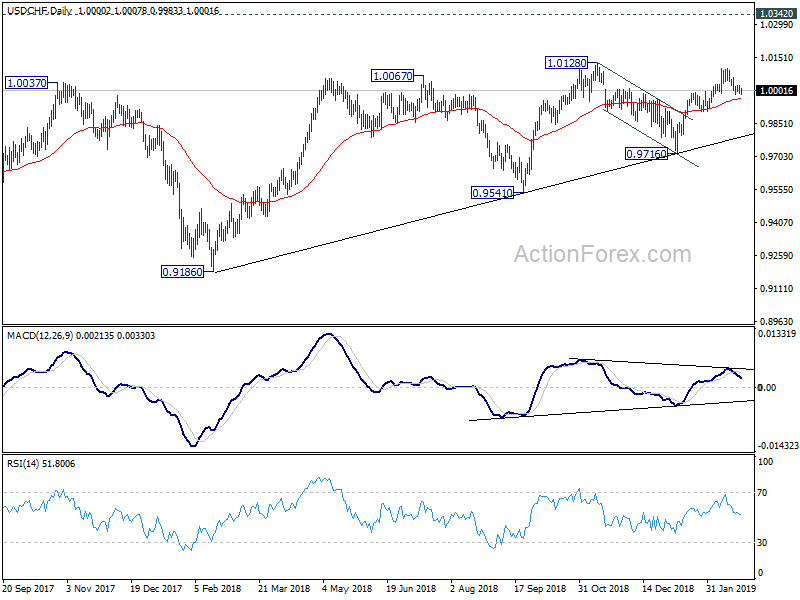
In the bigger picture, USD/CHF drew strong support from medium term trend line and rebounded. That suggests rise from 0.9186 is still in progress. Further break of 1.0128 will confirm up trend resumption and target 1.0342 key resistance. Nevertheless, break of 0.9716 will dampen this bullish view and at least bring deeper fall to 0.9541 key support.
GBP/USD Mid-Day Outlook
Daily Pivots: (S1) 1.2988; (P) 1.3034; (R1) 1.3101; More....
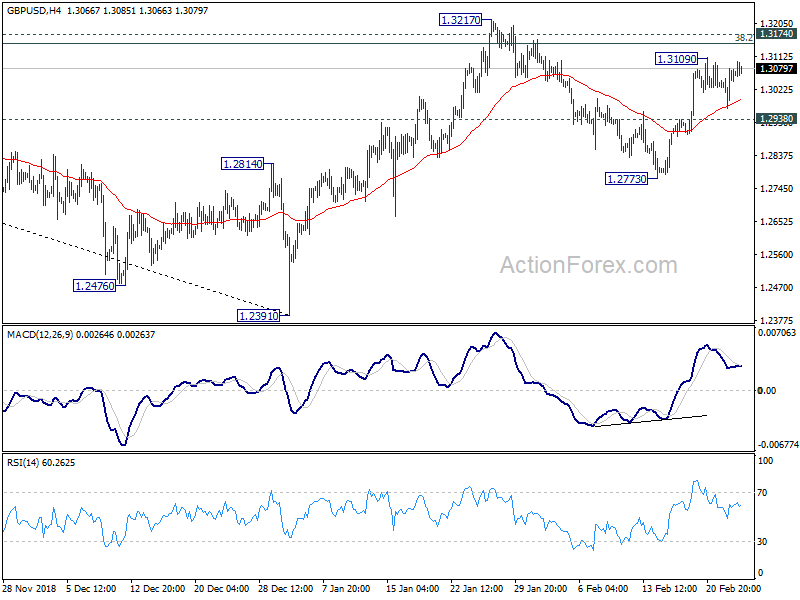
GBP/USD is staying in consolidation below 1.3109 and intraday bias remains neutral at this point. On the upside, above 1.3109 will target 1.3174/3217 resistance zone. Decisive break there will complete a head and shoulder bottom pattern (ls: 1.2661, h: 1.2391, rs: 1.2773). That would indicate bullish reversal for 61.8% retracement of 1.4376 to 1.2391 at 1.3618 next. On the downside, break of 1.2938 minor support will turn bias back to the downside for 1.2773 instead.
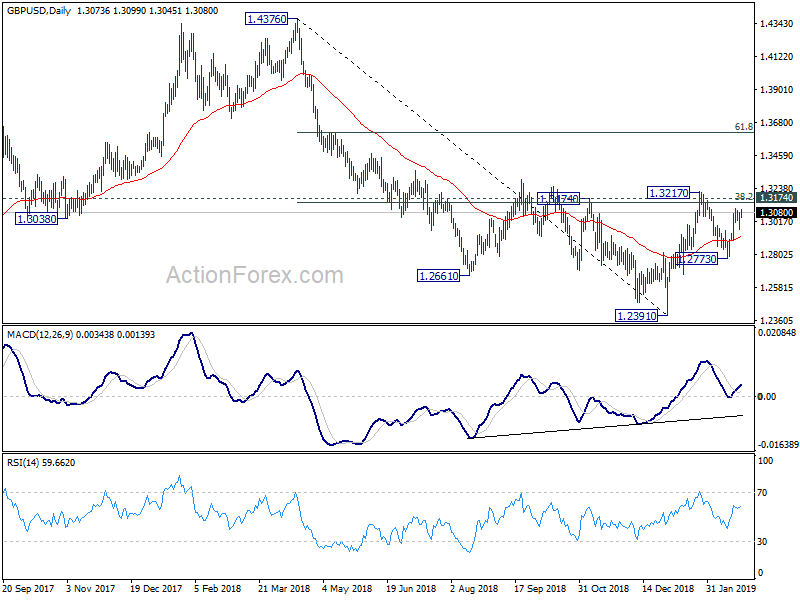
In the bigger picture, focus is back on 1.3174 resistance with current rebound. Sustained break will indicate completion of decline from 1.4376. Rise from 1.2391 would then be seen as the third leg of the corrective pattern from 1.1946 (2016 low). In that case, further rise could be seen through 1.4376 resistance. Nevertheless, rejection by 1.3174 again will extend the decline from 1.4376 through 1.2391 to 1.1946 low.
EUR/USD Mid-Day Outlook
Daily Pivots: (S1) 1.1316; (P) 1.1336; (R1) 1.1355; More.....
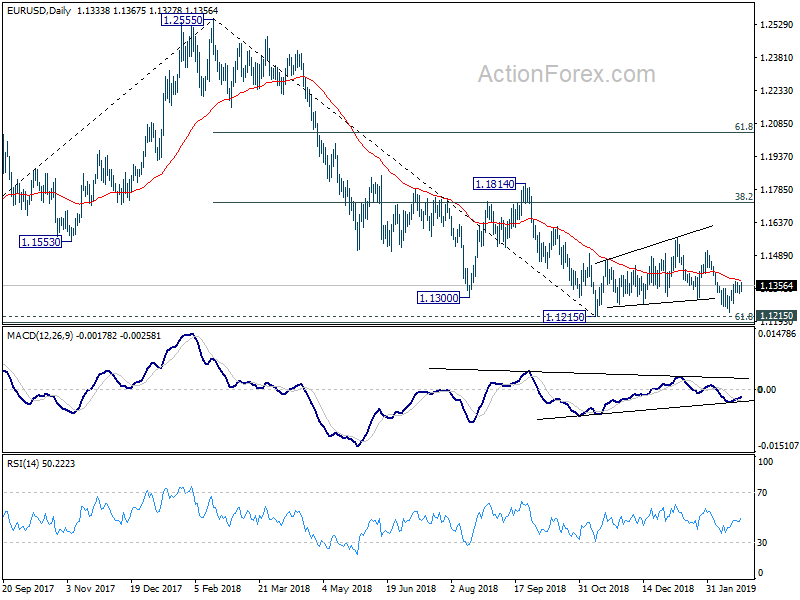
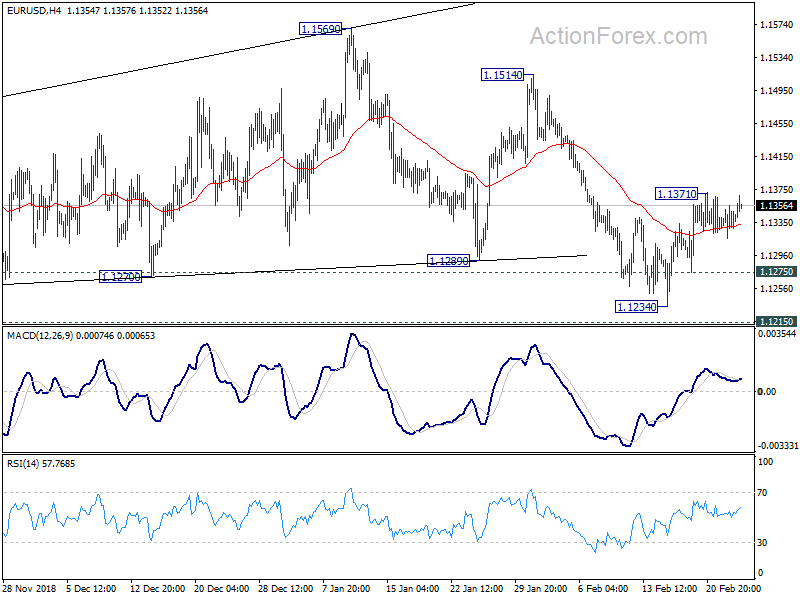
EUR/USD is still staying in tight range below 1.1371 temporary top and intraday bias remains neutral. On the upside, break of 1.1371 would extend the rebound from 1.1234. In that case, rise from 1.1234 is seen as another leg in the consolidation pattern from 1.1215 and should target 1.1514 resistance. On the downside, break of 1.1275 minor support will turn bias back to the downside for 1.1215 low instead. Decisive break there will confirm completion of consolidation from 1.1215, and resumption of down trend from 1.2555.
In the bigger picture, as long as 1.1814 resistance holds, down trend down trend from 1.2555 medium term top is still in progress and should target 61.8% retracement of 1.0339 (2017 low) to 1.2555 at 1.1186 next. Sustained break there will pave the way to retest 1.0339. However, break of 1.1814 will confirm completion of such down trend and turn medium term outlook bullish.