Sample Category Title
Nikkei 225 Wave Analysis
Nikkei 225: ⬆️ Buy
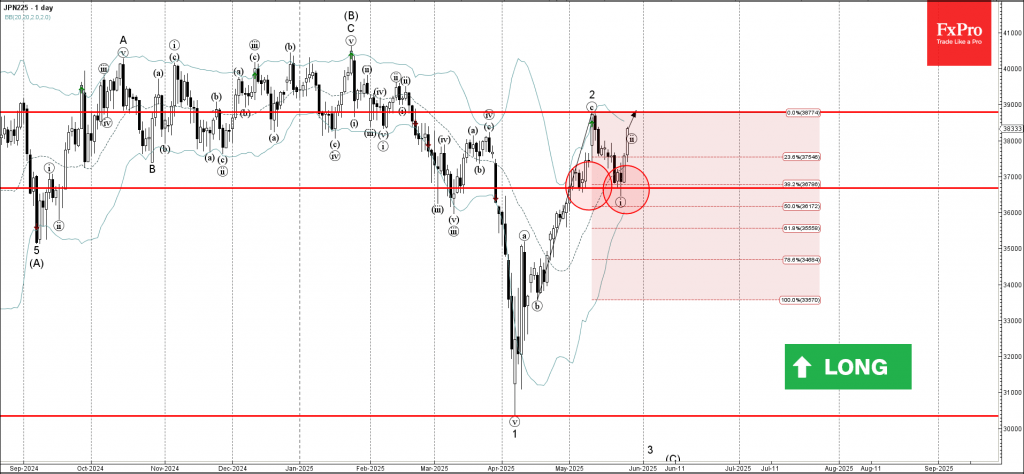
- Nikkei 225 reversed from support level 36675,00
- Likely to rise to resistance level 38800,00
Nikkei 225 index recently reversed up from the pivotal support level 36675,00 (which formed the daily Japanese candlesticks reversal pattern Morning Star at the start of May).
The support level 36675,00 strengthened by the 20-day moving average and by the 38.21% Fibonacci correction of the previous upward impulse from April.
Nikkei 225 index can be expected to rise to the next resistance level 38800,00, top of the previous minor correction 2.
Volatile USD/JPY Moves: What’s Driving the Action
Another day where markets hang on to a positive sentiment following a similar picture from yesterday - risk-assets are in the green and safe-havens are lagging on the day.
The US dollar as recently shines on optimist flows from markets, though as the DXY is still trading below the 100.00 level. The Greenback is leading today's forex action.
On the other hand, the Yen is not showing such a rosy picture. Comments from the Minister of Finance Katsunobu Kato about reducing the issuance on long-end bonds made Japanese yields go down and the Yen got dragged with it.
How do yields moving down influence the Yen?
For a quick-to-understand explanation, longer-end yields have been hedging up with the latest inflation data being high - a situation where bond traders start to sell some parts of the curve to price in chances of hikes around the curve and reduce their exposure.
Funds in Japan are big buyers of all types of government bonds to provide interest, so if there is less supply of bonds and fewer bonds to buy for these entities, the rarity creates more demand, and then yields go down again.
When Yields go down in Japan, investors make more money by placing money in other higher yielding assets like US Treasuries or Equities, hence the Yen goes down.
USD/JPY Intra-Day Technical Analysis
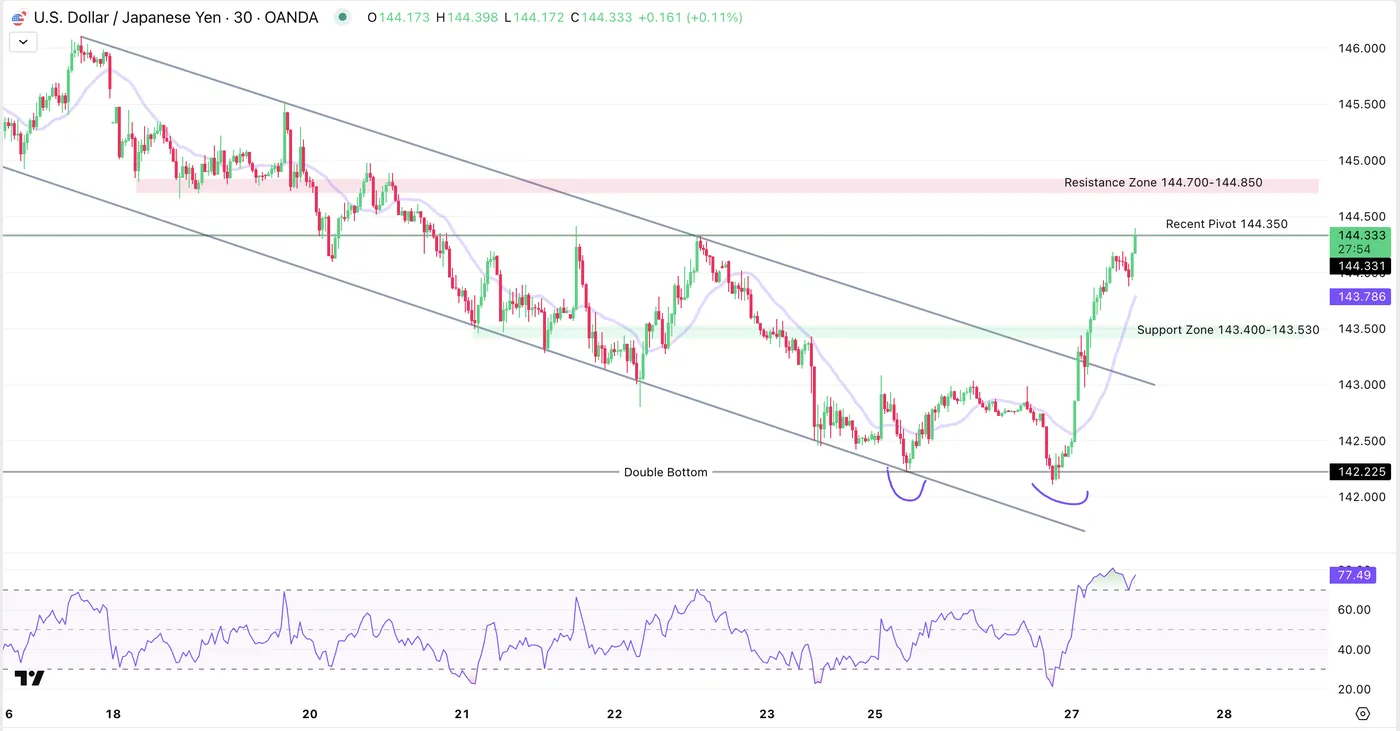
USDJPY 30M Chart, May 27, 2025. Source: TradingView
USD/JPY rallied on the recent comments from the Minister of Finance Kato, forming a double bottom - now up 1.11% on the session.
Last week's USD weakness created a descending channel from which prices broke out overnight. The RSI is overbought on all timeframes below 1H but the momentum is strong.
Having just crossed the last key pivot at 144.350, eyes are on these zones:
For immediate support, there is the MA 20 standing at 143.800.
A deeper retracement would retest the most recent Support Zone situated between 143.400 to 143.530.
Keep an high on a retest of the upper-bound of the descending channel, though prices are far and would require USD weakness to retrace that much - not the theme of the day.
For resistances on a pursued breakout, look at the Resistance Zone 144.700 - 144.850.
The next key resistance eyes to the 145.00 psychological level.
Safe Trades!
Three-Year Stagnation in US Durable Goods Orders
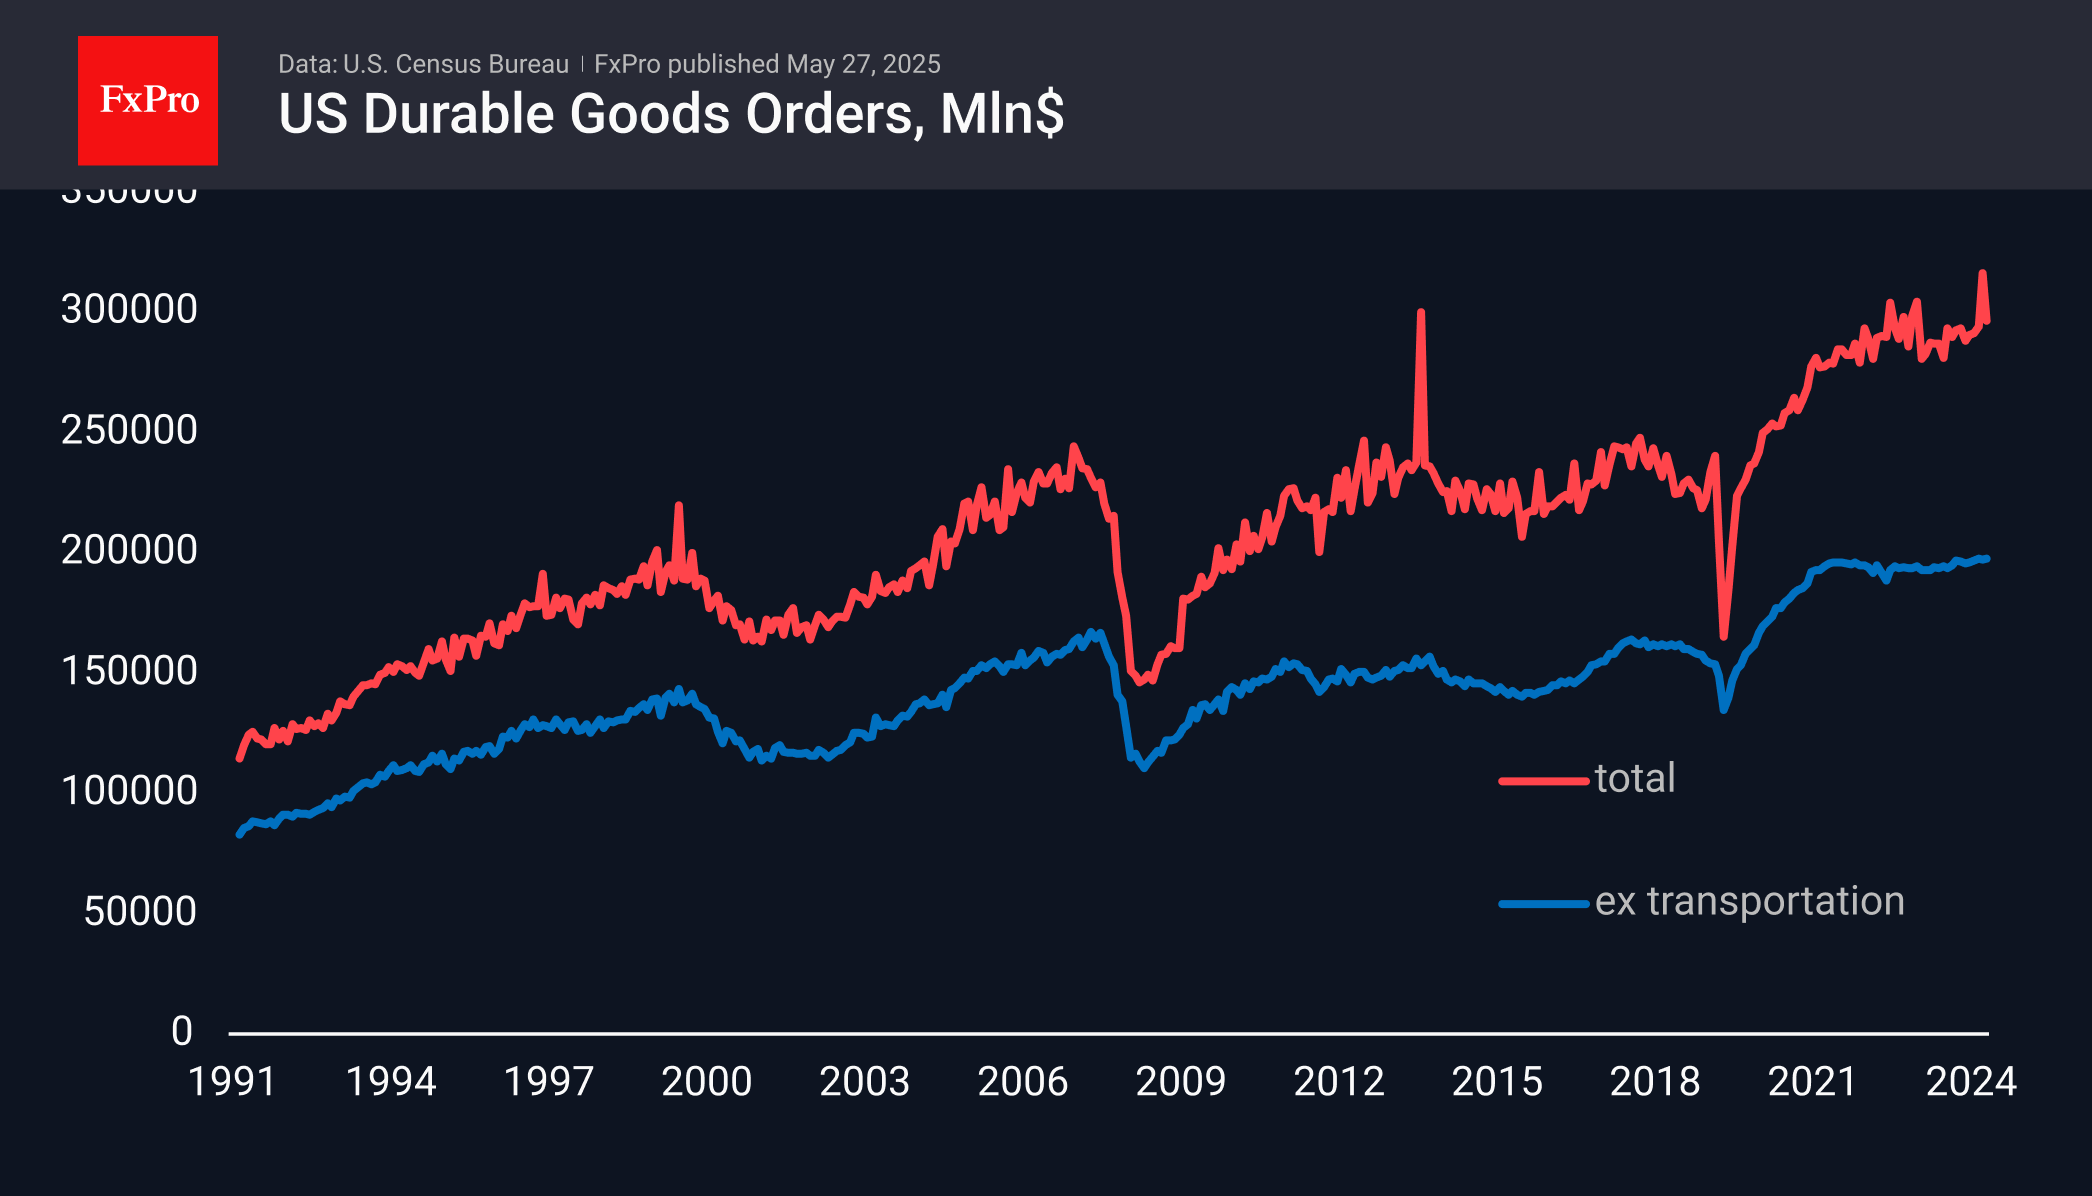
Preliminary estimates of durable goods orders in the US showed a less sharp than expected dip in April. The decline was 6.3% versus a 7.5% jump a month earlier and an expected 7.6% drop.
The volatility is almost entirely due to the transport sector, and without that component, there was a 0.2% gain for the month after a commensurate decline earlier. This indicator has been near a plateau for the past three years, adding only 1% in money over that time against a 12% rise in the Core CPI and a 9% rise in Core PPI. Simply put, America has been cutting investment in durable goods for about as long as the Fed has been shrinking its balance sheet.
In the short term, the current report is relatively positive for demand for US assets, including the dollar, coming in above expectations. However, in the medium term, it is worth paying attention to the decline in orders expressed in real prices. This may indicate a growing threat of stagnation, if not contraction, of the US economy, bringing the Fed rate cut closer.
Bitcoin Capitalised on Dollar’s Temporary Weakness
Fiscal problems and tariff confusion are undermining confidence in the US dollar. Other assets are rushing to take advantage of the loss of interest in the greenback. The ECB argues that the uncertainty of the White House policy could be a moment of glory for the euro. The regional currency can increase its share in international settlements and forex reserves. But digital assets could also benefit from the dollar’s decline.
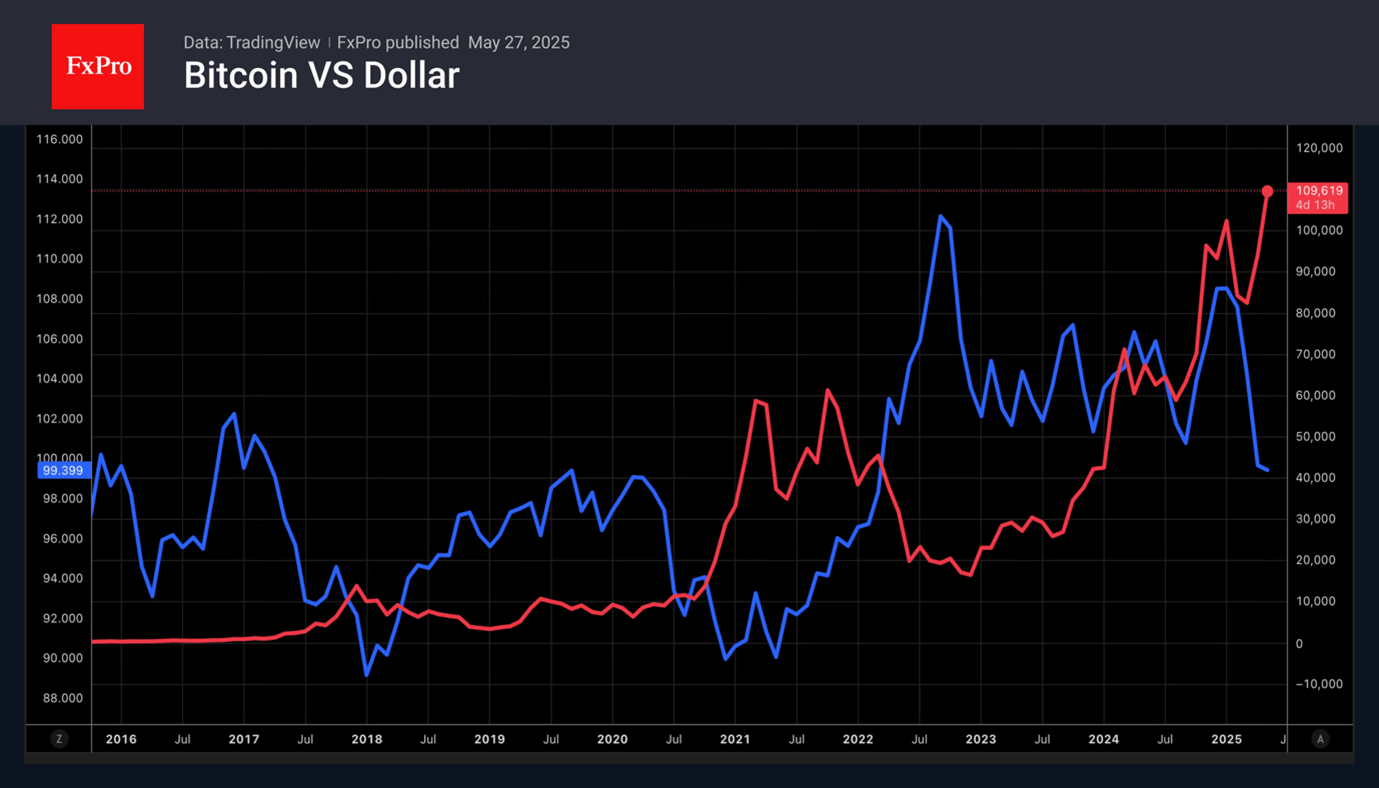
The BTCUSD rally against the backdrop of falling US stock indices and reduced global risk appetite might look strange. Perhaps the reason should be sought in Congress’s legislation about stablecoins. The legalisation of cryptocurrency offers an opportunity to be optimistic.
However, a ‘sell America’ trade is currently reigning over the markets. Investors are getting rid of stocks, bonds, and the US dollar and looking for alternatives. They are buying European stock indices, German bonds, and digital assets. Rumours are circulating that with the passage of legislation, stablecoins could become a competitor to bank deposits as holders can earn interest via stacking. Bank of America is ready to become an issuer of dollar-linked tokens in case of legalisation.
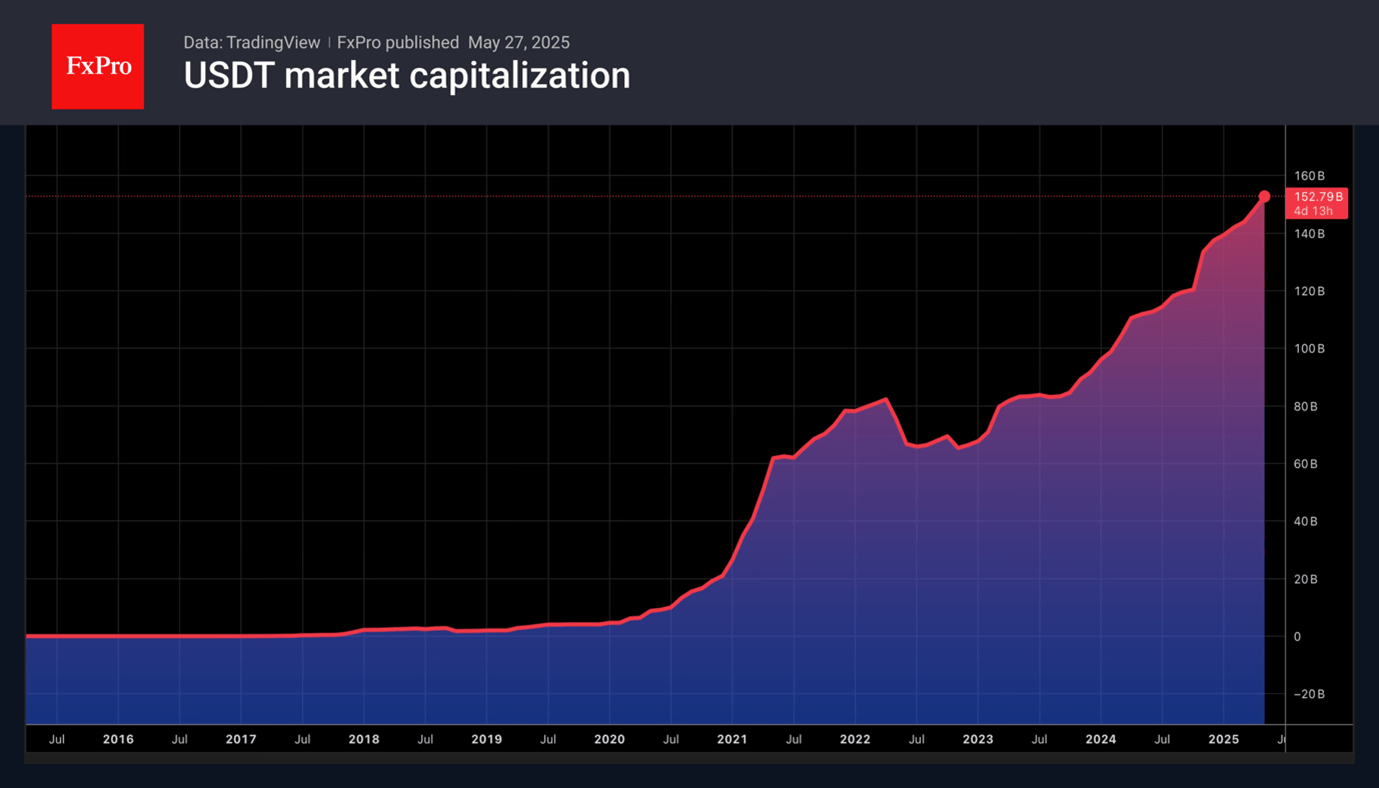
Tether, the largest player in the stablecoin market, is still wary of Congress considering the bill. The company is worried because of the potential differentiation between the activities of American and foreign issuers. The document may not be as good for the crypto industry as it seems. Will it contain too many restrictions?
Bitcoin is consolidating due to the lack of clarity about the bill and the US stock market being closed on Memorial Day. The S&P 500 is expected to open the new shortened week higher on the back of a truce in the US-EU trade war. Rising risk appetite may help Bitcoin regain its uptrend. Markets are wagering on the so-called Trump pattern, which suggests that postponements follow tariff threats. As a result, traders have an opportunity to buy the dip.
US consumer confidence jumps to 98, but recession signal persists
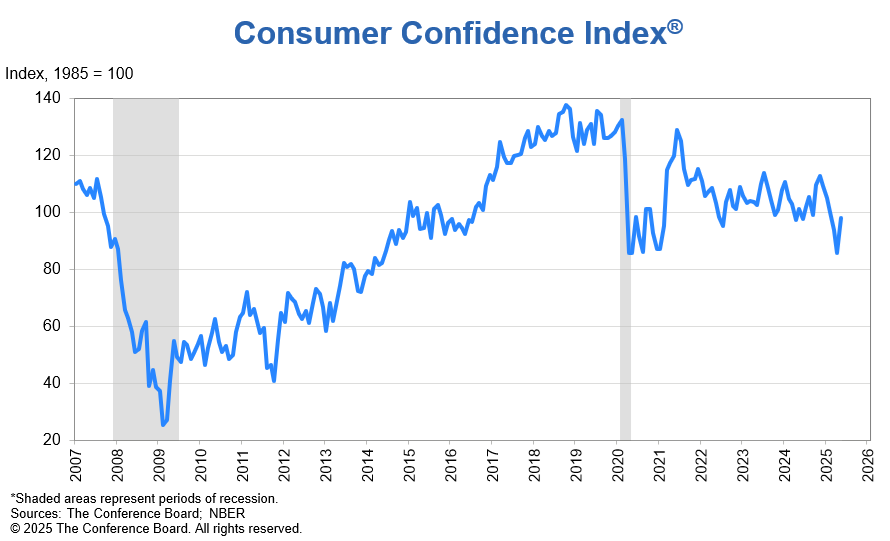
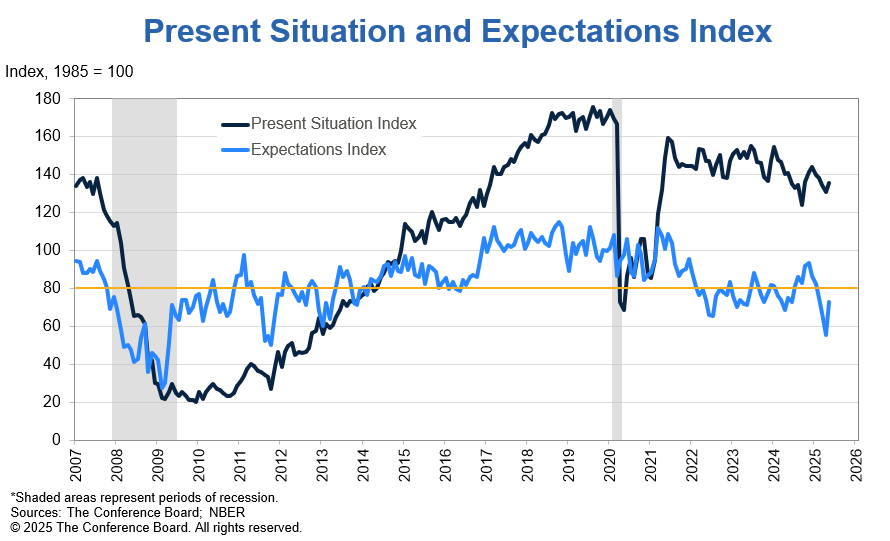
US Conference Board index jumped from 85.7 to 98.0 in May, far exceeding expectations of 87.1 and marking the first increase in six months. Present Situation Index rose 1.8 pts to 135.9. Expectations Index leapt by 17.4 points to 72.8.
Despite the rebound, the expectations component remains below the key threshold of 80, which historically signals elevated recession risk in the months ahead.
The improvement gained traction after the May 12 announcement of a partial pause on US-China tariffs, though the Conference Board noted the rebound had already begun beforehand.
According to Senior Economist Stephanie Guichard, the uptick was "largely driven by consumer expectations as all three components of the Expectations Index—business conditions, employment prospects, and future income".
Sunset Market Commentary
Markets
ECB’s Lagarde made a strong case yesterday when promoting a bigger, international role for the euro while that of the US dollar is gradually waning. Her long-term call needs to see the remaining stumbling blocks resolved first, including fragmented capital markets. It also means the short-term impact of an otherwise interesting speech is limited. The euro, in fact, is losing out against the dollar in a daily perspective. EUR/USD eased from an intraday high around 1.14 to 1.135. It’s not so much euro weakness as it is dollar strength though. USD/JPY rises to 144.07 while the trade-weighted DXY recovers to 99.35. The greenback is not the only US asset kicking of its first trading day of the week after having enjoyed the long weekend. They still had to catch up with Trump’s umpteenth U-turn on (European) tariffs. US Treasuries’ rally, for example, pushes yields between 1.4 and 5 bps lower. The long end of the curve outperformed in a move kickstarted by the Japanese bond surge during Asian dealings. Japanese bond yields dropped 20 bps (30-yr) after having hit multi-decade and in some cases record highs last week in maturities from 20-yr on. That happened after a miserable auction of that tenor. Fearing for tomorrow’s 40-yr bond auction, authorities started to sound out market participants on what the appropriate auction size would be. Reuters later reported the Ministry of Finance may trim its issuance of super-long bonds in response. European yields similarly drop a few bps at the back end of the curve. French inflation surprised to the downside, hitting a four-year low at 0.6% (0.9% expected). The miss came on the account of energy prices, which fell 1.5% m/m. But services prices eased as well, by a monthly 0.2%. Short-term yields barely budged. That’s not a huge surprise given that money markets are already pricing in a too low terminal ECB policy rate (<1.75%). A few more ECB members hit the wires before the 7-day quiet period kicks in from Thursday. Uberhawk Holzmann told the Financial Times that there’s no reason to lower rates in June or July. He argues for a pause until September to see how the trade conflict evolves. His comments contrast with most of his colleagues and indeed had little effect on market pricing for next week. A 25 bps rate cut remains fully priced in. UK gilts underperform global peers with the front end marching 5 bps higher and that’s actually masking an intraday 10 bps move. That’s supporting sterling and triggering a breach of EUR/GBP sub 0.84. European stocks extend yesterday’s gain by 0.4%. Wall Street opens more than 1% higher.
News & Views
The European Commission’s economic sentiment indicator (EMU) improved from 93.8 to 94.8 in May, beating 94.1 consensus. The employment expectations indicator also picked up, from 96.5 to 97. Both indicators remain below their long term average of 100. The rise in the ESI for the EU was primarily driven by a partial rebound of confidence in the retail trade sector (recovery of retailers’ assessment of the past business situation and more favourable assessments of the volumes of stock) and among consumers (especially receding pessimism over general economic situation), with a moderate contribution also from the construction sector (improved assessments of the level of order books). Confidence in both the industry and services sectors remained broadly stable. Selling price expectations dropped in services, retail trade and construction but remain above their long term averages. Consumers’ price expectations for the next 12 months reverted the sharp increase from April, ending the upward trend in place since late 2024.
The EU today approved the creation of a €150bn EU arms fund, the final legal step in setting up the SAFE (Security Action for Europe) scheme, involving joint EU borrowing to give loans to European countries for joint defense projects. For a project to qualify for SAFE funding, 65% of its value must come from companies based in the EU, Ukraine, Iceland, Liechtenstein, Norway and Switzerland. Companies from countries with a Security and Defense Partnership with the EU (eg UK) can also be eligible under additional conditions. The contribution of any single non-EU subcontractor in any funded project is capped at 15% but can rise to 35% under circumstance.
EUR/USD Mid-Day Outlook
Daily Pivots: (S1) 1.1360; (P) 1.1389; (R1) 1.1417; More...
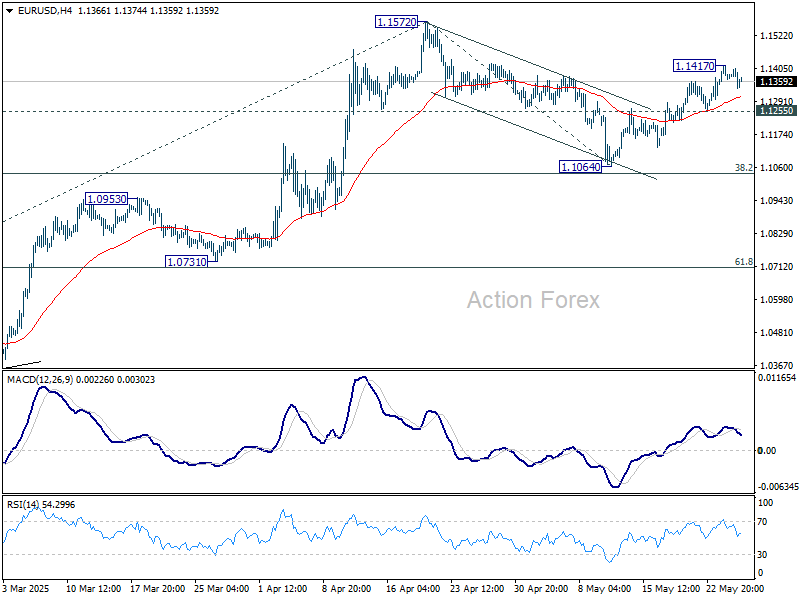
Intraday bias in EUR/USD is turned neutral first with current retreat. Further rise is in favor as long as 1.1255 support holds. Above 1.1417 will bring retest of 1.1572 high first. Decisive break there will resume larger up trend to 61.8% projection of 1.0176 to 1.1572 from 1.1064 at 1.1927. On the downside, however, break of 1.1255 will turn bias back to the downside to extend the corrective pattern from 1.1572 with another falling leg.
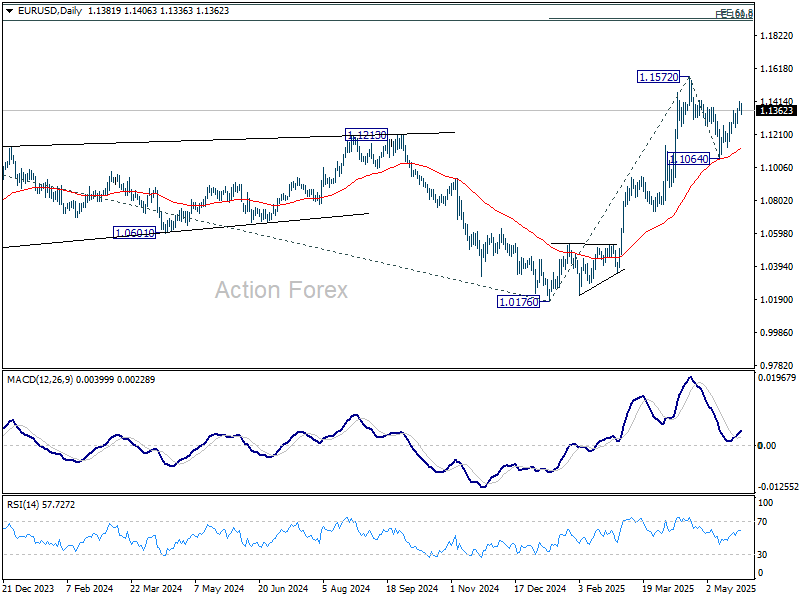
In the bigger picture, rise from 0.9534 long term bottom could be correcting the multi-decade downtrend or the start of a long term up trend. In either case, further rise should be seen to 100% projection of 0.9534 to 1.1274 from 1.0176 at 1.1916. This will now remain the favored case as long as 55 W EMA (now at 1.0858) holds.
GBP/USD Mid-Day Outlook
Daily Pivots: (S1) 1.3525; (P) 1.3559; (R1) 1.3597; More...
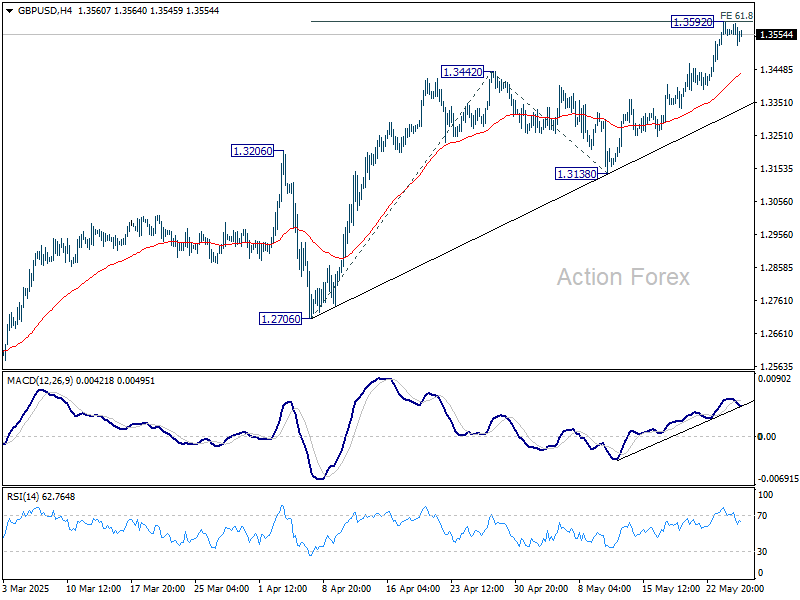
Intraday bias in GBP/USD remains neutral and some consolidations could be seen below 1.3592 temporary top. Downside should be contained well above 1.3138 support to bring another rally. On the upside, firm break of 1.3592 will turn bias back to the upside for 100% projection of 1.2706 to 1.3442 from 1.3138 at 1.3874.
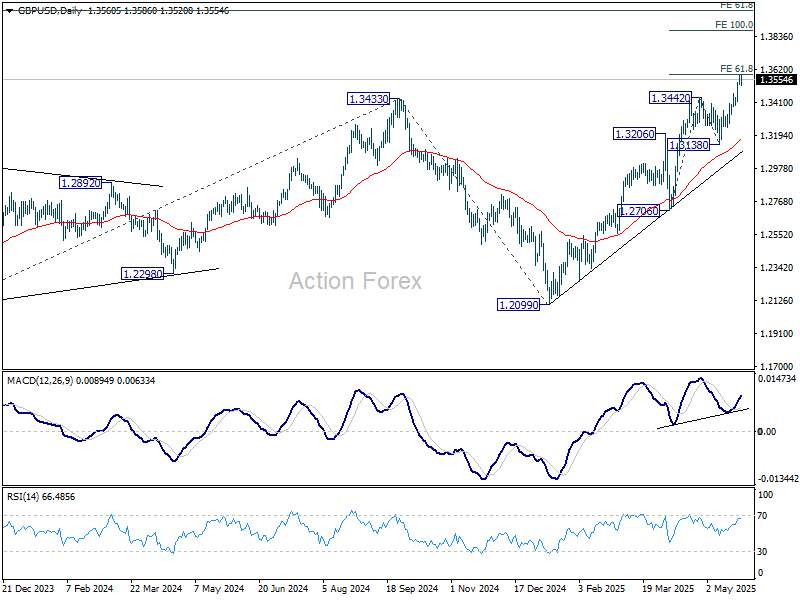
In the bigger picture, up trend from 1.3051 (2022 low) is in progress. Next medium term target is 61.8% projection of 1.0351 to 1.3433 from 1.2099 at 1.4004. Outlook will now stay bullish as long as 55 W EMA (now at 1.2870) holds, even in case of deep pullback.
USD/CHF Mid-Day Outlook
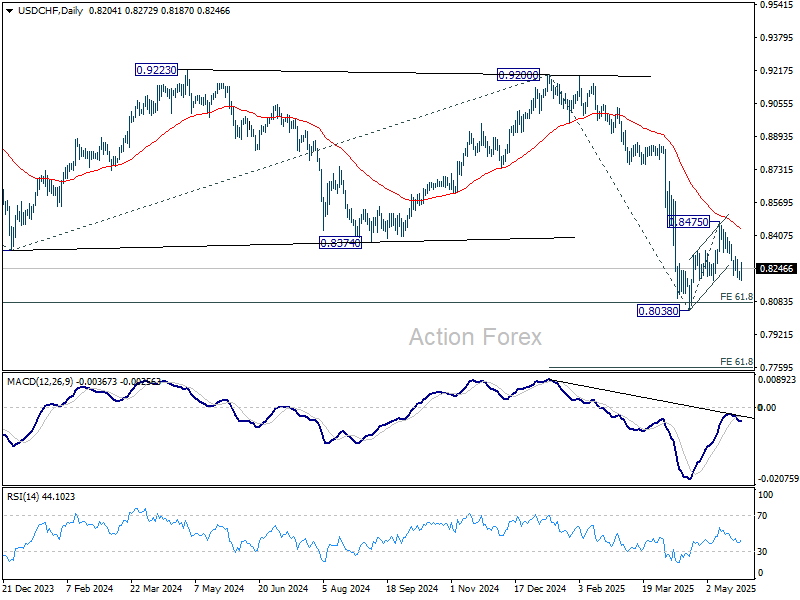
Daily Pivots: (S1) 0.8191; (P) 0.8212; (R1) 0.8231; More….
Intraday bias in USD/CHF is turned neutral with current recovery. For now, rise will stay on the downside as long as 0.8475 resistance holds, in case of recovery. Below 0.8187 will target 0.8038 low. Firm break there will resume larger down trend to 61.8% projection of 0.9200 to 0.8038 from 0.8475 at 0.7757 next.
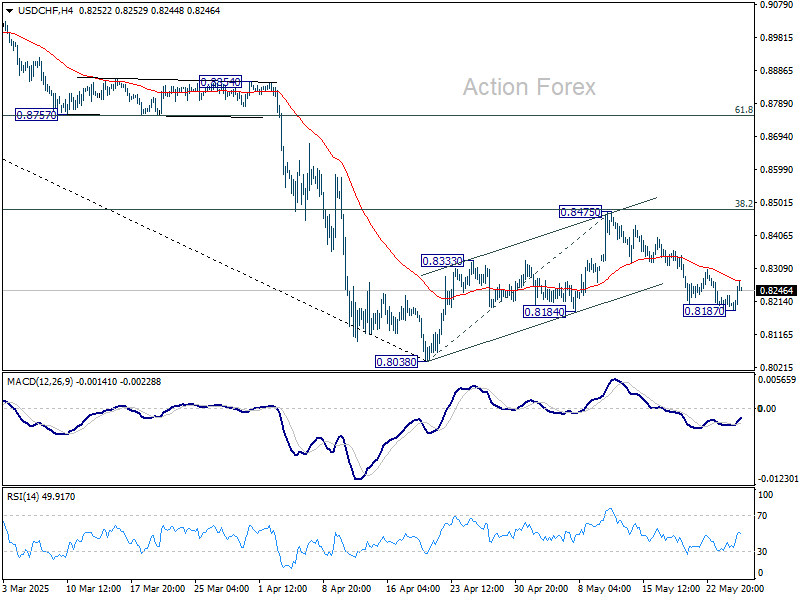
In the bigger picture, long term down trend from 1.0342 (2017 high) is still in progress and met 61.8% projection of 1.0146 (2022 high) to 0.8332 from 0.9200 at 0.8079 already. In any case, outlook will stay bearish as long as 55 W EMA (now at 0.8713) holds. Sustained break of 0.8079 will target 100% projection at 0.7382.