Sample Category Title
EUR/JPY Decline Insight
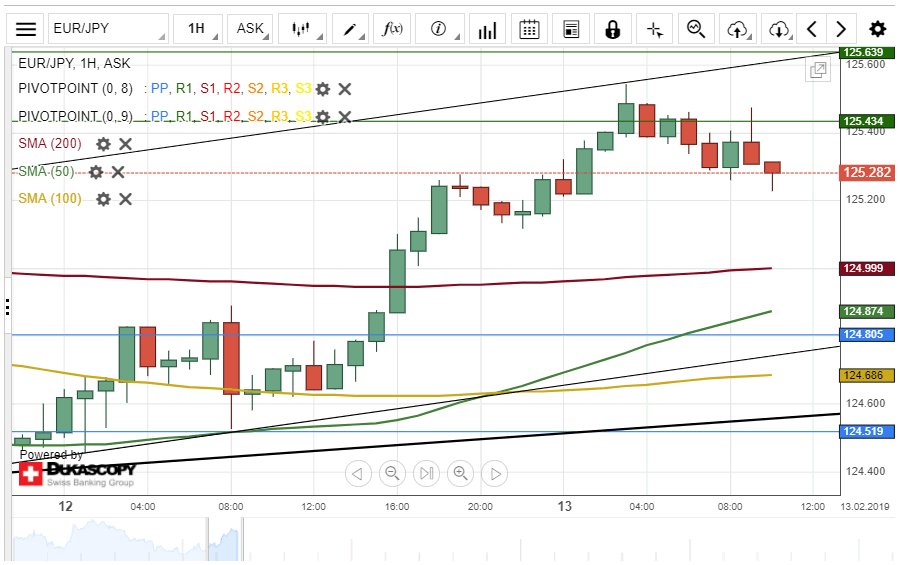
The common European currency appreciated about 79 base points against the Japanese Yen on Tuesday. The currency pair has revealed a new junior ascending channel pattern.
After hitting the upper boundary of the junior ascending channel at 125.53, the exchange rate made a pullback down.
Most likely, the currency exchange rate will continue its decline towards a support level at 124.80 within this session.
If the support level holds, a potential bullish sentiment could be introduced during the following trading session.
AUD/USD Potential Upside Movement
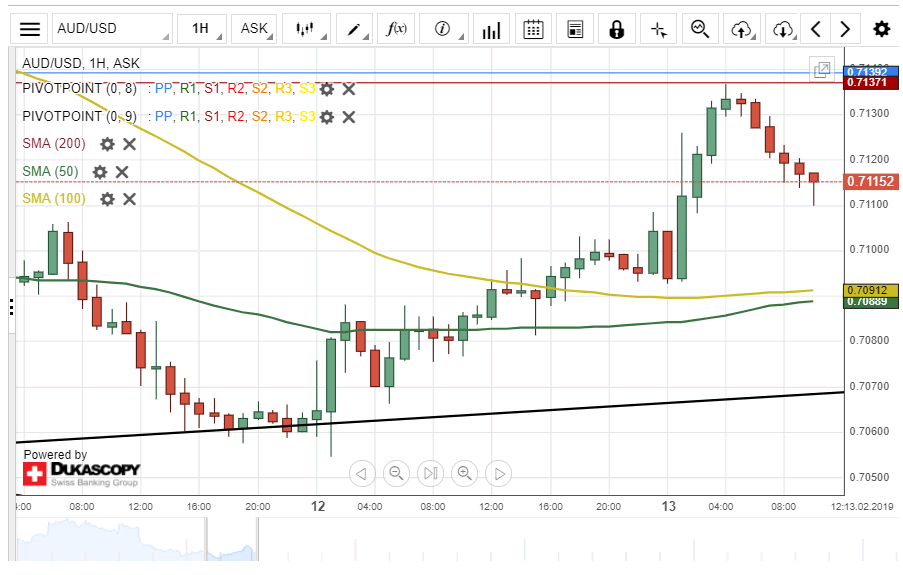
The Australian Dollar appreciated about 44 base points against the US Dollar on Tuesday. The currency pair breached both the 50– and 100-hour SMAs during yesterday's session.
Wednesday's trading session began with an upside movement. And by the middle of the day, the AUD/USD exchange rate has dashed through the monthly pivot point at 0.7105.
Everything being equal, it is likely that the currency exchange rate will edge higher towards the 200-hour simple moving average at 0.7149 today.
Although, a resistance level formed by the weekly PP at 0.7139 could hinder such movement.
USD/CAD Testing 200-Hour SMA
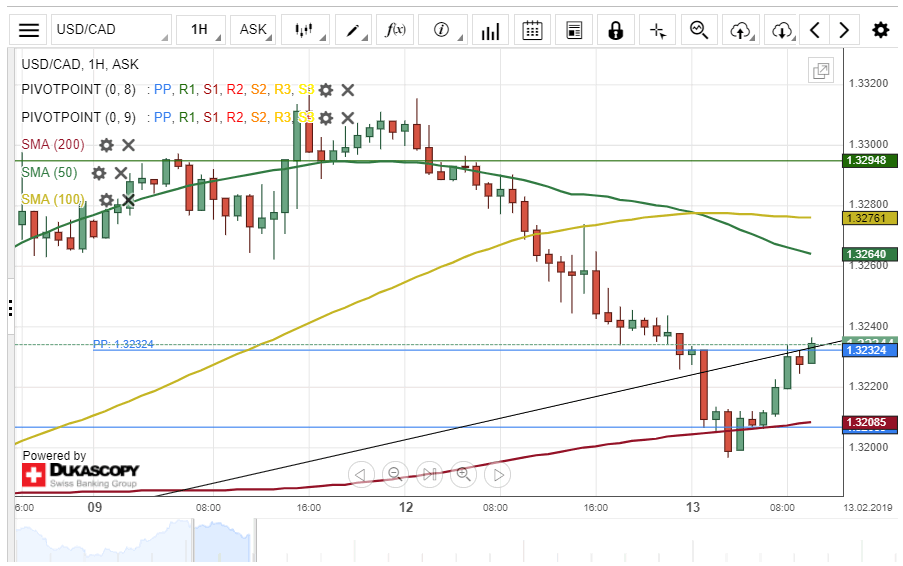
The US Dollar edged lower on Tuesday. The decline began after the currency pair tested a traditional monthly pivot point at 1.3302. As a result, a breakout through the lower boundary of an ascending channel pattern occurred.
Given that a breakout had occurred, it is likely that the USD/CAD exchange rate continues its downward movement within this session.
The potential downside target will be near a support level at 1.3134. However, the 200-hour simple moving average located at 1.3207 could hinder such downwards movement today.
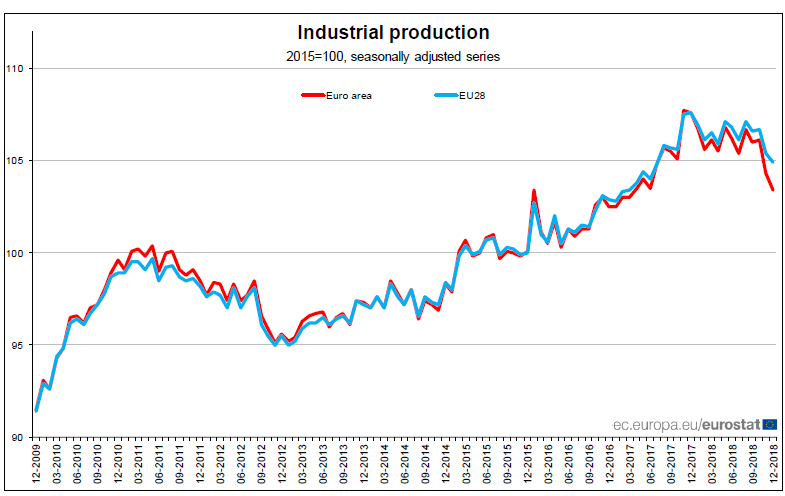
Eurozone industrial production dropped -0.9% mom in Dec
Eurozone industrial production contracted -0.9% mom in December, much worse than expectation of -0.4% mom. Over the year, IP dropped -4.2% yoy. Looking at the industrial groupings, production of both capital goods and non-durable consumer goods fell by -1.5% and energy by -0.4%, while production of intermediate goods remained unchanged and durable consumer goods rose by 0.7%. For EU 28, industrial productions dropped -0.5% mom, -2.7% yoy.
NZD/USD Surge After Kiwi Overnight Rate
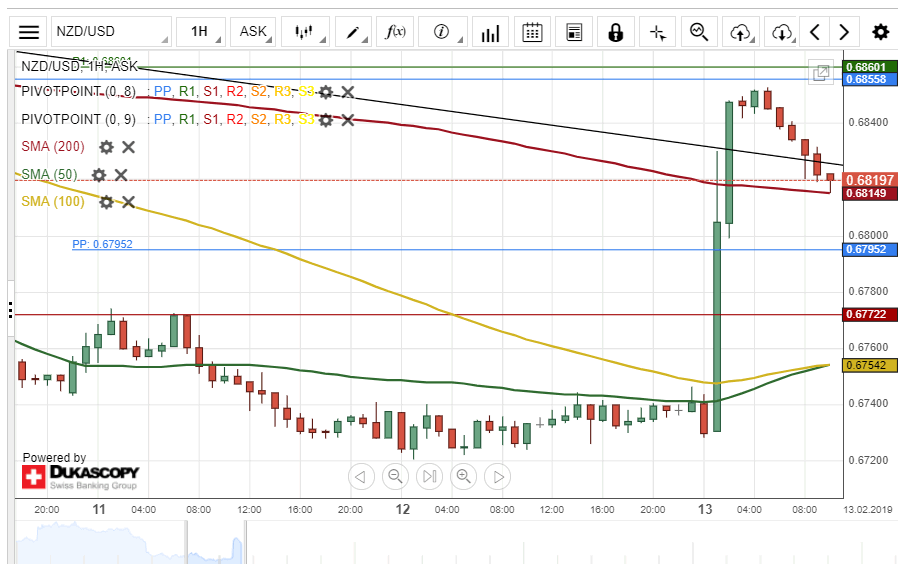
The New Zealand Dollar traded with low volatility against the US Dollar on Tuesday. However, the situation where different during the Asian session on Thursday. The currency pair gained about 1.8-% of its values.
The surge was attributed to a fundamental event that occurs during the morning hours of today's trading session. The Official Cash Rate from New Zealand remained unchanged.
As for the nearest future, it is likely that bearish traders will push the currency exchange rate lower towards a support level at 0.6774.
Although, a support cluster is located near the 0.6815 area, which could provide support for the rate.
UK CPI slowed to 2-year low, Sterling shrugs
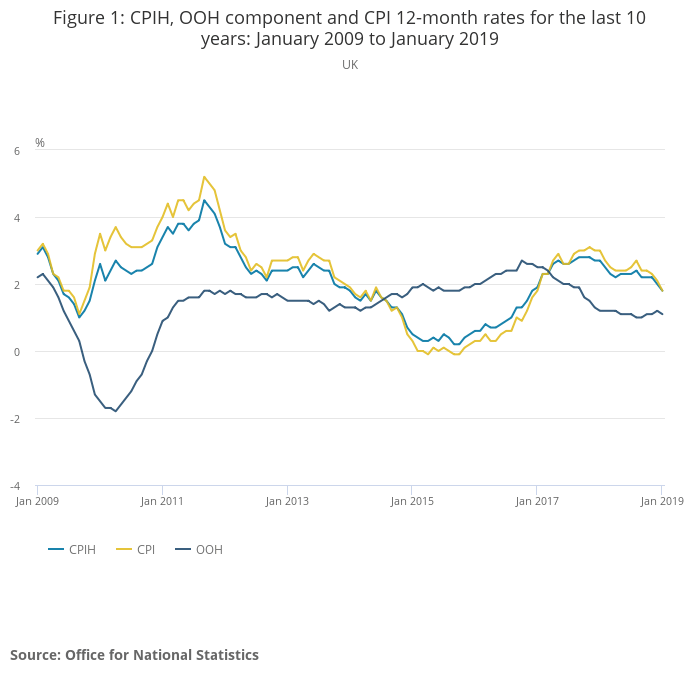
UK CPI slowed to 1.8% yoy in January, down from 2.1% yoy and missed expectation of 2.0% yoy. That's also the lowest level since January 2017. Core CPI was unchanged at 1.9% yoy, matched expectations. ONS noted that the largest downward contribution to the change in the 12-month rate came from electricity, gas and other fuels. Meanwhile, these downward effects were partially offset by air fares.
Also from UK,
- RPI slowed to 2.5% yoy, down from 2.7% yoy, below expectation of 2.5% yoy.
- PPI input slowed to 2.9% yoy, down from 3.2% yoy and missed expectation of 3.8% yoy.
- PPI output slowed to 2.1% yoy, down from 2.4% yoy and missed expectation of 2.2% yoy.
- PPI output core was unchanged at 2.4% yoy, above expectation of 2.3% yoy.
- House price index slowed to 2.5% yoy, down from 2.7% yoy, matched expectations.
- Sterling dips mildly after the release. But loss is so far very limited.
CAD Bounce Shortened
Following January's Bank of Canada's (BoC) meeting, which decided to maintain its key rate at 1.75% for the second consecutive time, the loonie is holding up against the greenback. Under current settings, we expect the Canadian economy to stay robust and the BoC possibly to hike its rate by December 2019. USD/CAD's drop from yesterday might be over, as optimism for resolution of the Sino-American trade dispute builds. However, risk of a US government shutdown by Saturday looms. Currently trading at 1.3225, USD/CAD is heading along 1.3255 short-term.
Canada's GDP growth is now projected at 1.70% from a prior 2.10%. Inflation remains consistent, with December headline and core consumer prices at 2% and 2.30% (prior figures: 1.70%). The labour outlook remains highly constructive. Hourly earnings have taken off since a November 2018 downtrend, up 1.80% in January while the economy built 67,000 jobs in the same period. The recent bounce in oil prices from December is good for Canada's trade balance. It benefits from OPEC's price hike and Saudi Arabia's output cut, but also from USA's oil import sanction against Venezuela, as US refiners are willing to substitute it with Canadian heavy crude.
Short-term Kiwi boost
The New Zealand dollar surged more than 1.8% on Wednesday morning amid an unexpected hawkish - or less dovish - announcement from the Reserve Bank of New Zealand (RBNZ). NZD/USD hit $0.6850 before stabilising around $0.6825. As broadly expected, RBNZ left the Official Cash Rate unchanged at a record low 1.75%. Governor Orr surprised markets by declaring “we expect to keep the OCR at this level through 2019 and 2020.” Nevertheless, he let the door open for a cut, saying “the direction of our next move could be up or down.” In the short-term, we expect NZD/USD to grind lower as investors discount a possible rate hike by the RBNZ and focus on the eventuality of a rate cut. A return towards $0.6770 seems most likely.
Investors chose to see the glass half-full rather than half-empty. Orr's is far from a hawkish comment: rather it reveals that the central bank sees dark clouds on the horizon. Just like its neighbour Australia, New Zealand's economy is globalised and heavily dependent on international trade. Its dependence on external demand could be difficult, especially if the Sino-American trade war worsens.
The Analytical Overview Of The Main Currency Pairs
The EUR/USD currency pair
Technical indicators of the currency pair:
Prev Open: 1.12742
Open: 1.13249
% chg. over the last day: +0.50
Day's range: 1.13129 – 1.13414
52 wk range: 1.1214 – 1.2557
Yesterday, the USD index (#DX) retreated from the monthly maximums and closed in the red. The US/China trading conflict remains in the spotlight. The demand for the high-risk assets grew after the statement by Donald Trump. The US president claimed that he is ready to prolong the truce between the countries. The key support and resistance levels are 1.13000 and 1.13400. You should open positions from these levels. EUR has a tendency to correct further.
The Economic News Feed for 13.02.2019:
GDP report (EU) – 12:00 (GMT+2:00);
Inflation report (US) – 15:30 (GMT+2:00);
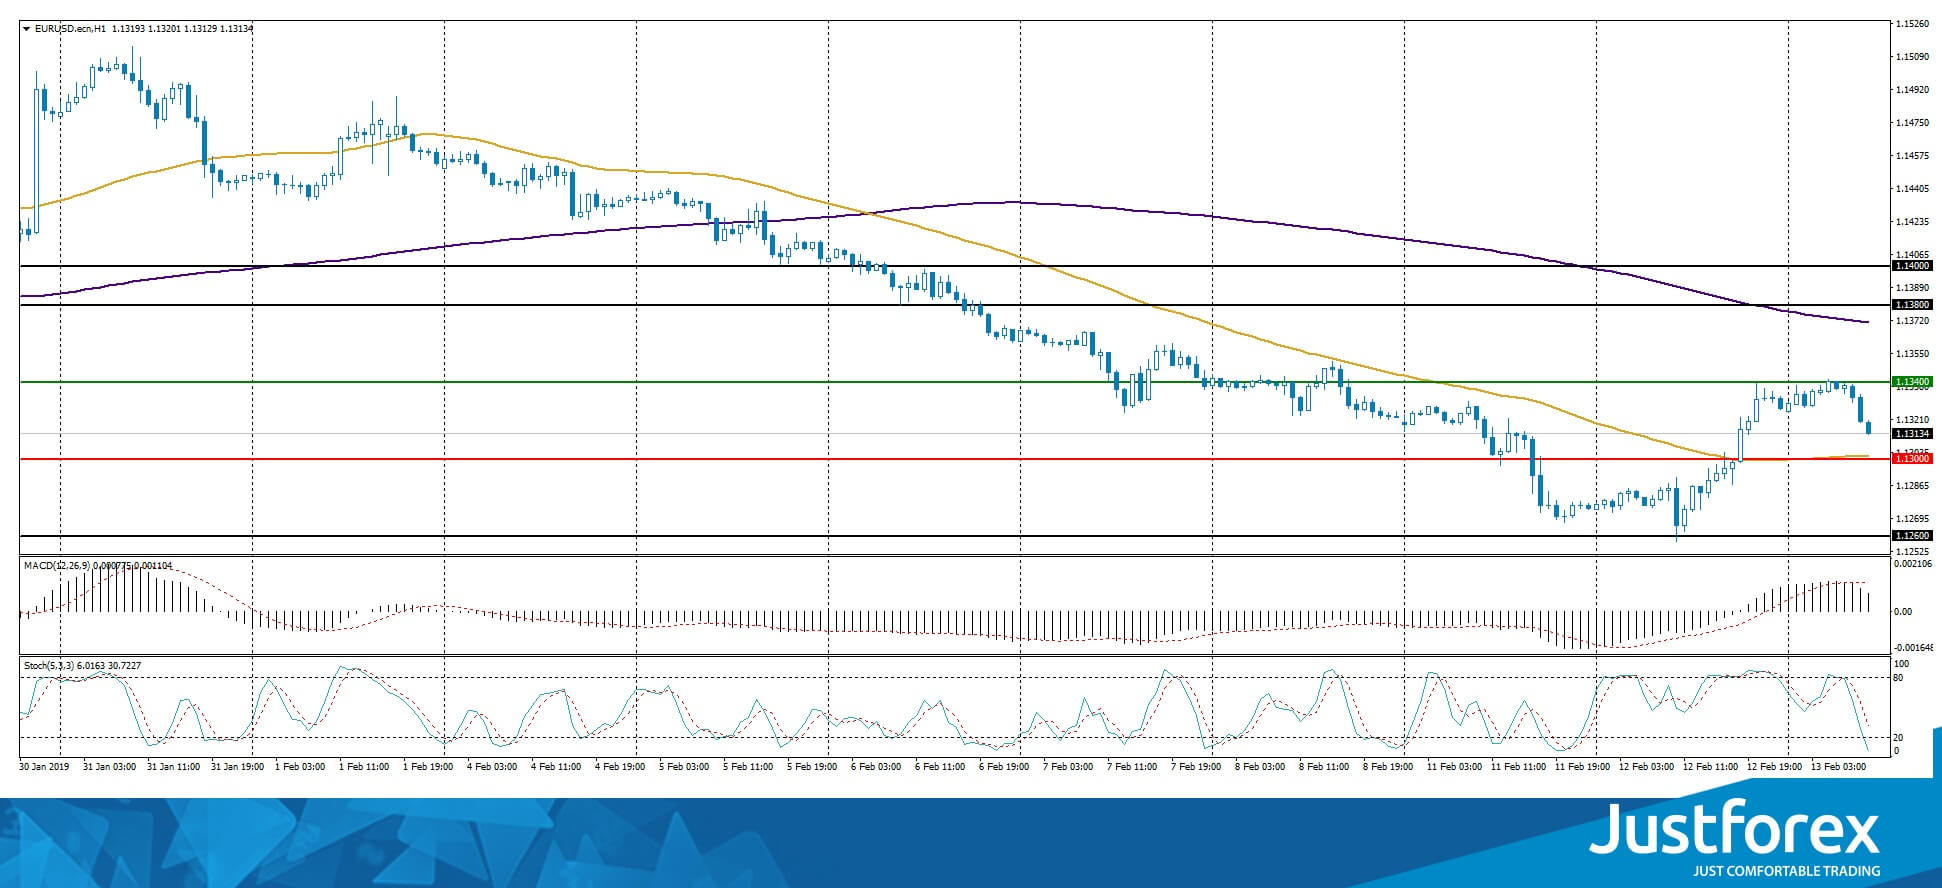
The indicators do not provide precise signals. The price fixed between 50 MA and 200 MA which act as dynamic support and resistance levels.
The MACD histogram is in the positive zone but below the signal line, which gives a weak signal to buy EUR/USD.
The Stochastic Oscillator is in the neutral zone, the %K line is below the %D line, which points to a bearish mood.
Trading recommendations
Support levels: 1.13000, 1.12600
Resistance levels: 1.13400, 1.13800, 1.13400
If the price fixed above 1.13400, expect the quotes to recover toward 1.13800-1.14000.
Alternatively, the quotes can fall toward 1.12700-1.12500.
The GBP/USD currency pair
Technical indicators of the currency pair:
Prev Open: 1.28535
Open: 1.28910
% chg. over the last day: +0.31
Day's range: 1.28901 – 1.29227
52 wk range: 1.2438 – 1.4378
GBP/USD retreated from the monthly maximums, which was caused by the technical factors. The demand for high-risk assets has grown, which provided the pound with some support. The financial market participants keep watching the Brexit situation. The GBP/USD quotes are consolidating around 1.28850-1.29250. You should open positions from these levels and wait for more reports.
At 11:30 (GMT+2:00) the UK will publish an inflation report.
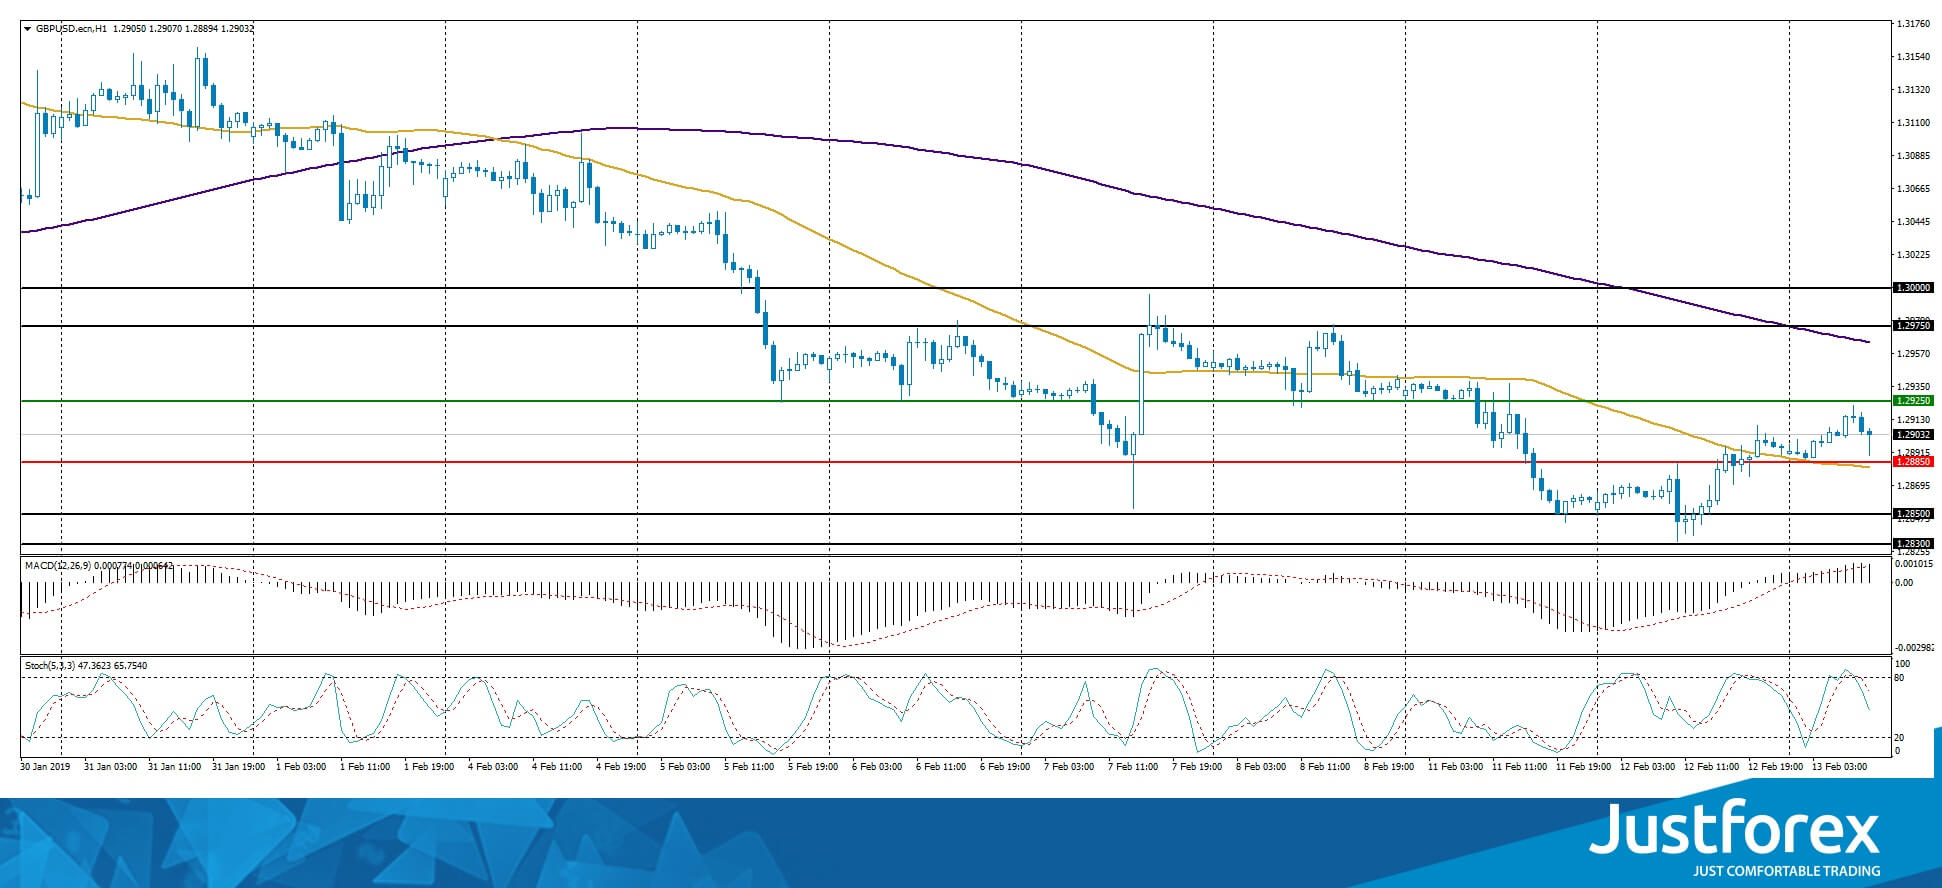
The indicators do not provide precise signals, the price fixed between 50 MA and 200 MA.
The MACD histogram is in the positive zone and above the signal line, which gives a strong signal to buy GBP/USD.
The Stochastic Oscillator is in the neutral zone, the %K line is below the %D line, which points to a bearish mood.
Trading recommendations
Support levels: 1.28850, 1.28500
Resistance levels: 1.29250, 1.29750, 1.30000
If the price fixes above 1.29250, expect the quotes to correct toward 1.29700-1.30000.
Alternatively, the quotes can fall toward 1.28300-1.28500.
The USD/CAD currency pair
Technical indicators of the currency pair:
Prev Open: 1.32941
Open: 1.32360
% chg. over the last day: -0.55
Day's range: 1.31961 – 1.32376
52 wk range: 1.2248 – 1.3664
The USD/CAD started to descend. During the last two days of trading, the CAD strengthened against USD by more than 80 points and updated the key extremums. Right now the quotes are consolidating around 1.32000-1.32400. The trading instrument has a tendency for future correction. You should open positions from these levels.
The Economic News Feed for 13.02.2019 is calm.
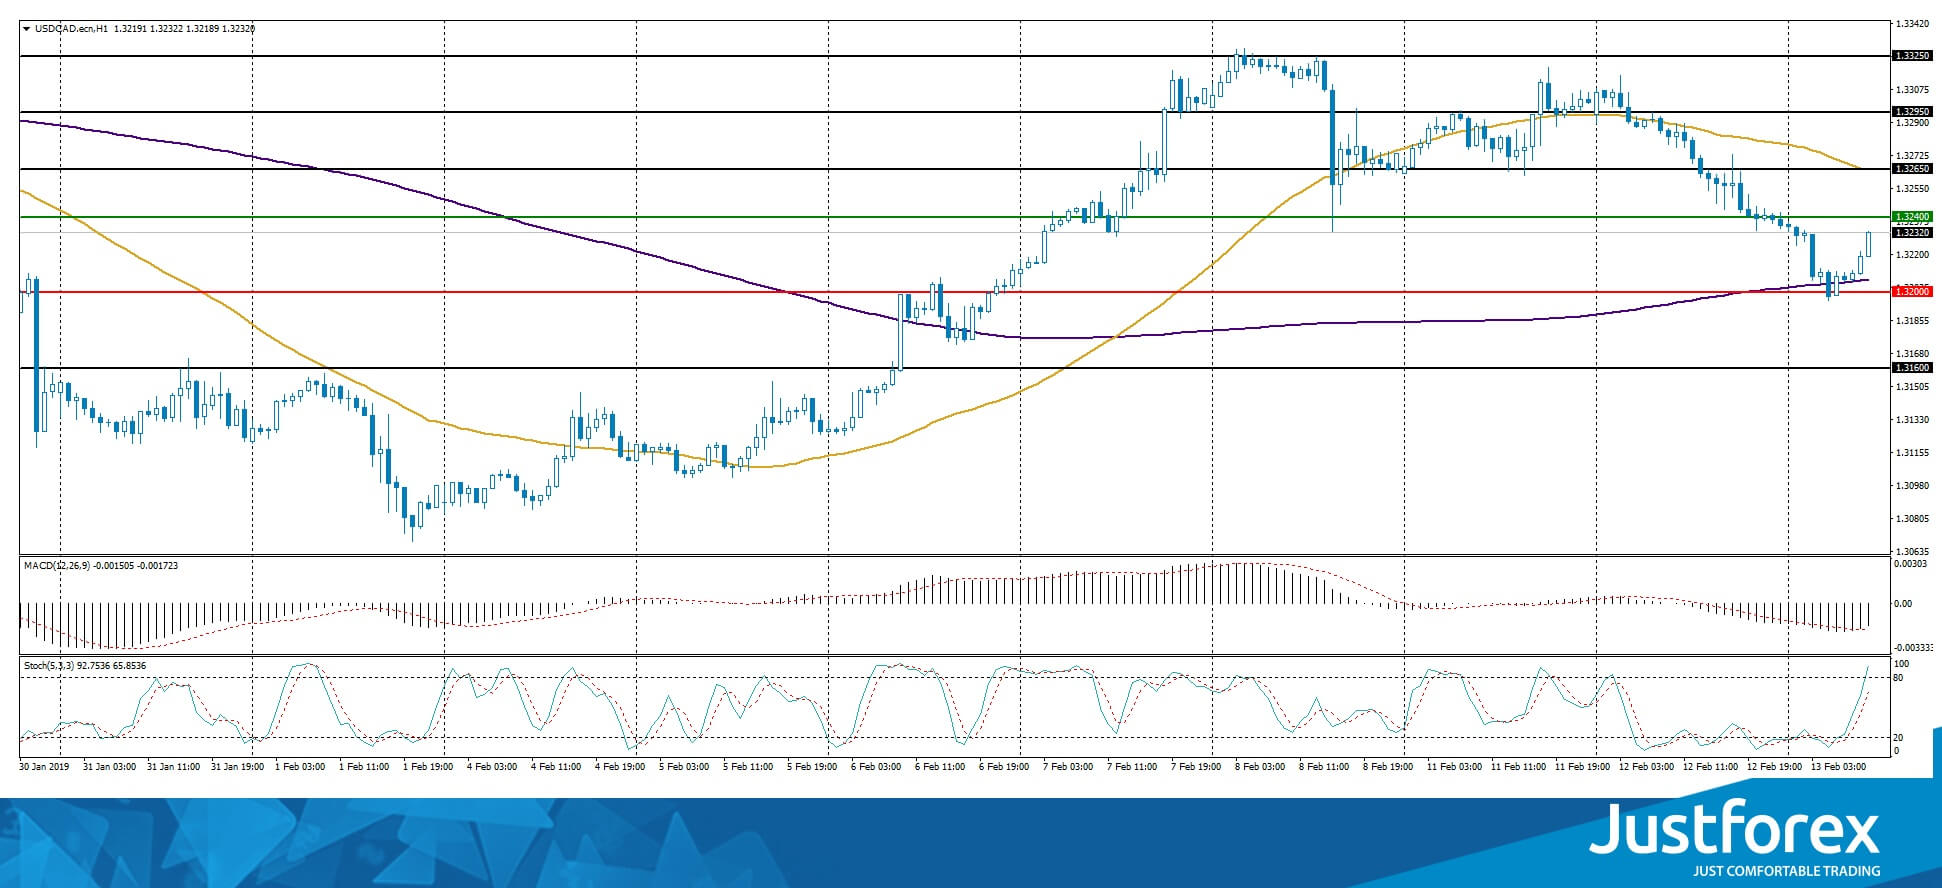
The indicators do not provide precise signals, the price fixed between 50 MA and 200 MA.
The MACD histogram is in the negative zone but above the signal line which gives a weak signal to sell USD/CAD.
The Stochastic Oscillator is in the neutral zone, the %K line is above the %D line, which points to a bullish mood.
Trading recommendations
Support levels: 1.32000, 1.31600
Resistance levels: 1.32400, 1.32650, 1.32950
If the price fixes below 1.32000, expect the quotes to fall toward 1.31600-1.31400.
Alternatively, the quotes can recover toward 1.32700-1.33000.
The USD/JPY currency pair
Technical indicators of the currency pair:
Prev Open: 110.333
Open: 110.458
% chg. over the last day: +0.12
Day's range: 110.417 – 110.767
52 wk range: 104.56 – 114.56
USD/JPY remains in a bullish mood. Right now the trading instrument is testing the resistance at 110.750. 110.400 acts as the key support. The demand on the high-risk assets remains high. You should open positions from the key levels. Keep an eye on the US economic reports.
The Economic News Feed for 13.02.2019 is calm.
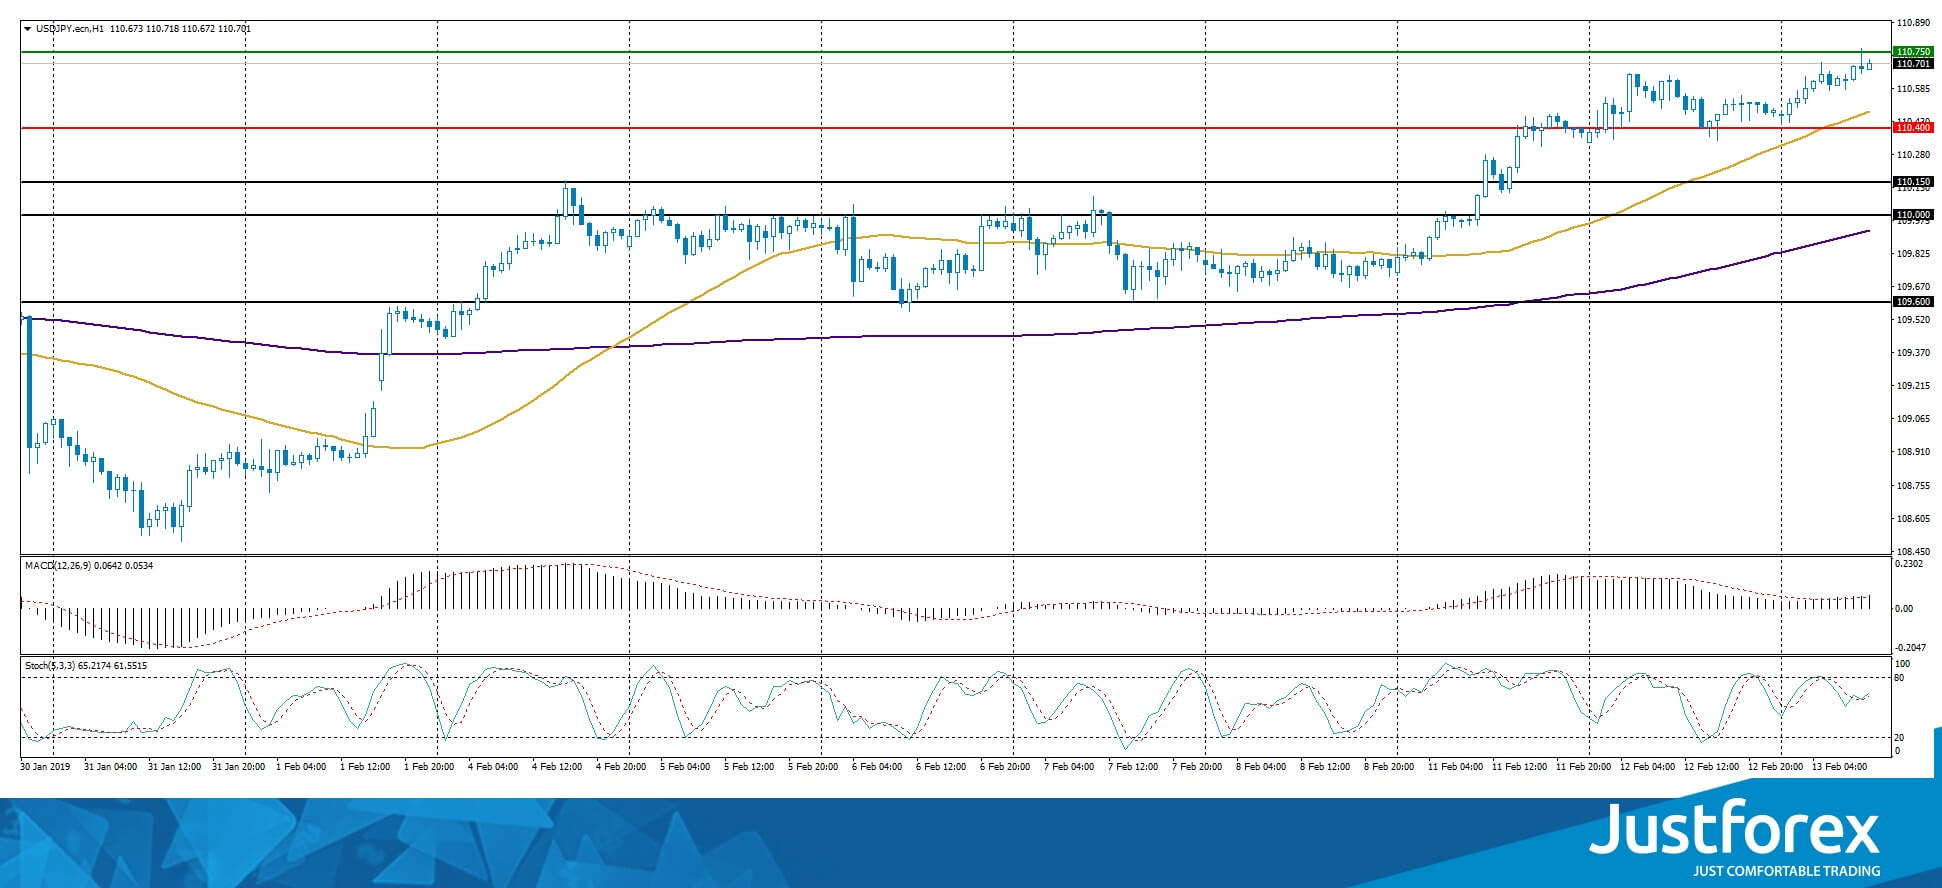
The price fixed above 50 MA and 200 MA which points to the power of the buyers.
The MACD histogram is in the positive zone and keeps rising which points to a bullish mood.
The Stochastic Oscillator is in the neutral zone, the %K line is crossing the %D line. There are no signals at the moment.
Trading recommendations
Support levels: 110.400, 110.000, 109.600
Resistance levels: 110.750, 111.000
If the price fixes above 110.750, expect the quotes to grow toward 111.000-11.250.
Alternatively, the quotes can descend toward 110.150-110.000.
Trump Delivers Boost To Global Markets
Risk appetite returns on trade talks hope
It's been a strong start for equity markets on Wednesday, with investors buoyed by encouraging signals on Sino-US trade talks and the government shutdown.
It goes without saying that the prospect of further escalations in the trade conflict between the world's two largest economies is a major risk factor for markets. We may not have reached a point at which an agreement is imminent but the acknowledgement that they could let the deadline slide is encouraging, both in terms of it being a sign of progress and the elimination of near-term tariff risks.
It's clear that the next few rounds of tariffs were going to be the most damaging for both sides and that the best solution was to come to an agreement that removed the risk of them being imposed. The environment right now may not be as favourable for Trump to be taking big risks in order to get what he wants but he's shown himself to not be particularly conventional countless times before so it would be foolish to assume he's bluffing now. Hopefully, the latest comments are a sign that it won't come to that and a truce extension is the best realistic outcome we could have hoped for following only 90 days of talks.
One area where the President appears to have been forced to swallow some pride is on the border wall, with the previous shutdown having not gone the way he assumed. Trump is yet to sign the deal that was struck earlier this week but it would appear he's going to which will avoid another long shutdown but force him to source the majority of the funds for the wall from elsewhere. The only question now is how he'll sell this as a victory to his supporter base and where the funds for the wall will come from because I doubt Trump's going to give up this easily.
USD topples on trade reports, offering relief for gold
One casualty in the recent developments has been the US dollar which toppled yesterday as the news was coming out, ending an impressive eight session winning streak. The greenback has typically underperformed during periods of progress in the trade conflict and that's exactly what we're seeing now. It's slightly up today but I think that's just a little profit taking on yesterday's moves.
This has provided some relief for gold, which has been under pressure over the last couple of weeks as the dollar has climbed back to late 2018 levels. Still, it's shown impressive resilience and held above $1,300 in that time, a sign of confidence among gold bulls unwilling to relinquish control. This is quite a bullish signal for the yellow metal which remains range-bound between $1,300 and $1,320 for now. A break above here would draw attention to $1,340, a prior area of support and resistance.
Saudi surprise buoys oil prices
Oil is another that's had a rather good 24 hours, with a culmination of factors helping it off its recent lows. A weaker dollar and improved risk appetite are both supportive factors for WTI and Brent, but the most important factor was the report that Saudi Arabia is planning to cut output by 500,000 barrels more than it committed to at the end of last year. Clearly they're concerned about the current supply/demand dynamics, with US production at record highs and rising, global growth slowing and Russia dragging its feet on its commitments. This is certainly a bullish factor for crude in the near-term.
EUR/USD Outlook: Downbeat EU IP Data May Add To Recovery Stall Signals
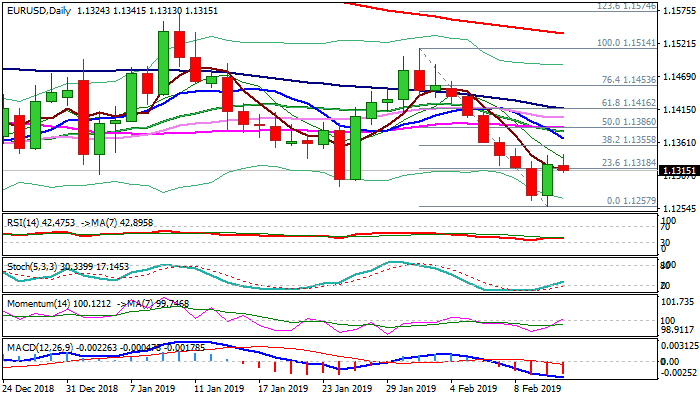
Tight consolidation after Tuesday's rally keeps recovery limited for now and fails to benefit from positive signal on bullish outside day, left on Tuesday. Weaker dollar on renewed risk appetite on optimism over US/China trade talks, maintains positive sentiment, with fresh bullish momentum and stochastics' reversal from oversold territory, adding to positive signals. On the other side, south-heading daily MA's in full bearish setup and forming multiple bear-crosses, maintain pressure. Recovery stays so far under pivotal Fibo barrier at 1.1355 (38.2% of 1.1514/1.1257), break of which would ease existing bearish pressure and open way for further recovery. Downbeat EU IP (Dec m/m -0.9% vs -0.4% f/c) data may further weaken near-term structure and signal an end of recovery.
Res: 1.1341, 1.1355, 1.1367, 1.1386
Sup: 1.1300, 1.1289, 1.1257, 1.1215