Sample Category Title
EUR/USD – Euro Under Pressure As German Manufacturing Sags
EUR/USD continues to lose ground this week. In the Thursday session, the pair is trading at 1.1329, down 0.13% on the day. In economic news, German industrial production declined by 0.4%, well short of the forecast of a 0.8% gain. The ECB released its economic forecasts for EU members. In the U.S., unemployment claims is expected to drop sharply, with an estimate of 220 thousand. On Friday, Germany releases trade balance.
Global trade tensions and weakness in the German auto sector continue to weigh on the manufacturing sector.. Industrial production fell 0.3% in December, its sixth decline in seven months. This follows manufacturing production, which plunged 1.6% in December. Manufacturing PMI in January slipped below the 50-level, which separates contraction from expansion, for the first time in over four years. Weakness in manufacturing can be seen across the eurozone, as France and Italy both posted manufacturing PMIs in contraction territory in January. German consumer indicators have also stumbled, raising concerns about the health of the eurozone’s largest economy. CPI declined by 0.8% in January and retail sales plunged 4.3% in December. If the soft numbers continue, the euro will be hard pressed to hold its own against the dollar.
The ECB has projected moderate growth in the EU, but uncertainty has dampened confidence. The bank’s lowered its growth forecast for the eurozone to 1.9% in 2018, down from 2.1% in the November forecast. For 2019, the growth forecast has also been revised down to 1.5%, compared to 1.9% in the November forecast. Inflation slipped in late 2018 due to lower oil prices, with an average inflation level of 1.7%. This is expected to dip to 1.6% in 2019. The report highlighted Brexit and the slowdown in China as key sources of uncertainty for European economies, adding that the projections were subject to downside risks.
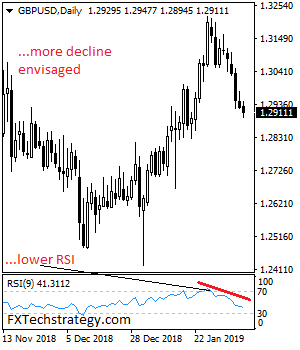
GBPUSD Remains Vulnerable To The Downside On Bear Pressure
GBPUSD remains vulnerable to the downside as more weakness is expected in the days ahead.Support is seen at 1.2900 level. Further down, support comes in at the 1.2850 level where a break will turn focus to the 1.2800 level. Further down, support lies at the 1.2750 level. Below here will set the stage for more weakness towards the 1.2700 level. On the upside, resistance stands at the 1.3000 with a turn above here allowing for additional strength to build up towards the 1.3050 level. Further out, resistance stands at the 1.3100 level followed by the 1.3150 level. On the whole, GBPUSD faces further downside pressure on further weakness.
GBP/JPY 4H Chart: Sets For Breakout
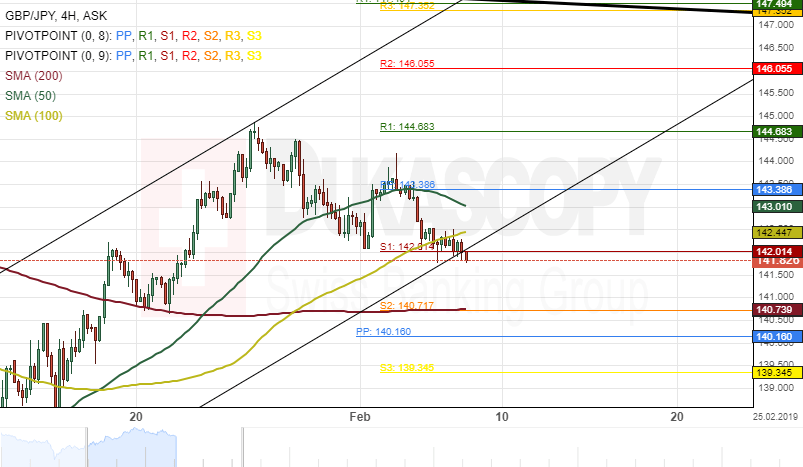
The British Pound has depreciated about 1.99% in values against the Japanese Yen since January 25.
The exchange rate is currently trading near the lower boundary of a junior ascending channel pattern at 142.01.
If the currency pair passes the bottom border of the channel pattern, a decline towards a support cluster formed by the 200-hour simple moving average and the weekly S2 at 140,71 could be expected.
However, if the junior ascending channel holds, bulls might target a resistance level at 144.68 in the shorter term.
AUD/JPY 4H Chart: Breaches Junior Channel
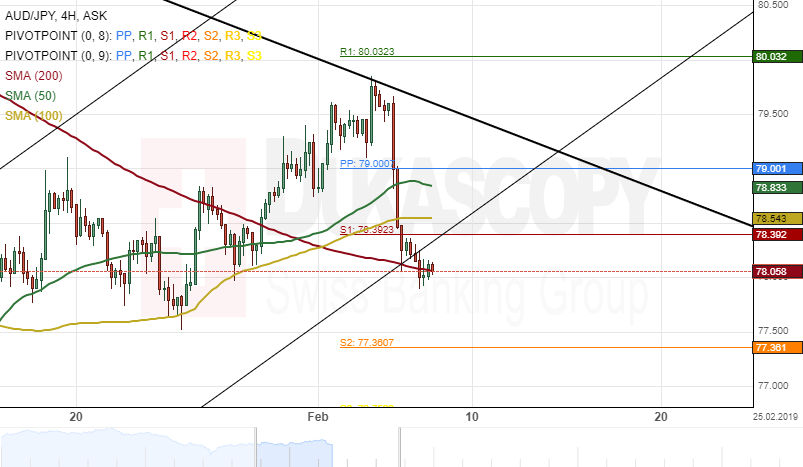
The Australian Dollar has appreciated about 2.12% in values against the Japanese Yen since January 30. However, after hitting the upper boundary of a dominant descending channel pattern, the exchange rate began to decline.
The currency pair broke a junior ascending channel pattern during the Asian session on Thursday.
Given that a breakout had occurred, it is likely that the Aussie will continue its decline within this session.
The possible downside target in the shorter term will be near a support level formed by the weekly S3 at 76.75.
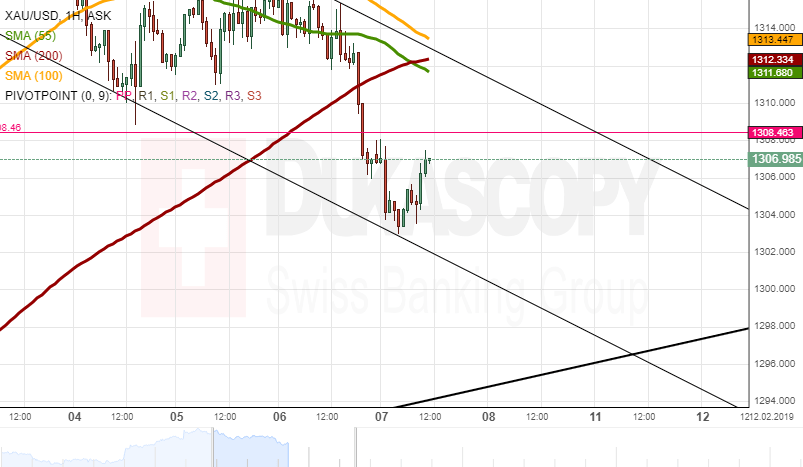
XAU/USD Analysis: Will End The Day At 1,300.00
During the previous trading session, the resistance of the 200-hour simple moving average forced the yellow metal to pass through the support level of the monthly pivot point at 1,308.46. On Thursday morning, the gold was located below the monthly PP at the 1,306.77 mark.
In regards to the near-term future, most likely, the resistance of the monthly pivot point will retrace the rate to push the yellow metal to trade sideways at the 1,300.00 level for the rest of the day.
Meanwhile, the 55-hour and the 200-hour simple moving averages are trying to catch up the rate to give further retracement to the rate on Friday.
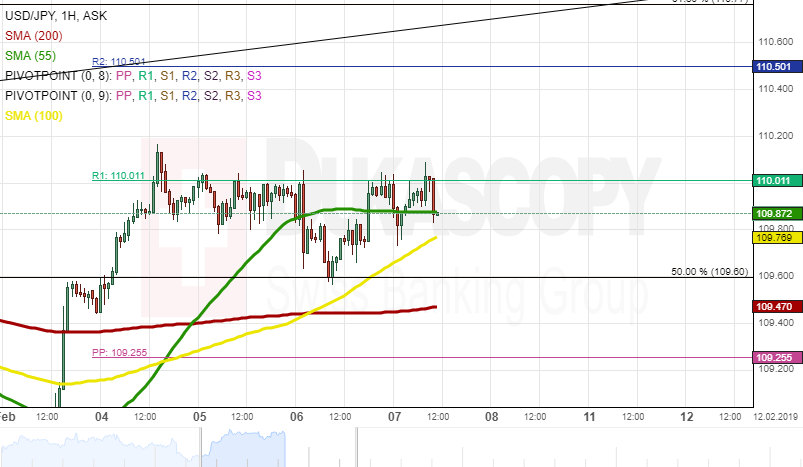
USD/JPY Analysis: Aims To R2 At 110.50
During the previous trading session, the rate was supported by the 100-hour simple moving average to break the resistance of the 55-hour simple moving average. On Thursday morning, the rate was located at the weekly R1 at the 110.01 mark.
In regards to the near-term future, most likely, the simple moving averages together with the support of the weekly R1 will push the currency exchange rate towards the weekly R2 at the 110.50 mark.
On the other hand, the rate could break the resistance of the weekly R1 at 110.01 to trade sideways at the 110.20 level for the rest of the trading session.
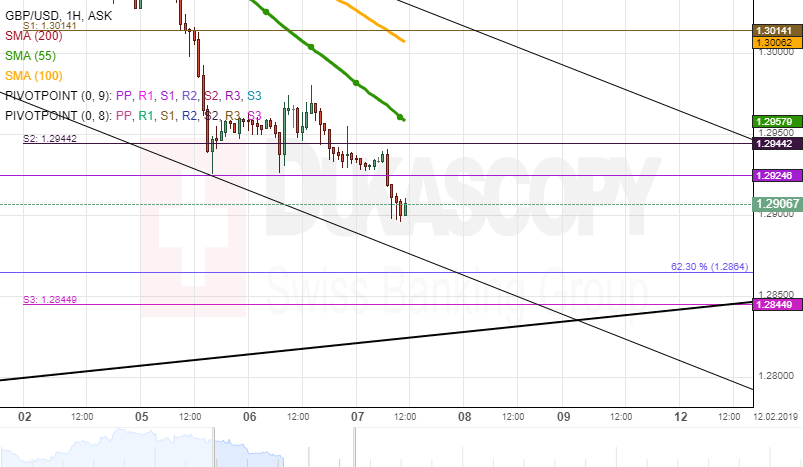
GBP/USD Analysis: Trades To 62.30% Fibo
During the previous trading session, the currency exchange rate traded between the weekly S2 and the monthly PP to end the trading session at the 1.2932 mark. On Thursday morning, the rate passed through the support of the monthly PP at 1.2924 to trade at the 1.2904 mark.
In regards to the near-term future, the British Pound will depreciate to the 62.30% Fibonacci retracement level at 1.2864. Afterward, most likely, the rate will trade sideways at 1.2850 for the rest of the trading session.
On the other hand, the British Pound could appreciate against the US Dollar to the 1.2950 level during today's Bank of England Interest Rate and the votes release at 12:00 GMT.
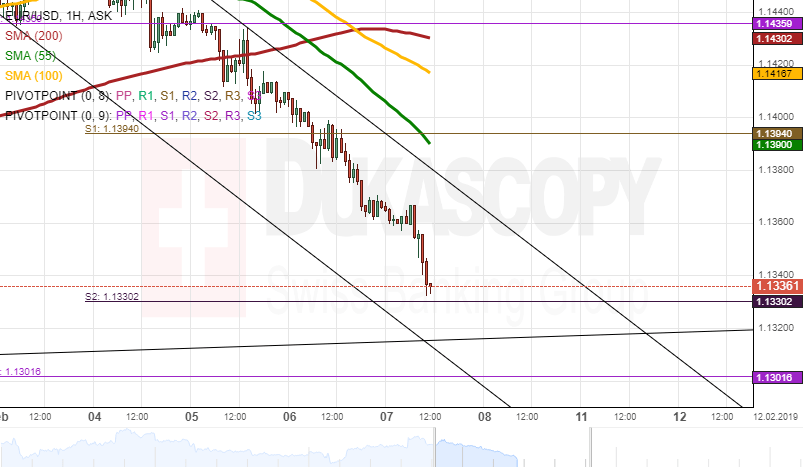
EUR/USD Analylsis: FallsTo 1.1340
On Thursday morning, the currency exchange rate was located at the 1.1345 mark.
In regards to the near-term future, it is expected that the European Single Currency will continue depreciating against the US Dollar to the weekly S2 at the 1.1330 mark. Moreover, most likely, the rate will pass the support level of the weekly S2 to bounce off the small pattern line at the 1.1320 mark.
However, the rate could be retraced by the weekly S2 to stay at the 1.1340 level for the rest of the trading day.
USD/TRY Outlook: Recovery Picks Up And Focuses Key 200SMA Barrier
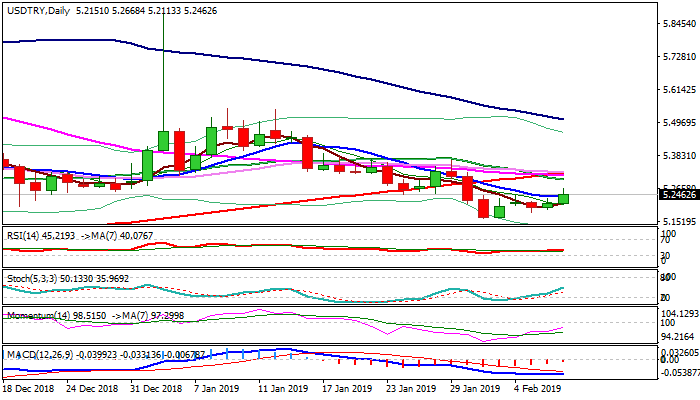
Recovery off 5.16 zone higher base (31Jan / 2Feb) is picking up and hit new high at 5.2668 today (one week high) after a higher low was left at 5.1827. Recovery probed above sideways-moving 10SMA (5.2388) and is underpinned by north-heading 5SMA (5.2148). Rising momentum and stochastic support scenario which requires close above 10SMA for initial fresh bullish signal to open way towards 20SMA (5.2962) and the most significant broken 200SMA (5.3192). Sustained break above 200SMA is needed to confirm reversal and question larger lira's longs. Daily cloud twist could be also magnetic for recovery action. Negative signal could be expected on return below 5SMA, while extension below 5.1827 higher low would weaken near-term structure and revive lira's bulls.
Res: 5.2668, 5.2962, 5.3192, 5.3273
Sup: 5.2388, 5.2148, 5.1827, 5.1600
USDJPY Bullish Pattern Forming
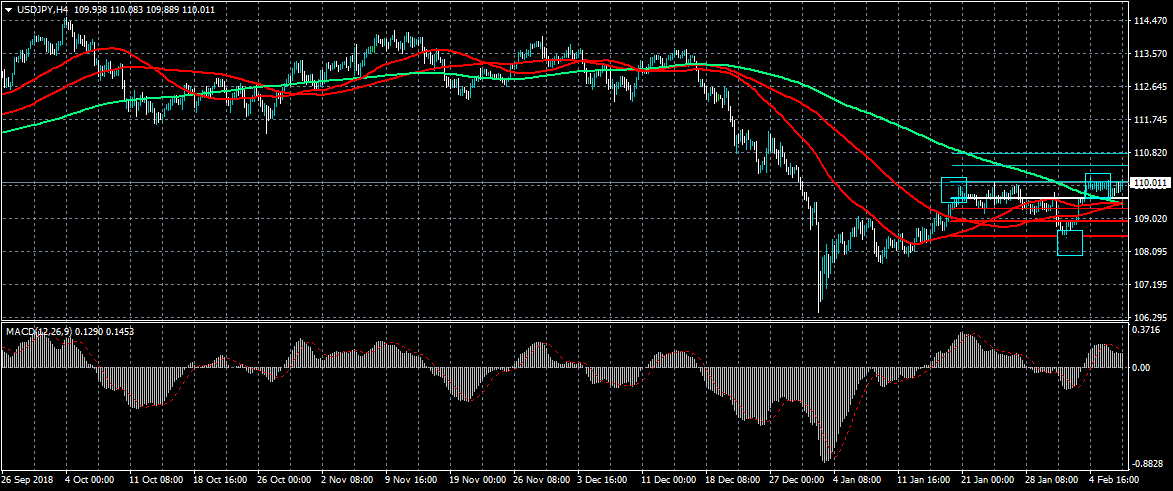
The US dollar is once again testing the key 110.00 level against the Japanese yen currency after sellers failed to breach the pivotal 109.60 level on Wednesday. A bullish inverted head and shoulders is visible on the four-hour time frame, with a protected upside target of around one-hundred and fifty points. An advance above the 110.00 level is supported by the recent strong move higher in the US dollar, as it continues to firm against a basket of top currencies.
The USDJPY pair is bullish while trading above the 110.00 level, key technical resistance is found at the 110.40 and 110.80 levels.
If the USDJPY pair fails to move above the 110.00 level, sellers may test towards the 109.60 and 109.14 support levels.