

Sample Category Title
Fed Bullard: Interest rate now a little bit restrictive
St. Louis Fed President James Bullard just described current interest rate as "a little bit restrictive" after that rate hike in December. And, to him, Fed is now "putting downward pressure rather than upward pressure on inflation". And that could drag core inflation further below Fed's 2% target. Thus, he expects Fed to miss inflation target again in 2019.
Further, Bullard warned that "I do think it has damaged us to have continually missed on the low side." Thus, Fed has too "tread carefully" this in regarding interest rate decisions.
According to Fed's own December projections, the longer run federal funds rate sat at 2.5-30% (central tendency) and 2.5-3.5% (range). Current federal funds rate is at 2.25-2.50%, which is still below the long running range.
Bank Of England Review: Sitting, Waiting, Wishing For Brexit Clarification
As expected, the Bank of England (BoE) voted unanimously to keep the Bank Rate at 0.75%. As expected, it lowered both its GDP and CPI inflation projections.
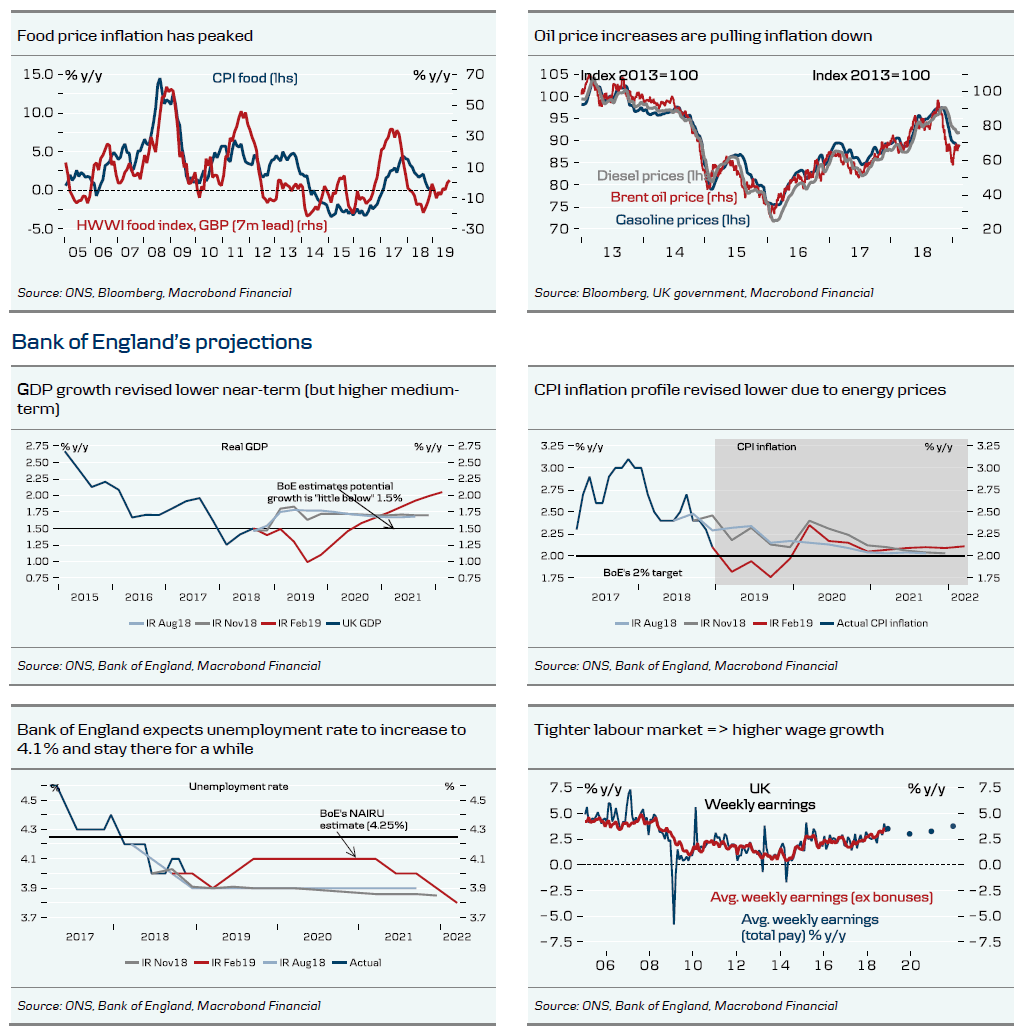
The Bank of England did not make any big policy signal shifts either. The statement still says that ‘an ongoing tightening of monetary policy over the forecast period, at a gradual pace and to a limited extent, would be appropriate…’, i.e. still a hiking bias despite recognising growth has slowed both globally and in the UK. The reason is that the Bank of England still projects excess demand of 0.75% of GDP in three years.
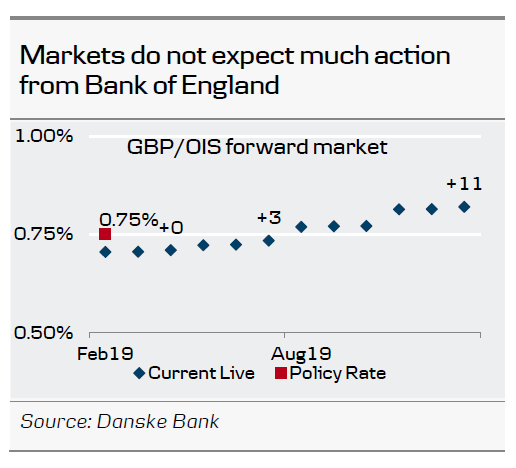
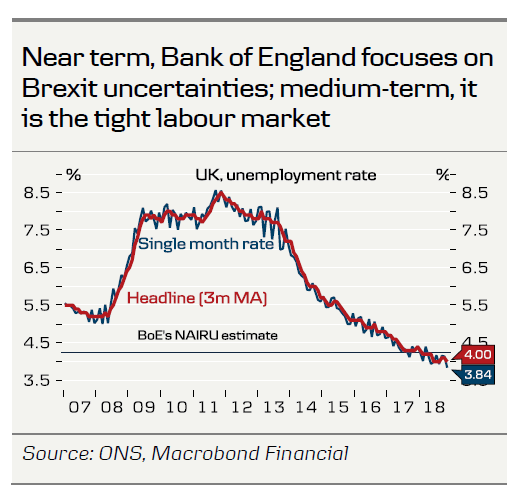
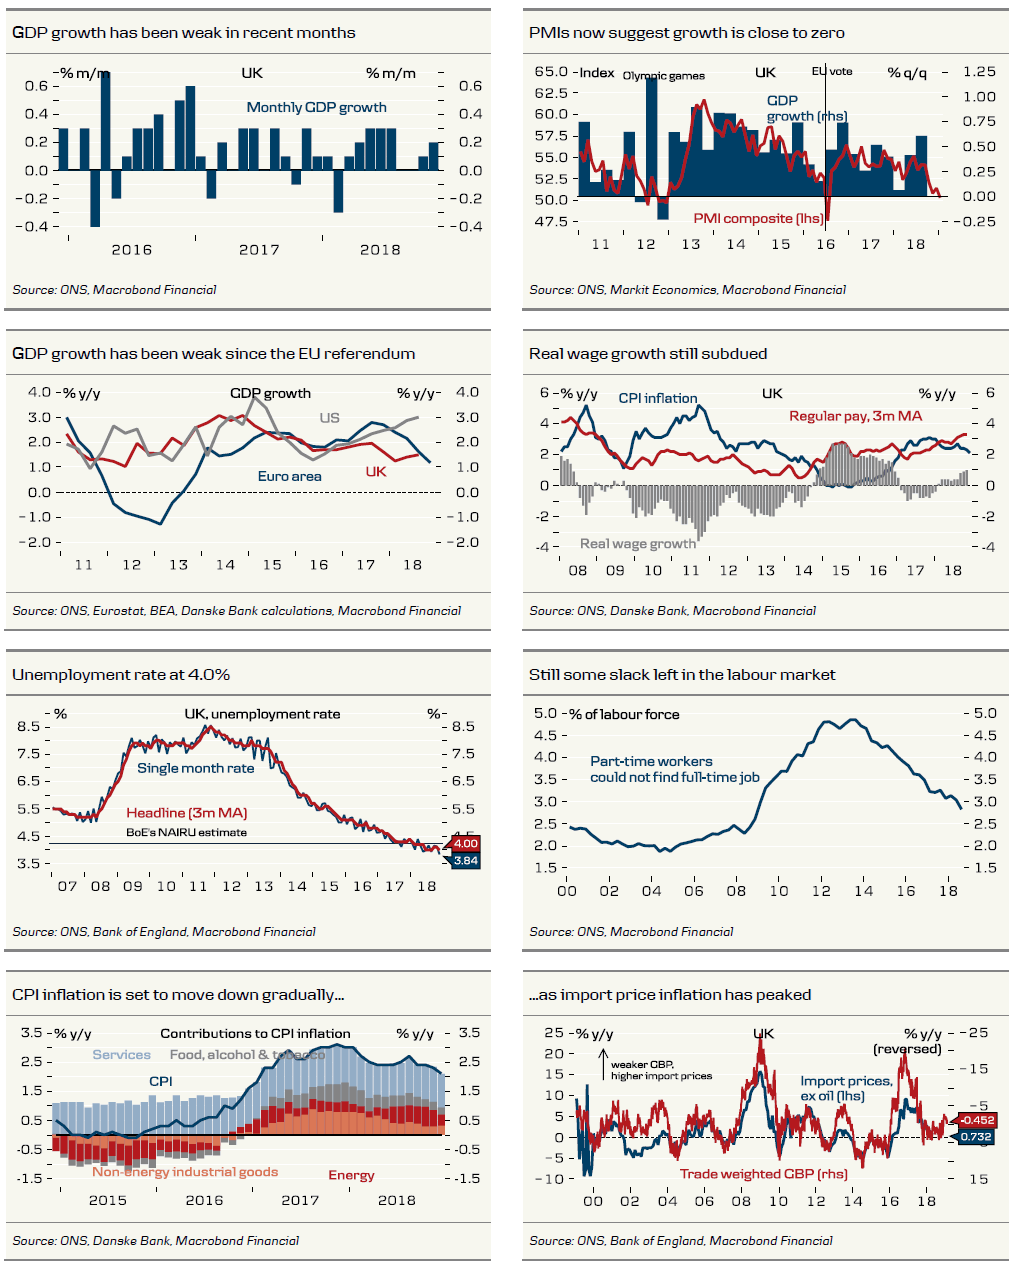
Last month, we changed our BoE call and now we expect it to be on hold until November (previously May). Markets are less certain and do not price in any action from the BoE in the near future. Near term, the case for a rate hike has diminished, with weaker economic data and high Brexit uncertainty and, in our view, it is difficult for markets to start pricing further BoE rate hikes until we get some Brexit clarification.
However, the next hike may come earlier if we actually get some clarification soon. As Mark Carney highlighted during the press conference, growth may surprise on the upside after Brexit clarification, as companies could restart investments plans that have been postponed due to Brexit uncertainties. If this materialises soon, the hike could still come earlier. This also highlights that markets are in a hole right now.
In case of a no-deal Brexit (which is definitely not our base case), we expect the Bank of England to ease monetary policy. While the Bank of England cannot offset lower potential growth due to changes in the supply side of the economy, it can react to demand changes. Our view is that a ‘no-deal Brexit’ would be likely to hit the economy through lower demand due to lower business confidence.
For our latest take on Brexit, see Brexit Monitor – May has two and half weeks to renegotiate the backstop, 29 January. Based on recent developments, PM Theresa May and the EU27 plan to meet again in late February and the next ‘meaningful vote’ has been postponed. Next week, on 14 February, the UK House of Commons is due to vote on a statement from PM Theresa May (which is amendable), giving MPs another chance to tell her what they want (including voting for a possible extension of Article 50).
The GBP quickly recovered from the initial knee-jerk sell-off following the BoE announcement and continued rallying during the press conference, as BoE Governor Mark Carney said that markets should not prepare for no further rate hikes in the UK. We still expect the BoE to hike in November 2019, while the market is pricing in the next hike arriving in June 2021. Hence, higher UK interest should be a supporting factor for GBP over the medium term.
However, in the short term, Brexit remains a key driver for the GBP. We still look for EUR/GBP to remain in the 0.86-0.89 range. We maintain the view that it would require a further reduction in the ‘no deal’ Brexit risk for EUR/GBP to test and eventually break below 0.86, while appetite for GBP is likely to deteriorate as 26 February approaches without any signs of an agreement between the EU and UK.
GOLD Price And Crude Oil Price Facing Crucial Resistances
Gold price remained in a bearish zone and declined below the $1,310 support area. Crude oil price is following a bearish structure below the $53.20 and $53.60 levels.
Important Takeaways for Gold and Oil
- Gold price started a major decline and traded below the $1,316 and $1,310 supports against the US Dollar.
- There is a major bearish trend line in place with resistance at $1,310 on the hourly chart of gold.
- Crude oil price traded lower and broke the $54.00 and $53.60 support levels.
- There is a declining channel formed with resistance at $53.75 on the hourly chart of XTI/USD.
Gold Price Technical Analysis
After a decent upward move, gold price faced a strong resistance near the $1,325 level against the US Dollar. The price started a downside move and broke the $1,320, $1,316 and $1,310 support levels.
The price even broke the $1,306 support level and traded close to $1,300. A low was formed at $1,302 on FXOpen and later the price started an upside correction. It moved above the $1,305 and $1,306 resistance levels.
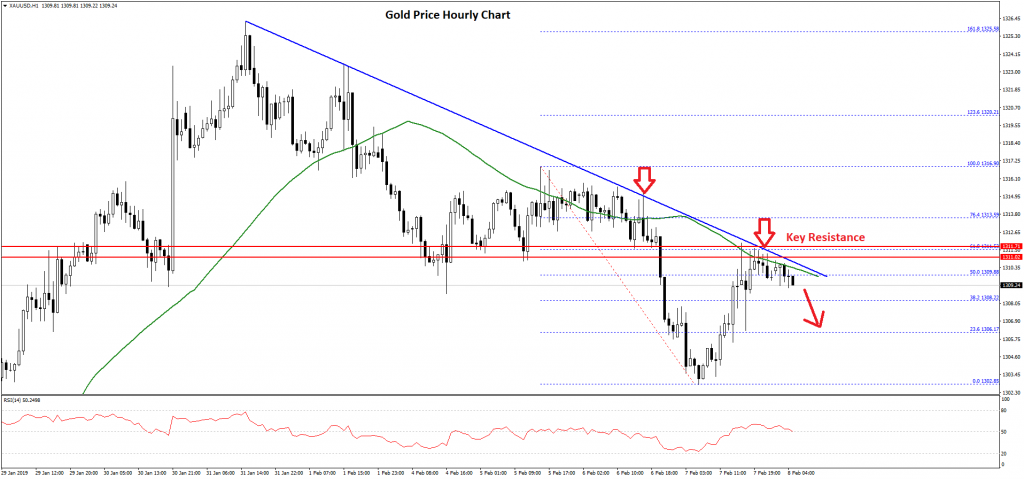
There was a break above the 50% Fib retracement level of the recent decline from the $1,316 high to $1,302 low. However, the price faced a strong resistance near the $1,310-1,311 area and the 50 hourly simple moving average.
Moreover, the price failed near the 61.8% Fib retracement level of the recent decline from the $1,316 high to $1,302 low. Finally, there is a major bearish trend line in place with resistance at $1,310 on the hourly chart of gold.
The current price action suggests that the price is trading below the key $1,310 resistance plus the 50 hourly simple moving average. If it continues to struggle, there could be a fresh decline towards the $1,306 and $1,302 support levels.
On the other hand, an upside break above the $1,310 resistance plus the 50 hourly simple moving average might push the price towards the $1,315 level.
Oil Price Technical Analysis
Crude oil price also started a downside move after it failed to break the $56.00 resistance against the US Dollar. The price traded lower and broke the $55.00 and $54.00 support levels to move into a bearish zone.
More importantly, there was a break below the $53.60 support and the 50 hourly simple moving average. The price traded close to the $52.00 level and a low was formed at $52.08. Later, there was a minor upside correction above the $52.50 level.
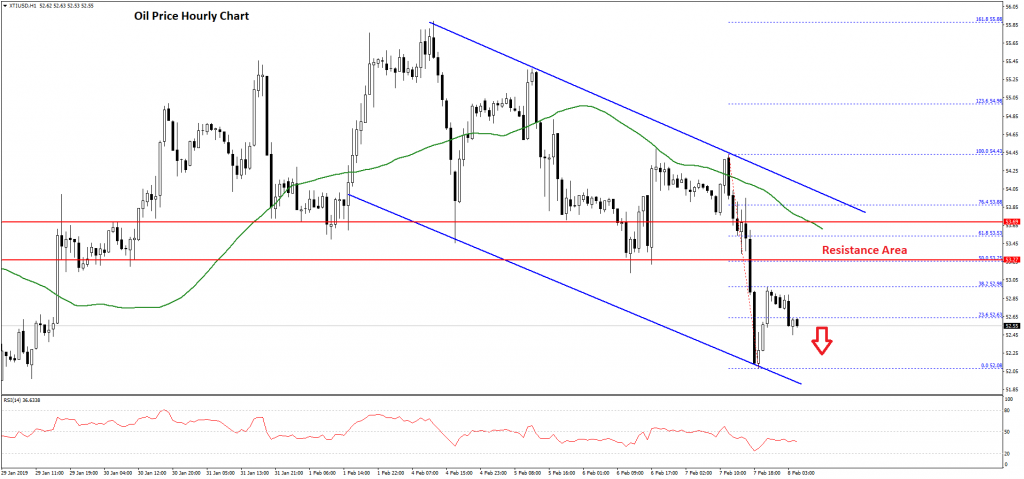
There was a break above the 23.6% Fib retracement level of the recent decline from the $54.43 high to $52.08 low. However, the price seems to be struggling near the $53.00 resistance.
At the outset, there is a declining channel formed with resistance at $53.75 on the hourly chart of XTI/USD. On the upside, the most important resistance is near the $53.50 and $53.60 levels.
Besides, the 50% Fib retracement level of the recent decline from the $54.43 high to $52.08 low is near the $53.25 level to act as a resistance. Therefore, if there is an upside correction towards the $53.25 and $53.50 levels, sellers are likely to defend gains.
On the downside, an initial support is at $52.20, below which the price could test the $52.00 support. The main supports are visible near $51.50 and $51.20.
RBA Shifts to a More Balanced View
The RBA has started the year with a significant shift, lowering its growth outlook and acknowledging greater uncertainties and downside risks.
The RBA has started the year with a significant shift, lowering its growth outlook and acknowledging greater uncertainties and downside risks. While the Board still expects the economy to track towards its employment and inflation targets, and does not see a strong case for a near term change in the cash rate, there has been a clear change in emphasis. In particular, the Governor has moved from the view, expressed throughout 2018, that “the next move in the cash rate was more likely to be an increase than a decrease” to one in which the probabilities of the next move being up or down are “more evenly balanced”.
This move to a balanced rate outlook is significant because it clearly establishes that the Bank is prepared to contemplate rate cuts - a position that has really only emerged since the housing markets have reversed. It is also consistent with changes announced by other central banks notably the US Federal Reserve. We see these changes as a welcome shift, bringing the RBA’s thinking more into line with our own.
As expected, the Reserve Bank Board again left the cash rate unchanged at 1.5% at its February meeting. Also as expected, the Bank has lowered its forecasts for growth – outlined in the Governor’s decision statement and detailed more fully in his speech a day later. The RBA’s growth forecast for 2019 has been revised down from 3¼% to 3%, and its forecast for 2020 revised from 3% to 2.75%, the slowdown year to year reflecting a tapering in resource export volumes. It is significant that growth on average is still expected to be around the ‘trend’ rate of 2¾%.
The RBA has also revised its inflation outlook with the forecast for underlying inflation for 2019 reduced from 2¼% to 2%, while the 2020 forecast remains at 2¼%. The Bank is maintaining the view that inflation will gradually move into the 2-3% band, although it is expected to take somewhat longer than previously expected.
There are good reasons why the Bank lowered its growth forecasts.
Firstly, while it still assesses the outlook for global growth as “reasonable”, it recognises that “downside risks have increased” (notably, when asked to rank the risks to the economic outlook, the Governor still nominates ‘global’ issues as a bigger concern).
Secondly, it has made some significant changes around the household sector and housing.
For some time, Westpac has argued that the fall in house prices in Sydney and Melbourne would be associated with a negative wealth effect weighing on consumer spending. In the RBA’s previous writings, it tended to dismiss this prospect. Although it is still downplayed, the Governor’s latest speech gives more weight to the issue, noting that rising housing prices provided an offset to slow income growth for some households and this effect is now shifting but that an expected pick-up in household disposable income was seen as providing a counterweight to the wealth effects of lower housing prices. Specifically, consumption growth is expected to hold at 2.75% in line with disposable income growth, implying a stabilisation in the savings rate. This ‘housing-consumer nexus’ is seen as a key area of uncertainty. It remains the key point of difference between Westpac’s 2.6%yr growth forecast for this year and next and the RBA’s at or above trend view.
Westpac has also argued that residential housing construction would be a drag on growth in both 2019 and 2020. The RBA did not support that view, referring to a strong pipeline and only a gradual decline. Recent falls in dwelling approvals, across both high rise and non high rise segments, are now pointing more clearly to a significant drag on growth from the housing construction downturn. Accordingly the RBA has downgraded its view, the Governor indicating dwelling investment is forecast to decline by about 10% over the next two and a half years.
The RBA continues to see rising business investment and higher levels of public infrastructure spending as the key growth drivers. It also remains positive about the labour market, reaffirming its forecasts for the unemployment rate to fall further to 4¾% by the end of 2020 and an associated lift in wages growth.
The Reserve Bank’s revised view has narrowed the gap with our own but Westpac remains more downbeat. Even so, our weaker forecasts have not been weak enough to warrant forecasting a rate cut. Accordingly, even if the RBA moves further towards Westpac’s current view it seems likely that rates will remain on hold.
The threshold for policy is whether spillovers knock the labour market off course. Our current forecasts do not incorporate that prospect but we acknowledge downside risks.
I am primarily responsible for the content of this research report and I certify that:
to the best of my knowledge, I am not in receipt of inside information and the research does not contain inside information; and
no other part of the licensee has made any attempt to influence the research.
USD/JPY Hesitates, But Further Gains Likely
Key Highlights
- The US Dollar climbed higher recently, but it failed near the 110.15 resistance against the Japanese Yen.
- Earlier, there was a break above a bearish trend line at 109.60 on the 4-hours chart of USD/JPY.
- The US Initial Jobless Claims for the week ending Feb 02, 2019 declined from 253K to 234K.
- Canada’s Employment Figure for Jan 2019 will be released today, which could change by 8K.
USDJPY Technical Analysis
Earlier this week, there was a decent upward move in the US Dollar above 109.50 against the Japanese Yen. The USD/JPY pair traded above the 110.00 resistance before starting a downside correction.
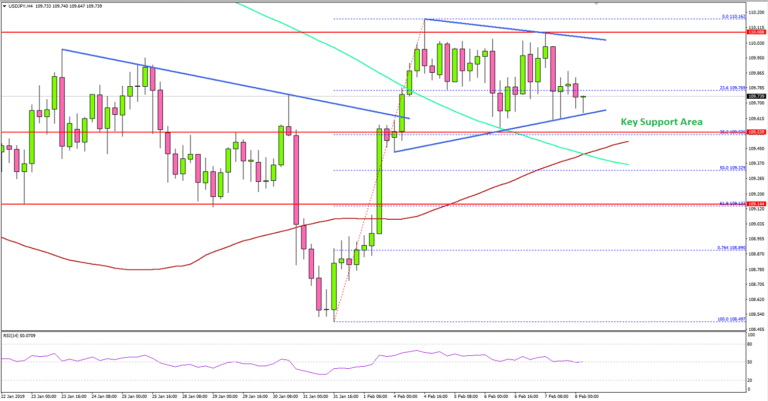
Looking at the 4-hours chart, the pair traded gained momentum once it broke the 109.50 resistance plus the 100 (red) simple moving average (4-hours) and 200 (green) simple moving average (4-hours).
Besides, there was a break above a bearish trend line with resistance at 109.60. The pair finally broke the 110.00 resistance and topped at 110.16. Later, there was a downside correction below 109.80 and the 23.6% Fib retracement level of the last wave from the 108.49 low to 110.16 high.
However, there are many supports on the downside near the 109.50 level (the previous resistance). Moreover, the 100 (red) simple moving average (4-hours) is near 109.35 and the 50% Fib retracement level of the last wave from the 108.49 low to 110.16 high.
Therefore, dips from the current levels could find a strong support near 109.50 or 109.35. On the upside, the pair must successful settle above 110.20 to gain strength towards 110.50 and 111.00.
Fundamentally, the US Initial Jobless Claims figure for the week ending Feb 02, 2019 was released recently by the US Department of Labor. The market was looking for a decline in claims from 253K to 221K.
However, the result was lower than the forecast as the claims declined to 234K, less than the 221K forecast. The report added that:
The advance number for seasonally adjusted insured unemployment during the week ending January 26 was 1,736,000, a decrease of 42,000 from the previous week’s revised level. The previous week’s level was revised down by 4,000 from 1,782,000 to 1,778,000.
Overall, EUR/USD and GBP/USD faced an increased selling pressure this week, which could support more gains in USD/JPY in the near term.
Economic Releases to Watch Today
- Germany’s Trade Balance for Dec 2018 – Forecast €18.4B, versus €19.0B previous.
- Canada’s Employment Change Jan 2019 – Forecast 8.0K, versus 9.3K previous.
- Canada’s Unemployment Rate Jan 2019 – Forecast 5.7%, versus 5.6% previous.
BOE Downgrades Growth and Inflation Forecasts, Expects Fewer Tightening Despite Retaining Forward Guidance
BOE joined other central banks in downgrading the economic growth outlook. In addition to heightened risks of global growth slowdown, ongoing Brexit uncertainty is the key concern for the members. The members voted unanimously to keep the Bank rate at 0.75% and the asset purchase program at 435B pound. With the policy rate only +50 bps above the level of the post-referendum reduction and no change in the QE program, BOE’s monetary policy is more accommodative than that of the Fed. While Governor Mark Carney affirmed that the next move should be a hike and the forward guidance stayed unchanged, it is based on the underlying assumption of smooth Brexit. Only when the chance of no-Brexit is reasonably ruled out can we, and the central bank, provide a more meaningful forecast on the timing of the next rate hike.
The central bank acknowledged that the global economy has slowed over recent months. Domestically, it noted that economic growth “slowed in late 2018 and appears to have weakened further in early 2019”. The members believed the moderation was driven by “softer activity abroad and the greater effects from Brexit uncertainties”. Inflationary pressure has greatly eased with headline CPI in December falling to +2.1% y/y. The members expected it to “decline to slightly below” the +2% target in the near term, due to “the sharp fall in petrol prices”. Yet, they still believed inflation to settles at a rate “a little above the target”.
The staff significantly downgraded its growth and inflation forecasts. GDP growth is revised lower to +1.2% (from +1.7%) and +1.5% (from +1.7%) for 2019 and 2020 respectively. Yet, growth for 2021 is revised higher by +0.2 percentage point to +1.9%. Inflation is expected to moderate to +2% (from +2.1%) for 2019, before improving to +2.1% in both 2020 and 2021.
may therefore provide less of a signal about the medium-term outlook”. At the press conference, Carney warned that no-deal Brexit, despite its low probability, would increase the chance of recession in the UK. After the parliament’s rejection on PM Theresa May’s deal and EU’s reluctance to negotiate “alternative arrangement” on Irish border, the deadlock signals that the UK might have to leave the EU with no deal or it might not be able to leave on time (March 29). According to Carney, the “timing of Brexit agreement and its implementation could change”. This could affect the movement of British pound, which in turn could affect the inflation outlook, given the country’s heavy reliance on exports
On the monetary policy outlook, the BOE reiterated that, “were the economy to develop broadly in line with its Inflation Report projections, an ongoing tightening of monetary policy over the forecast period, at a gradual pace and to a limited extent, would be appropriate to return inflation sustainably to the 2% target at a conventional horizon”. This suggests that the next move would still be a hike. Of course, any rate hike would only take place after “the fog of Brexit” is clear. Another point to note is that BOE’s forecasts were made under the assumption of “market-based Bank Rate expectations”. Given the market has markedly push back the expectation on rate hike, less tightening will be required to keep inflation at target. The market now expects only one rate hike in the coming 2 years, down from two in November. Therefore, although BOE has retain its forward guidance, it is forecasting fewer rate hikes than was suggested in November.
Market Morning Briefing: Aussie Is Headed Towards 0.70
STOCKS
Renewed concerns on the US-China trade war has taken some profits off the table from the US equities. A downward revision in growth from the Bank of England and the European Union have triggered a sharp fall in the Euro region. The Asians are felling the pressure from the overnight sell-off in the global markets.
Dow Jones (25,169.53, -220.77, -0.87%) can test its supports at 25,000 and 24,970. Whether Dow manages to bounce from these supports or not will decide the next move. A strong break below 24,970 will negate the bullish outlook and will drag the index to 24,850 and 24,770.
DAX (11,022.02, -302.7, -2.67%) has tumbled and is hovering above a crucial support level of 11,000. A strong break below this support can drag the index lower to 10,900 and 10,800.
Nikkei (20,467.94, -283.34, -1.37%) has fallen as expected and has broken below 20,500. A test of 20,400 and 20,350 is likely in the near term
The Indian benchmark indices seems to be not cheering the 25 basis point rate cut from the Reserve Bank of India yesterday. The Sensex (36,971.09, -4.14, -0.01%) and the Nifty 50 (11,069.40, 6.95, 0.06%) has come-off from the day's high to close on a flat note. Though the Sensex and Nifty has a near-term support at 36,750 and 11,050 respectively, they look vulnerable to break it on the back of the weakness in global equities. Sensex can test 36,500 and the Nifty can fall to 10,980 on a break below their respective near-term supports.
COMMODITIES
Gold and silver are getting safe haven support from the US-China trade spat and can consolidate in the near-term before we see a fresh rally. Copper is retaining its strength. Concerns on the slow-down in the global growth slow-down and demand keeps the oil prices presssured for fall in the near term.
Gold (1310) fell as expected to test 1303 and has bounce thereafter. The overall bullish bias remain intact. Gold could broadly remain range bound between 1290 and 1325 before we see a fresh rally towards 1350-1360.
Silver (15.70) is managing to hold above its support at 15.60 and can trade in a sideways range between 15.6 and 16.2 in the coming days.
Copper (2.83) continues to remain bullish. A test of 2.87 looks likely on a break above 2.85.
Brent (61.65) is struggling to breach 63 over the last few days. This leaves the near-term bias negative for a fall to 60.
WTI (52.6) fell sharply from around 54 to test 52 yesterday before bouncing to the current levels. Cluster of resistances are poised in between 53.3 and 53.8. While these resistances hold, a break and fall below 52 targeting 51 is possible.
FOREX
Dollar Index (96.59) has risen well but could possibly pause near immediate resistance at 97. Although there is scope of testing 98 on the upside in the medium term, a small dip from current levels or from 97 could be possible before the index tests 98 on the upside.
Euro (1.1338) is heading towards immediate trend support at 1.13 from where a bounce could be seen back towards 1.14/15 levels. Broad range of 1.16-1.13 continues to remain for now.
Euro-Yen (124.44) has come off as expected and could see a bounce from anywhere within 124.40-123.60 region. On a medium term, 126 is a crucial resistance and while that holds, it could gradually push Euro-Yen further down below 123.60. For now we could see an immediate bounce from levels above 123.60.
Dollar Yen (109.78) could see some stable and ranged movement within 110.5-109.5 region. While resistance at 110.5 holds, Dollar-Yen looks bearish and could fall towards 109.
Pound (1.2947) bounced back from 1.2850 and could rise in the near term while that holds. Some range trade within 1.2850-1.30 is possible today.
Aussie (0.7074) is headed towards 0.70. A fall below 0.70 could take it down further towards 0.6970 before we see a bounce from there. While Copper looks bullish, it is more likely that Aussie could bounce from 0.70 itself.
Dollar Rupee (71.46) came off sharply to test 71.30 before closing at 71.46 after the RBI cut rate by 25bps. While the Indian equities are strong and fall in Crude prices are expected, we could possibly see some more of Rupee strength in the near term. Upside resistance near 71.60/80 continues to hold for now.
INTEREST RATES
The US yields are trading low. The 5YR (2.46%), 10YR (2.65%) and the 30Yr (2.99%) are down from 2.50%, 2.69% and 3.03% respectively. Near term looks bearish for the US yields as we could see some more fall in the early sessions next week.
The UK yields are trading low but face immediate support near current levels. The 5Yr, 10Yr and 20Yr are trading at 0.8270%, 1.0640% and 1.62%, down from 0.8540%, 1.1020% and 1.6430% respectively. We may soon see a bounce back to higher levels.
The Indian 10YR GOI (7.50%) came off sharply after the RBI policy statement where the repo rate was cut by 25bps. The yield, if remains below 7.50% could come down to test 7.45-7.43% in the near term. Else an immediate bounce towards 7.55% is possible before coming off to levels below 7.50%.
Daily Markets Broadcast
Wall Street weakens on trade deal uncertainty
US indices softened yesterday as investors fretted about whether US and China could strike a deal before the March 1 deadline. This came about as Trump said he would not meet Xi before the end of the month.
US30USD Daily Chart
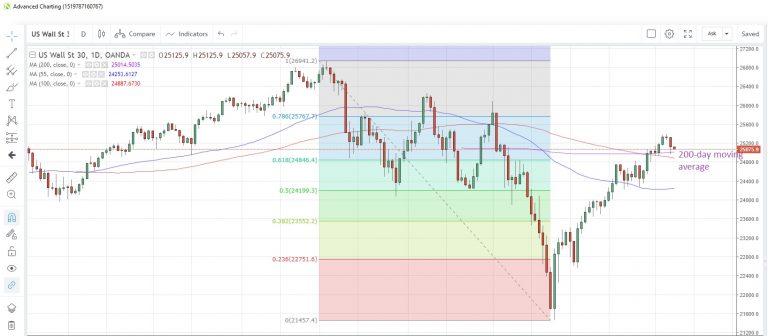
The US30 index fell for a second day yesterday amid concerns about whether a US-China trade deal can be brokered before March 1
The index is sitting just above the 200-day moving average at 25,014, with the 100-day moving average below at 24,887
There are no major data releases scheduled for today. Fed’s Bullard said US job market is performing well, but links to inflation are weaker.
DE30EUR Daily Chart
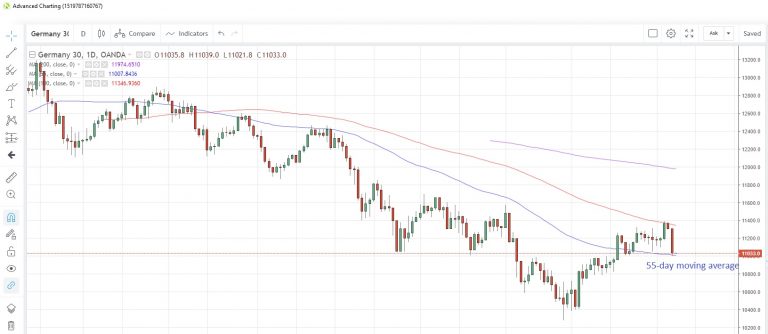
The Germany30 index fell the most in two months yesterday as German data continued to disappoint and the ECB downgraded growth forecasts
The index fell to test the 55-day moving average support at 11,014
Germany’s trade surplus is seen narrowing to EUR18.4b in December from EUR19.0b, with imports seen rising 0.2% m/m.
HK33HKD Daily Chart
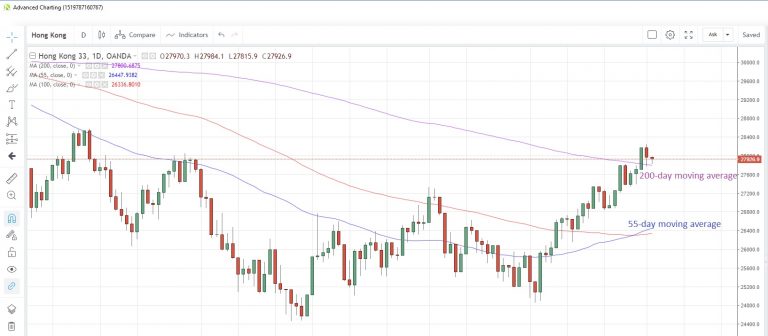
Hong Kong returns after a three-day holiday and the index is expected to play catch up with the slippage seen on Wall Street during that time
The 200-day moving average at 27,800 could give way. The 55-day moving average is at 26,447
A perceived lack of progress in the US-China trade talks will likely weigh on the index. When asked whether he will meet China’s Xi this month, US President Trump emphatically declared “no”.
Markets Get Lost In The Fog
US stock markets fell approximately one per cent in the overnight session as traders fretted that the US and China would not complete a trade deal by March 1st. A potential US Government shutdown restarting on February 15th has gone quiet in the news of late, but has most certainly not gone away.
The news wasn’t particularly good out from Europe either. (I shall include the UK in this, for now) The Bank of England (BOE) lamented the “fog of Brexit” and its effects on future UK growth. Not to be outdone, the ECB downgraded growth across the euro-zone and Germany announced abysmal industrial production numbers.
Hong Kong returns from holiday today with the tone of Asian markets likely to be “cloudy” following the overnight sessions. We have a very light calendar globally with German exports expected to be watched closely for further signs of deterioration. Canada employment data will spark some short term volatility.
In Asia, the RBA Statement on Monetary Policy will be the regional highlight and will be dissected in detail following the RBA’s shift in stance on rates this week.
FX
The US dollar strengthened overnight, more due to the travails of its counterparts than a strong dollar story. EUR and GBP continued wilting as poor Eurozone data, and the Brexit impasse continued. This theme could extend to the Asia session.
The AUD and NZD consolidated after yesterday’s aggressive sell-offs. The technical picture looks grim for both with any recovery looking like a dead cat bounce.
Regional currencies could weaken today in the face of a generally stronger USD.
Stocks
Asian bourses will likely follow the lead of North America and fall gently today as the week comes to an end. The exception could be Australia which has enjoyed an excellent week, supported by higher iron ore prices, a dovish Reserve Bank of Australia and a weaker currency.
Gold
Gold prices rose four dollars overnight to 1,308, shrugging off a stronger dollar. US – China trade worries continue to see safe-haven buyers looking to pick up gold on price dips. Gold continues to consolidate above the 1,300 level.
Oil
Brent and West Texas Intermediate (WTI) fell 2.50% and 1.60% respectively overnight as the dollar strengthened and the weather improved in the U.S. A lack of news will likely mean listless trading in the Asian session, with oil move inversely to the dollar.
Oil Lower After Libyan Supply News And US-China Trade Comments
West Texas Intermediate fell 2.48 percent on Thursday as US President Donald Trump confirmed he would not meet the Chinese President before the tariff deadline. Despite some positive comments in the last two weeks about the state of the talks, the chances of a positive outcome were dealt a heavy blow by the fact there would be no high-level meetings. The deadline to reach a deal is March 1 and as per the White House’s economic adviser the US and China still have a pretty sizeable distance to go.
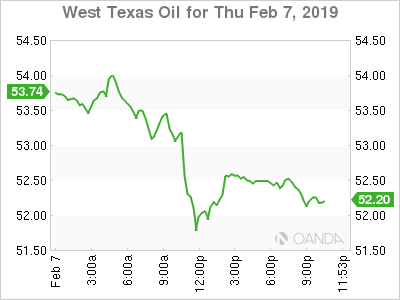
Venezuelan supply disruptions had prevented prices from falling earlier in the month, but as international pressure mounts on the Maduro government appears to be short lived.
Weekly crude stocks in the US were mixed keeping crude above $53 but as concerns rise on a lack of an agreement between the US and China would signal further global growth downgrades.
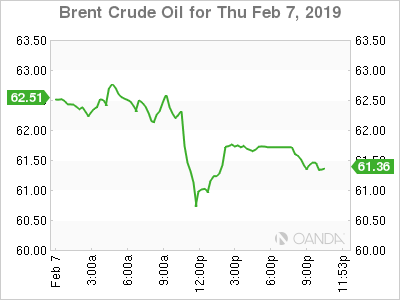
The OPEC agreement with major producers to cut output remains the biggest factor in keeping crude from falling further, but it remains to be seen how it for long it will last. Libyan production is expected to rise after the army took control of Sharara the largest oil field in the nation. Libya is exempt from production cuts given the armed unrest that was disrupting their energy operations.