Sample Category Title
GBP/USD Daily Outlook
Daily Pivots: (S1) 1.3010; (P) 1.3057; (R1) 1.3083; More....
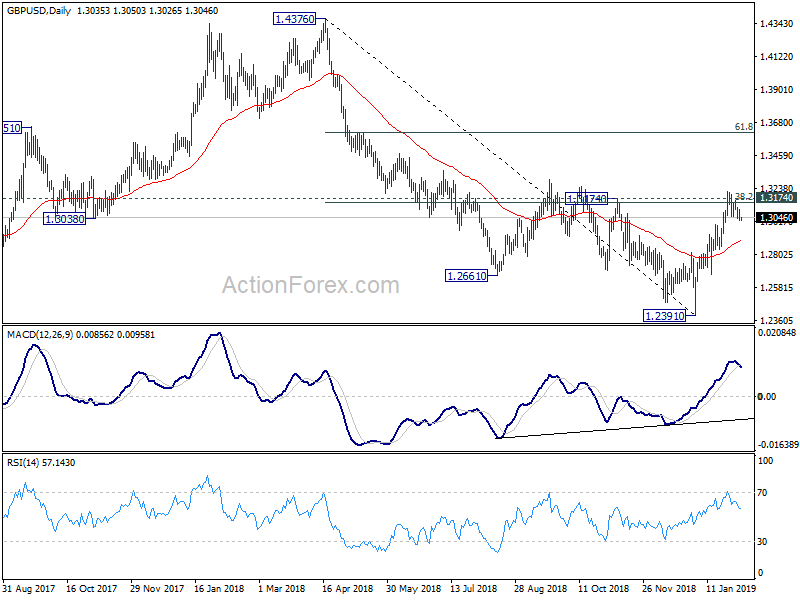
No change in GBP/USD's outlook. Intraday bias remains neutral for the moment. On the downside, break of 1.3012 minor support will suggest rejection by 1.3174 key resistance, and turn bias to the downside for 1.2814 support. On the upside, sustained break of 1.3174 key resistance will argue that whole decline from 1.4376 has completed at 1.2391. In such case, further rise should then be seen to 61.8% retracement of 1.4376 to 1.2391 at 1.3618.
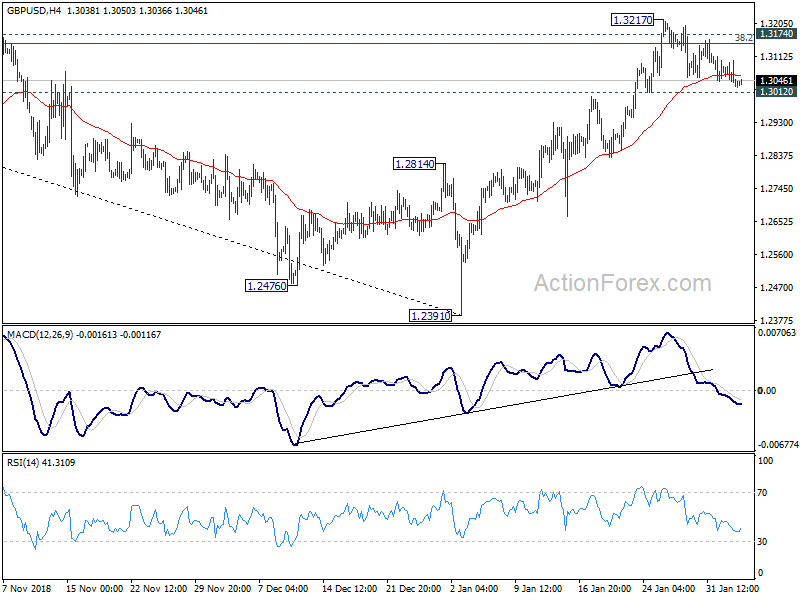
In the bigger picture, rise from 1.1946 (2016 low) to 1.4376 (2018 high) is seen as a corrective move. Similarly, fall from 1.4376 to 1.2391 also displace a corrective structure. Current development suggests that rise from 1.2391 is the third leg of the corrective pattern from 1.1946 and could extend beyond 1.4376 high. Firm break of 61.8% retracement of 1.4376 to 1.2391 at 1.3618 will affirm this case. On the downside, break of 55 day EMA (now at 1.2865) will turn focus back to 1.2391 low instead.
USD/CHF Daily Outlook
Daily Pivots: (S1) 0.9948; (P) 0.9971; (R1) 1.0003; More....
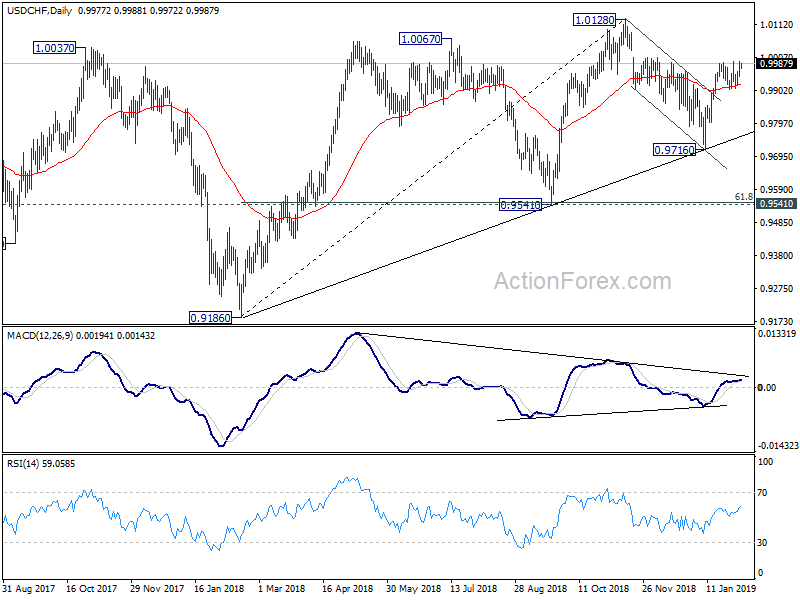
Intraday bias in USD/CHF remains neutral as it's staying in consolidation from 0.9994. Another fall could be seen. But downside should be contained by 38.2% retracement of 0.9716 to 0.9994 at 0.9888 to bring another rally. As noted before, the corrective decline from 1.0128 should have completed at 0.9716 already. On the upside, break of 0.9994 will extend the rise from 0.9716 to retest 1.0128 next. On the downside, though, firm break of 0.9888 will target 61.8% retracement at 0.9822 before completing the retreat.
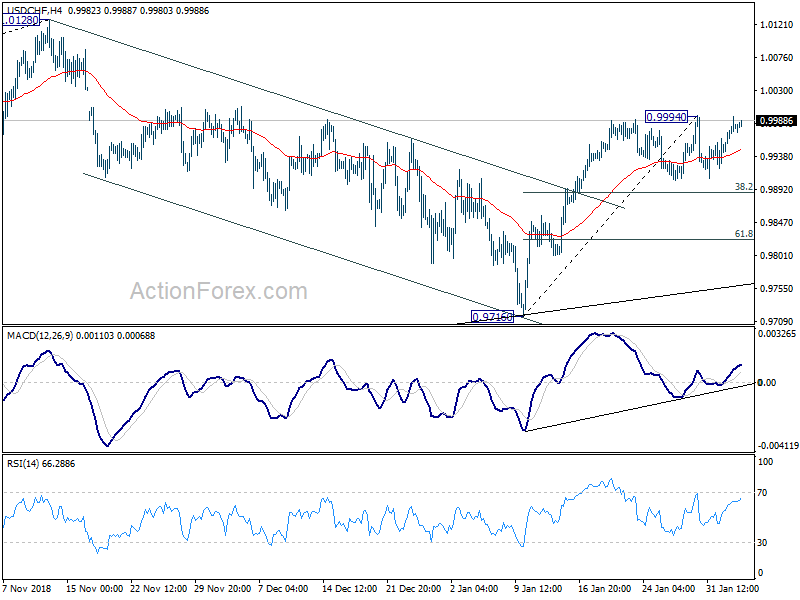
In the bigger picture, USD/CHF drew strong support from medium term trend line and rebounded. That suggests rise from 0.9186 is still in progress. Further break of 1.0128 will confirm up trend resumption and target 1.0342 key resistance. Nevertheless, break of 0.9716 will dampen this bullish view and at least bring deeper fall to 0.9541 key support.
ETHUSD Awaiting Triangle Break
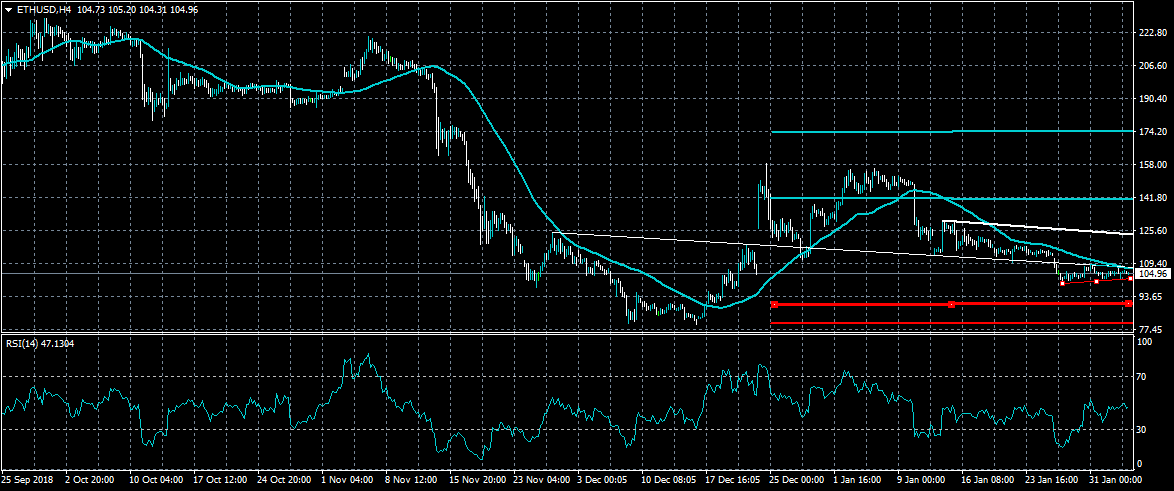
Ethereum remains under downside pressure in the near-term, with the third largest cryptocurrency by market capitalization trading within a triangle pattern. A bearish downside break is likely to encourage selling towards the $92.00 level, while a break to the upside may provoke a test of the $110.00 level. The Relative Strength Index on the four-hour time frame is showing that the ETHUSD pair has yet to reach oversold trading conditions.
The ETHUSD pair is bearish while trading below the $110.00 level, key support is found at the $92.00 and $78.00 levels.
If ETHUSD pair trades above the $110.00 level, key resistance is found at the $115.00 and $125.00 levels.
USD/JPY Daily Outlook
Daily Pivots: (S1) 109.51; (P) 109.83; (R1) 110.24; More...
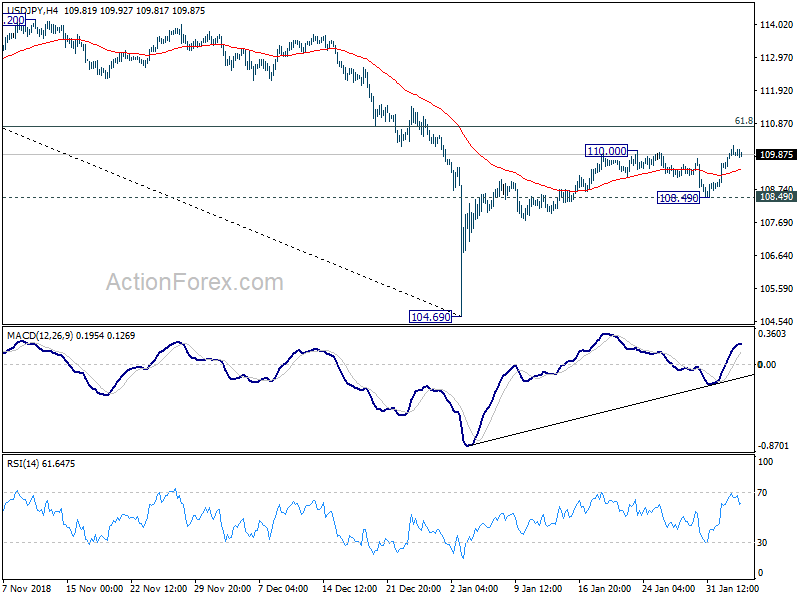
Intraday bias in USD/JPY remains mildly on the upside for the moment. Rebound from 104.69 is in progress for 61.8% retracement of 114.54 to 104.69 at 110.77. We'd expect strong resistance from there to limit upside. On the downside, break of 108.49 support will now confirm completion of the rebound and bring retest of 104.69 low. However, sustained trading above 110.77 will dampen our bearish view and target a test on 114.54 resistance instead.
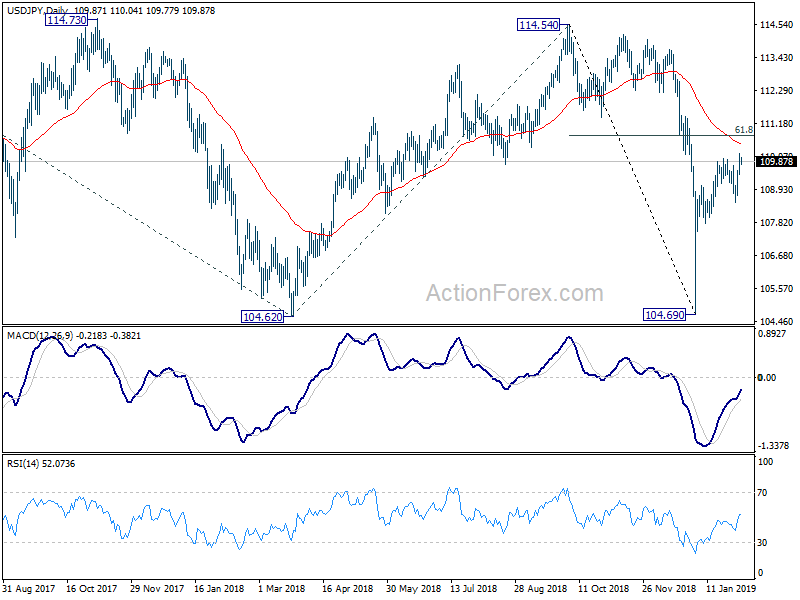
In the bigger picture, while the rebound from 104.69 is strong, there is no change in the view that it's a corrective move. That is, fall from 114.54, as part of the decline from 118.65 (2016 high), is not completed yet. Break of 104.62 will target 100% projection of 118.65 to 104.62 from 114.54 at 100.51, which is close to 100 psychological level. Nevertheless, sustained trading above 55 day EMA (now at 110.55) will dampen this bearish view and turn focus back to 114.54 resistance instead.
GBPUSD Intraday Bearish Bias
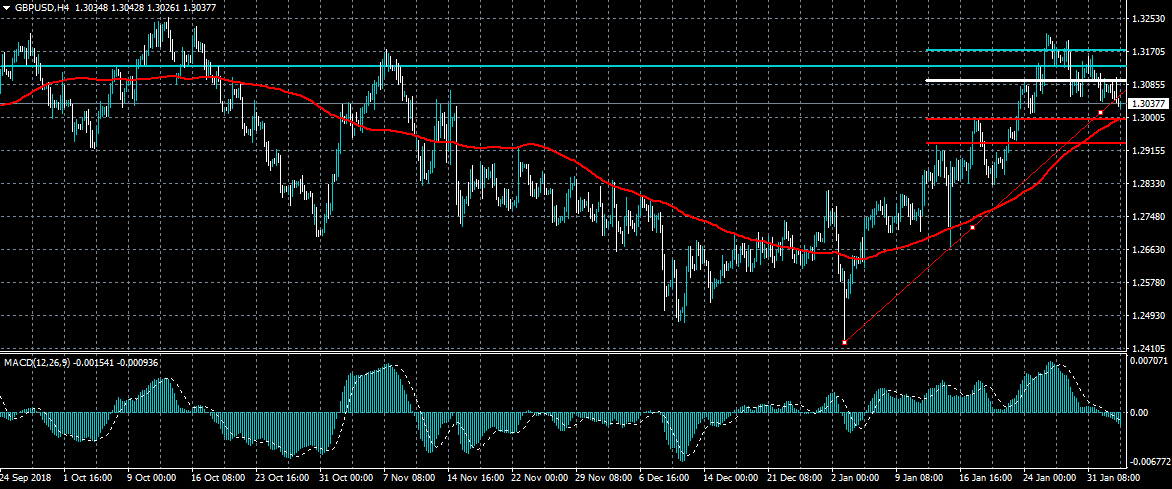
The British pound remains under selling pressure against the US dollar on Tuesday, with the pair now trading beneath key trendline support. Further intraday losses are now expected, with the psychological 1.3000 level the main technical support region to watch. The MACD indicator on the four-hour time frame has broken lower, signalling that bearish selling pressure is increasing.
The GBPUSD pair is bearish while trading below the 1.3055 level, key technical support is found at the 1.3000 and 1.2970 levels
If the GBPUSD pair trades above the 1.3055 level, key resistance is found at the 1.3095 and 1.3130 levels.
EURUSD Indicators Correcting Lower
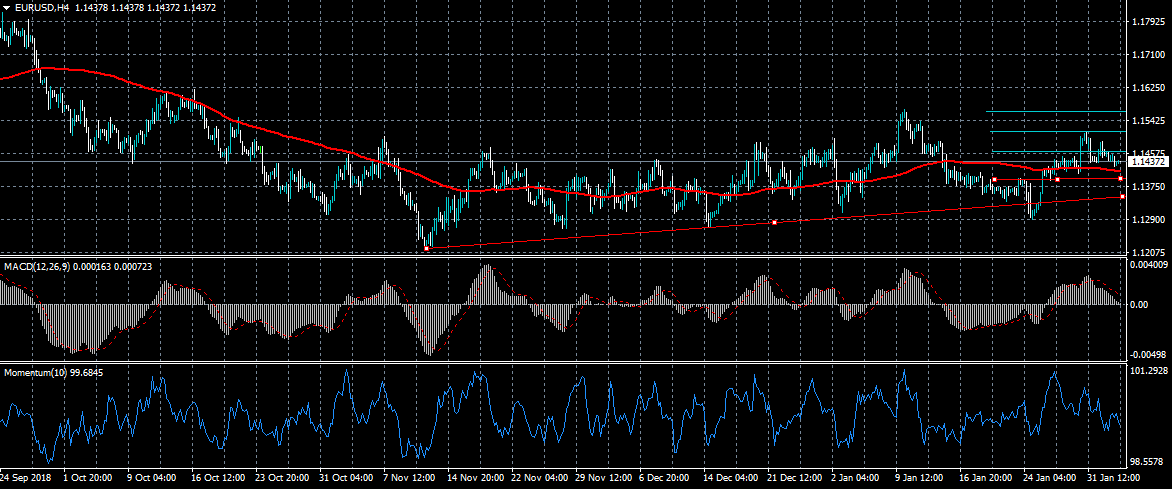
The euro is under moderate selling pressure against the US dollar on Tuesday after buyers failed to hold price above the important 1.1460 resistance level. The overall bullish bias in the EURUSD pair is likely to remain intact while price continues to trade above the 1.1410 level. Technical indicators appear to be correcting lower, which may delay the next wave of intraday buying interest.
The EURUSD pair is bullish while trading above the 1.1410 level, key technical resistance is found at the 1.1460 and 1.1500 levels.
If the EURUSD pair trades below the 1.1430 level, sellers may test towards the 1.1410 and 1.1390 support levels.
USD/CAD Daily Outlook
Daily Pivots: (S1) 1.3081; (P) 1.3115; (R1) 1.3145; More...
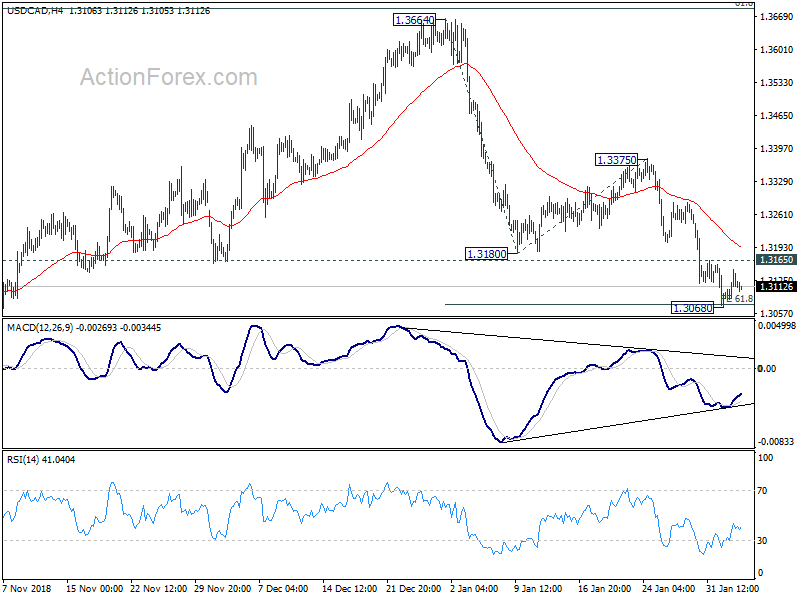
A temporary low is formed at 1.3068 and intraday bias in USD/CAD is turned neutral first. We'd stay cautious on bottoming as USD/CAD is close to channel support (now at 1.3056). On the upside break of 1.3165 will turn bias to the upside for rebounding towards 1.3375 resistance. However, sustained break of the channel support will pave the way to 100% projection of 1.3664 to 1.3180 from 1.3375 at 1.2891.
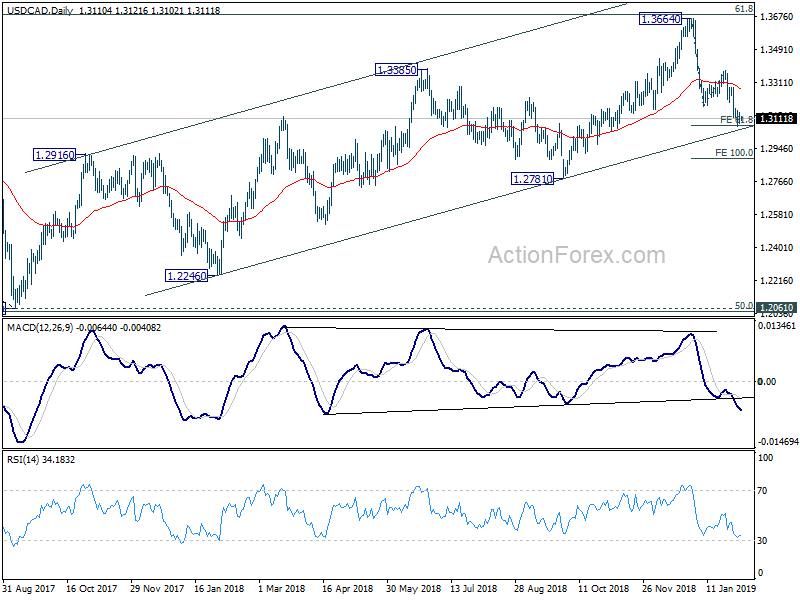
In the bigger picture, structure of the medium term rise from 1.2061 (2017 low) to 1.3664 is not clearly impulsive. Hence, we'd stay cautious on strong resistance from 61.8% retracement of 1.4689 (2016 high) to 1.2061 at 1.3685 and 1.3793 resistance to limit upside, and bring medium term topping. But in any case, medium term outlook will stay bullish as long as channel support (now at 1.3049) holds. Sustained break of 1.3793 will pave the way to retest 1.4689 (2015 high). Firm break of the channel support should confirm reversal target 1.2061 low again.
Uncertainty In Crypto Markets As Biggest Canadian Exchange Shuts
This month, the price of cryptocurrencies has remained relatively unchanged as investors ponder about the future. The biggest worry among the investing community is about the security of the digital assets. Last month, two reports revealed that cryptos worth billions of dollars were stolen in 2018. In January of the year, Coincheck, a large Japanese exchange lost more than $500 million to hackers.
The challenge now comes after the sudden death of Gerald Cotton. Gerald was the CEO and founder of an exchange called Quadriga CX, which was based in Canada. The exchange has cryptocurrencies worth more than $200 million. With his passing, it has become impossible for the staff and clients to access the currencies they hold because he was the only one with the passwords. His computers, mobile devices and email addresses were encrypted, which makes accessing the digital wallets impossible. Experts brought in to hack the system too have not been able to do so. In a statement, the firm’s directors said:
For the past weeks, we have worked extensively to address our liquidity issues, which include attempting to locate and secure our very significant cryptocurrency reserves held in cold wallets, and that are required to satisfy customer cryptocurrency balances on deposit, as well as sourcing a financial institution to accept the bank drafts that are to be transferred to us. Unfortunately, these efforts have not been successful.
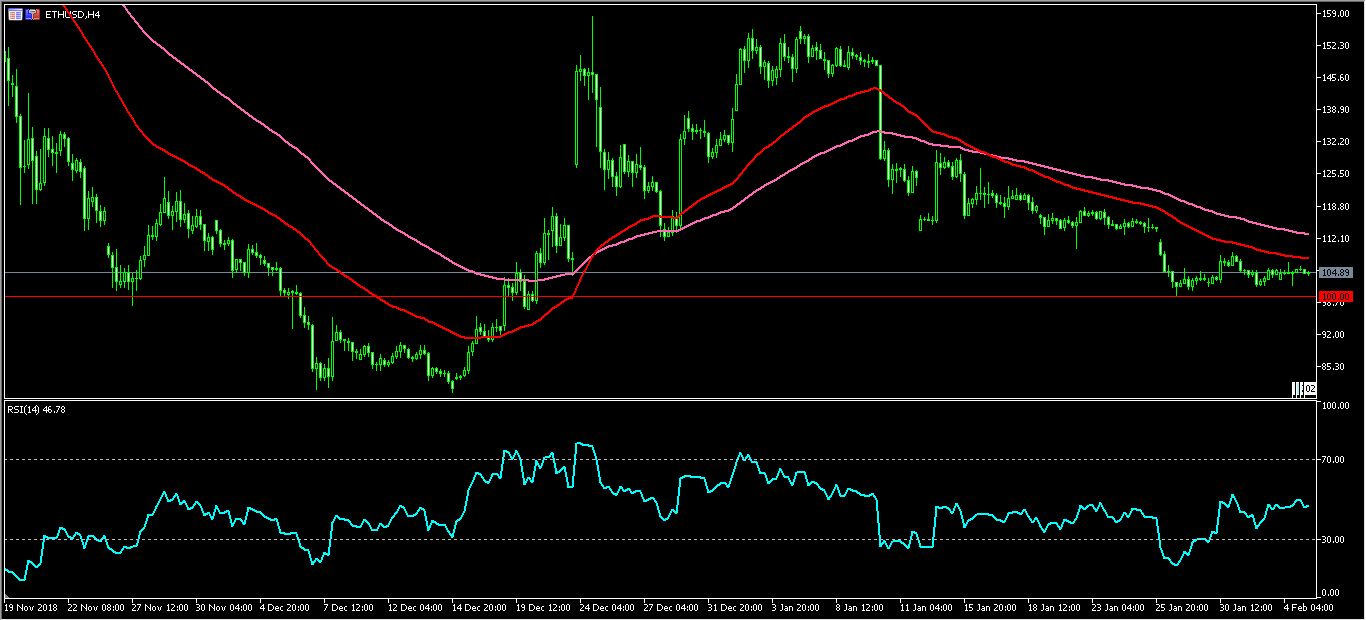
The price of Ethereum has remained unchanged at $105. This price is also lower than the YTD high of above $150. This price is below the 100-day and 50-day EMA while the RSI has remained unchanged at the 45 level. There is a likelihood that the ETH/USD pair will move lower to below the 100 level.
Aussie Jumps After Hawkish RBA Statement
The Japanese yen was little moved against the USD in the Asian session as the country’s service PMI numbers came out better than expected. The numbers from Nikkei-Markit showed that the services PMI were at 51.6 in January, up from 51.0 in December. This number presented a rare bright spot for the Japanese economy that is currently going through challenges as the core manufacturing sector slows. The country’s export sector is also slowing. In December, exports shrank at the quickest pace while growth in the manufacturing sector slowed.
The Asian market rose today as a reaction to the bullish momentum from the United States. Yesterday, US stocks continued the upward trend with the Dow, S&P, and Nasdaq gaining by 0.70%, 0.68%, and 1.15% respectively. The reason for the climb was the reaction to the strong jobs numbers on Friday and the relatively strong earnings season. Today, in Asia, the broader MSCI index that covers the region rose by 0.4% and neared the four-month high. However, there was no trading in most of the region as the markets closed for the Lunar New Year.
The Australian dollar rose sharply after a hawkish statement from the central bank, which left interest rates unchanged at 1.50%. In the statement, governor Philip Lowe said that the country’s economy was doing well with the unemployment rate expected to reduce to below 5%. Inflation rose by 1.8% in 2018 and is expected to pick up. The statement said:
The low level of interest rates is continuing to support the Australian economy. Further progress in reducing unemployment and having inflation return to target is expected, although this progress is likely to be gradual. Taking account of the available information, the Board judged that holding the stance of monetary policy unchanged at this meeting would be consistent with sustainable growth in the economy and achieving the inflation target over time.
EUR/USD
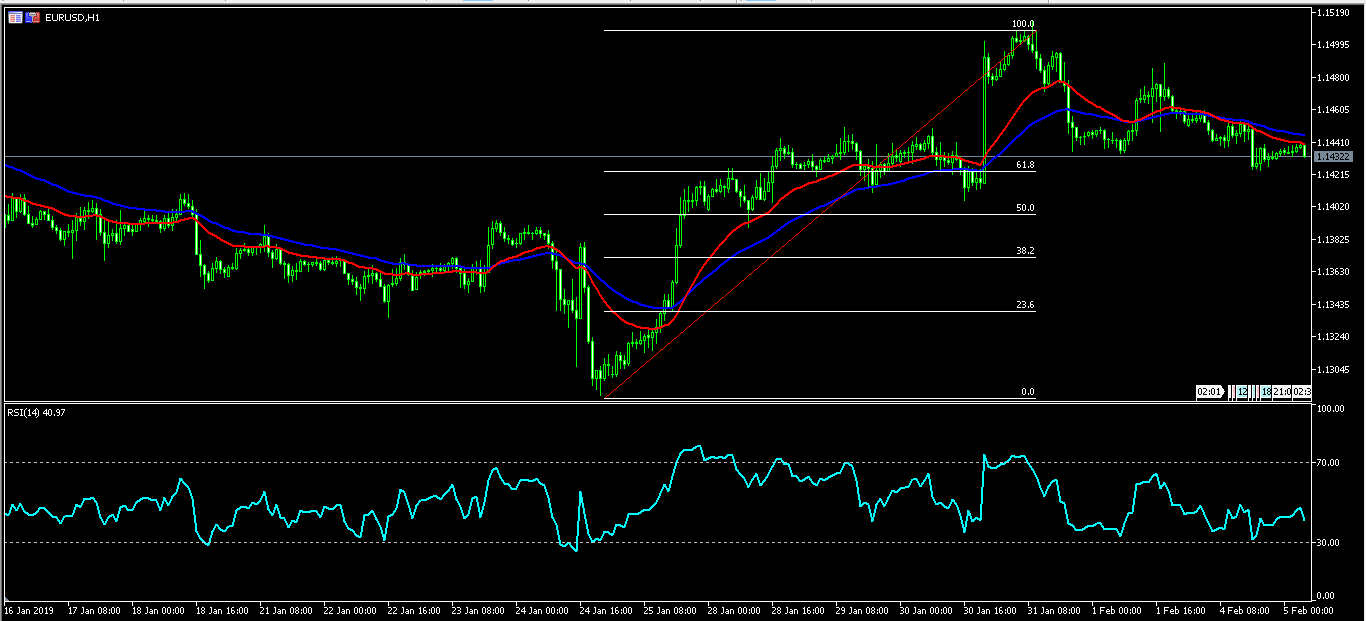
The EUR/USD pair was little moved in overnight trading as consolidation continued. The pair is now trading at 1.1435, which is lower than Friday’s high of 1.1515. The current price is below the 50 and 25-day EMAs while the RSI has remained in the 40s level. This price is also along the 61.8% Fibonacci Retracement level. In case the pair declines further, traders should focus on the 50% Fibonacci level of 1.1400.
AUD/USD
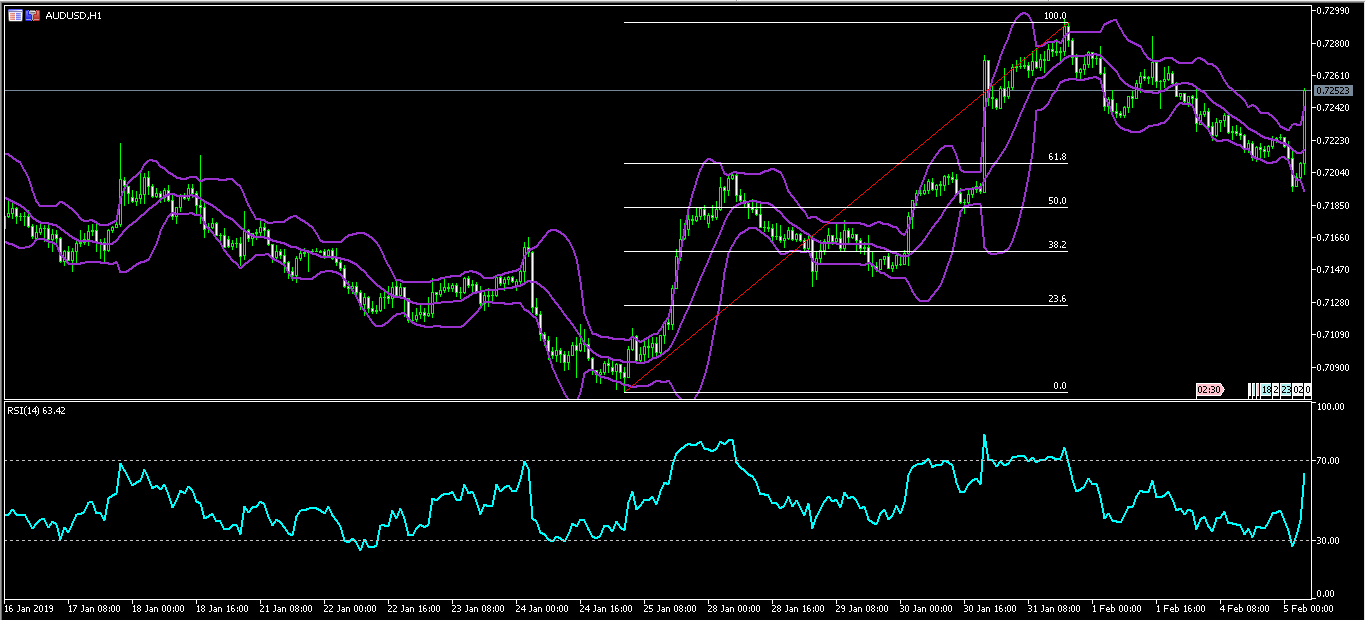
The AUD/USD pair jumped sharply after the RBA’s monetary policy decision. It reached a high of 0.7250, which was the highest level since Friday. This level is between the 61.8% and 100% Fibonacci Retracement levels. The level is also along the upper line of the Bollinger Band while the RSI too has jumped to almost the 70 level. While the pair could fall slightly, there is a possibility that the price will continue the upward trend.
XAU/USD
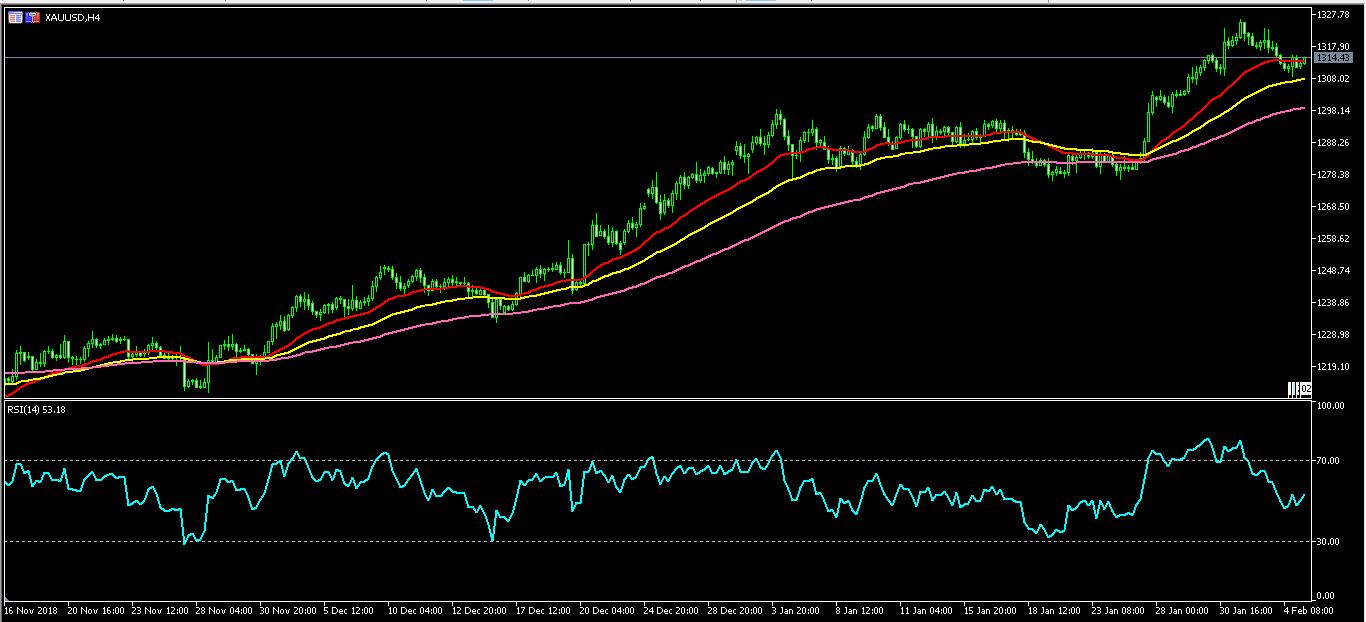
The price of gold has eased a bit as concerns about the pace of monetary policy mount. The XAU/USD pair is now trading at 1315, which is slightly lower than this year’s high of 1325. On the four-hour chart, the pair is above the 50-day EMA. It is also above the 100-day EMA, while the RSI has halted the previous declines. There is a possibility that the pair will continue the upward trend and test the important resistance level of 1350.
Elliott Wave View Suggest Another Push Higher In Facebook
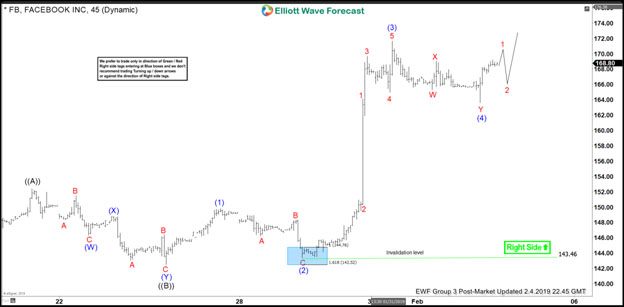
Elliott wave view in Facebook (ticker symbol: $FB) suggests that the rally from December 24.2018 low ($122.55) is unfolding as Elliott wave zigzag structure. The first leg of a zigzag structure ended in wave ((A)) at $152.43 high. Down from there, wave ((B)) pullback unfolded as double three structure where wave (W) ended at $146.37 low. Wave (X) bounce ended at $148.80 high and wave (Y) of ((B)) ended at $142.52 low. A zigzag structure is a 5-3-5 structure where wave ((A)) & ((C)) can unfold as an impulse or a diagonal structures.
In Facebook case, the wave ((C)) is taking a form of an impulse structure where wave (1) ended at $149.83. Wave (2) pullback ended at $143.46 low in lesser degree zigzag structure. Wave (3) ended at $171.68 high in lesser degree 5 waves structure. And wave (4) pullback unfolded as double three structure where wave W ended at $165.35 low. Wave X bounce ended at $169.10 high and wave Y of (4) ended at $163.62 low.
While above there, the stock is expected to resume the upside 1 more time in wave (5) towards $172.61-$191.13 100%-161.8% Fibonacci extension area of ((A))-((B)) before it ends the zigzag structure & turns lower again or pull back in 3 swings at least. A break above $171.68 high still needed to confirm the next leg higher until than a double correction lower in wave (4) can’t be ruled out. Near-term, while above $143.46 low, expect Facebook to extend higher.
Facebook 1 Hour Elliott Wave Chart