Sample Category Title
GBPUSD Bulls Back In Charge
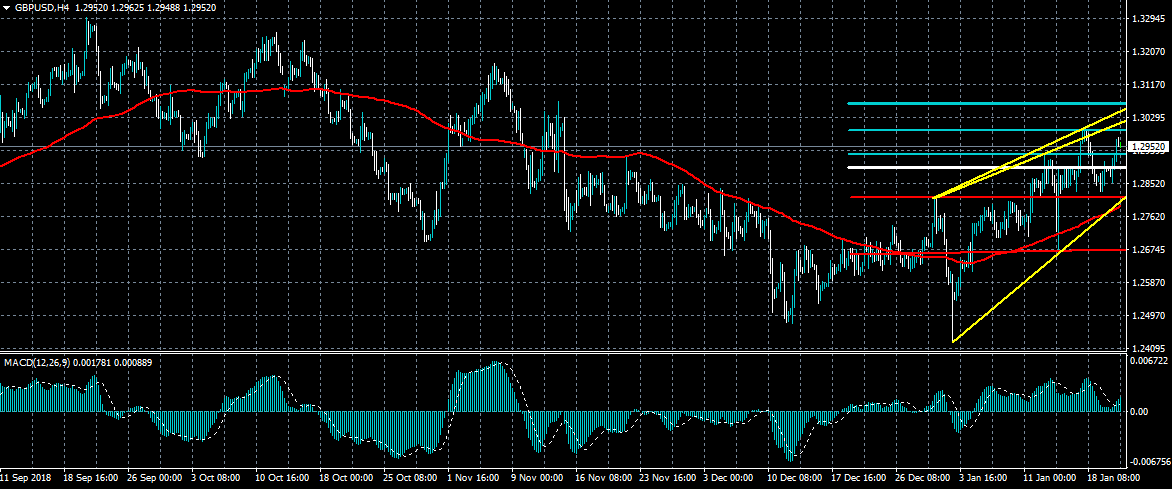
The British pound is trading back above the key 1.2930 level against the US dollar on Wednesday, with bulls once again taking control of the pair. Price is creating bullish higher lows, while the MACD indicator on the four-hour time frame is now consistent with price. An eventual test of the rising wedge pattern upper trendline may occur if GBPUSD bulls can break the 1.3000 level.
The GBPUSD pair is intraday bullish while trading above the 1.2890 level, key technical resistance is found at the 1.3000 and 1.3030 levels.
If the GBPUSD pair falls under the 1.2890 level, key support is found at the 1.2850 and 1.2810 levels.
LTCUSD Triple Bottom In Focus
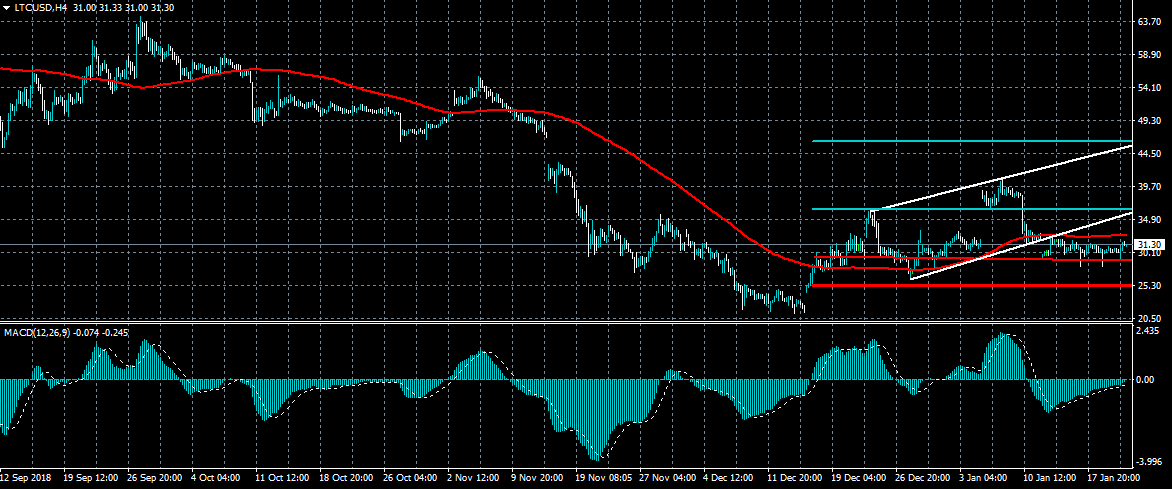
The LTCUSD pair is attempting to recover bullish momentum above the $30.00 level on Wednesday after the early week decline found strong support from the $28.00 level. The LTCUSD pair has potentially formed a bullish triple-bottom pattern after sellers failed to breach the December trading low. The $32.00 and $35.00 levels offer the strongest forms of resistance on an intraday basis.
The LTCUSD pair is only bullish while trading above the $32.00 level, key resistance is found at the $35.00 and $36.00 levels.
If the LTCUSD pair moves below the $30.00, sellers may test the $28.00 and $27.10 support levels.
EUR/GBP Daily Outlook
Daily Pivots: (S1) 0.8742; (P) 0.8786; (R1) 0.8812; More...
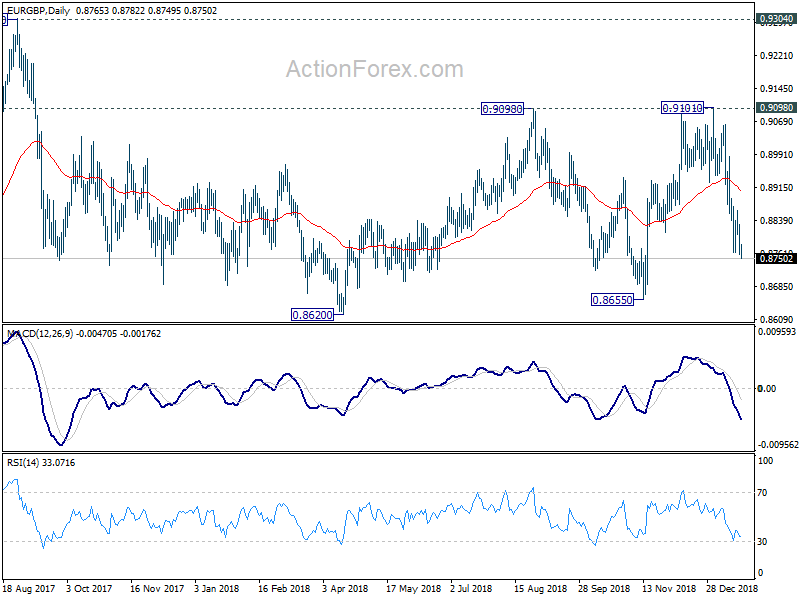
EUR/GBP's fall resumed by breaking 0.8763 and reaches as low as 0.8749 so far. Intraday bias is back on the downside. Current fall form 0.9101 should target 0.8620/55 support zone. We'd expect strong support from there to bring near term reversal. On the upside, break of 0.8862 resistance is needed to indicate short term bottoming. Otherwise, further fall is still expected in case of recovery.
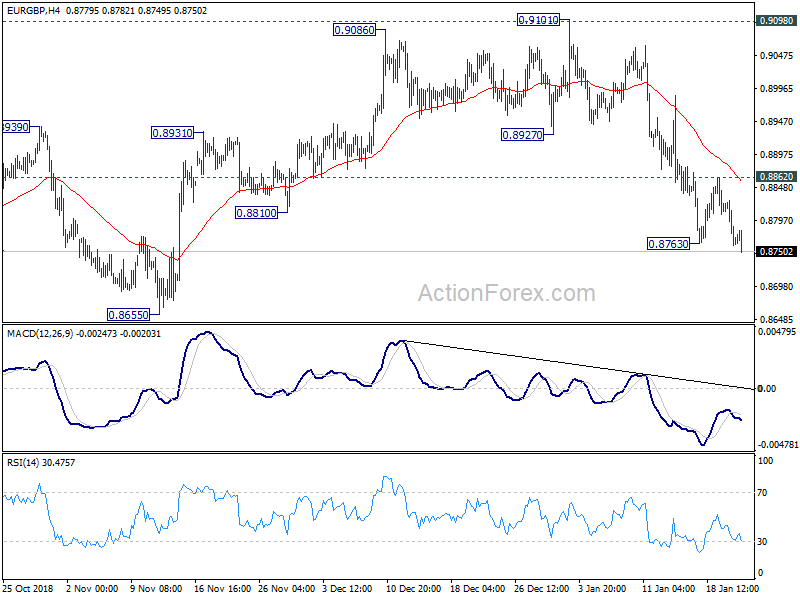
In the bigger picture, EUR/GBP is seen as staying in long term range pattern started at 0.9304 (2016 high). The medium term range is set between 0.8620 and 0.9101. Downside break out of 0.8620 will pave the way back to 0.8302/12 support zone. Break of 0.9101 will bring retest of 0.9304/5 resistance.
Crytocurrencies Rise Slightly As World Economic Forum Starts
The price of cryptocurrencies rose slightly in overnight trading. In total, the combined market cap of all currencies rose to $120.5 billion from $119.7 billion yesterday. The small upward momentum came as the World Economic Forum (WEF) started. Traders expect some positive headlines from the gathering in Davos, Switzerland. In last year’s meeting, the price of cryptocurrencies moved up slightly after a number of participants talked positively about them.
However, the industry continues to face a major security challenge. Last year, it was reported that cryptocurrencies worth more than $800 billion were stolen. Yesterday, two executives from Komid, a South Korean exchange, were sentenced for faking trading volume. They were also sentenced for deceiving investors with the goal of inflating the price of currencies. In security news, Coinzest, another South Korean exchange announced that it was investigating the loss of $5.3 million worth of cryptocurrencies.
When Bitcoin was founded, one of the goals was to have a secure digital currency. Ten years later, cryptocurrencies worth trillions of dollars have been stolen, which has made many people and businesses avoid the industry.
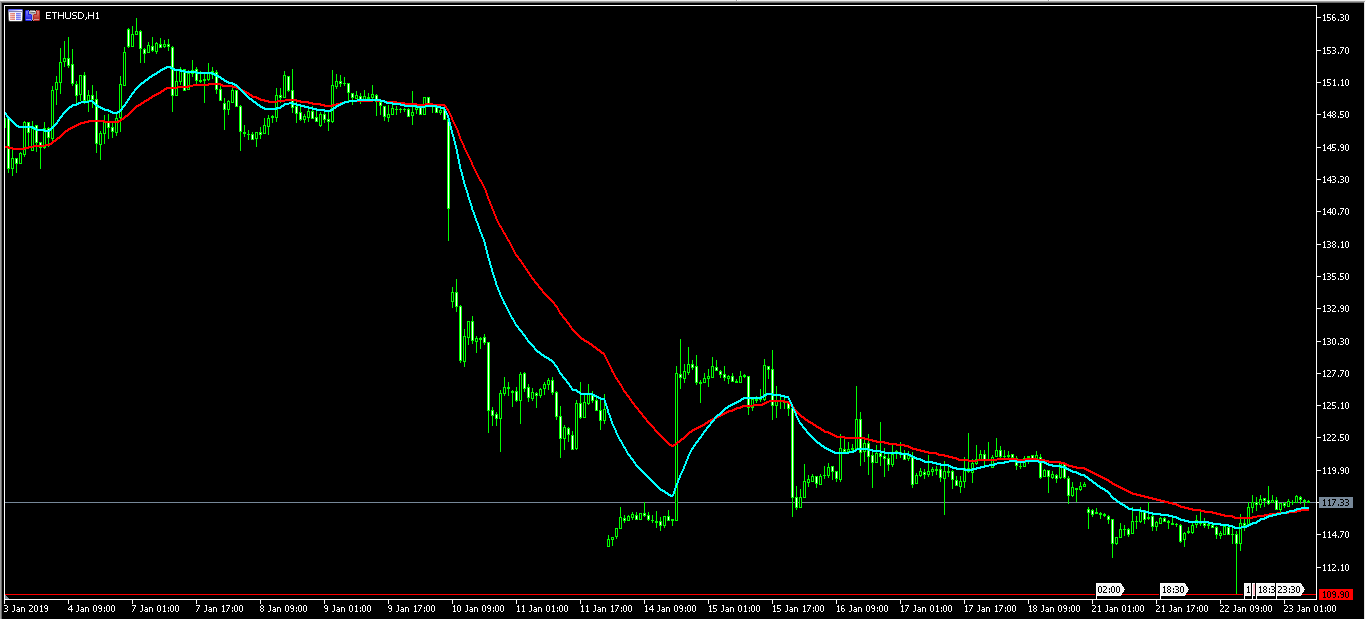
The price of ETH rose to a high of 117.38, which is slightly higher than the YTD low of 109.9. In the past few days, the pair has been moving sideways in a consolidation manner. This is an indication that major movements could happen soon. If they do, the price will likely drop to below $100 or move up to $150.
Yen Declines As BoJ Lowers Inflation Forecast
Japanese yen declined after the Bank of Japan (BOJ) released its interest rates decision. As expected, the bank left interest rates unchanged and lowered the inflation target. This means that the bank will have a challenge moving from negative interest rates at a time when the global growth is expected to slump.
On Monday, the IMF released a report that lowered the global economic forecast. This was the second downgrade in less than three months. In addition, data from Japan showed some weakness. In December, the exports declined by minus 3.8%, which was worse than the expected decline of 1.9%. Imports rose by 1.9%, which was lower than the expected 3.7% gain while the deficit increased to 55 billion yen.
The New Zealand dollar jumped in overnight trading after positive inflation data from the country. In the fourth quarter, the CPI rose by 1.9%, which was a point better than the consensus estimate of 1.8%. On a QoQ basis, the CPI rose by 0.1%. The improving inflation rate in New Zealand increases the chance that the RBNZ will move to hike rates this year. In past meetings, the bank has guided for a rate hike in 2020.
The Asian markets were mixed today after the slump on Wall Street yesterday. In the United States, the Dow and the S&P lost 300 and 40 points respectively as investors continued to worry about global growth. This came after sharp declines in Europe where the DAX and FTSE lost 50 and 70 points respectively. In Asia, the China A50 and Japan’s Nikkei rose by 25 and 10 points respectively. Looking ahead, the markets could see some boost today because of positive earnings from the US. This is after IBM released positive results.
EUR/USD
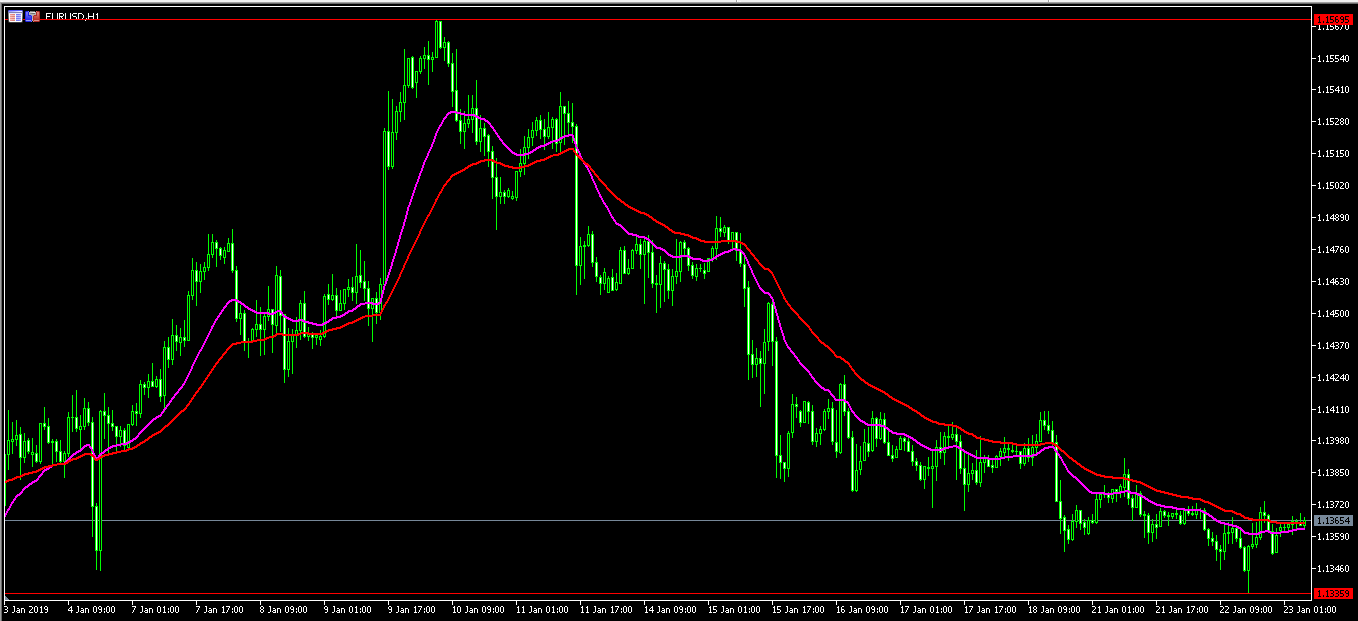
The EUR/USD pair was little moved in overnight trading. It is now trading at 1.1365, which is slightly higher than yesterday’s low of 1.1335. In the past ten days, the pair has dropped sharply from a high of 1.1570. On the hourly chart below, the price is along the short and medium-term EMAs, which is a sign of consolidation. Today, the pair will likely remain within this range as traders wait for the ECB interest rates decision tomorrow.
USD/JPY
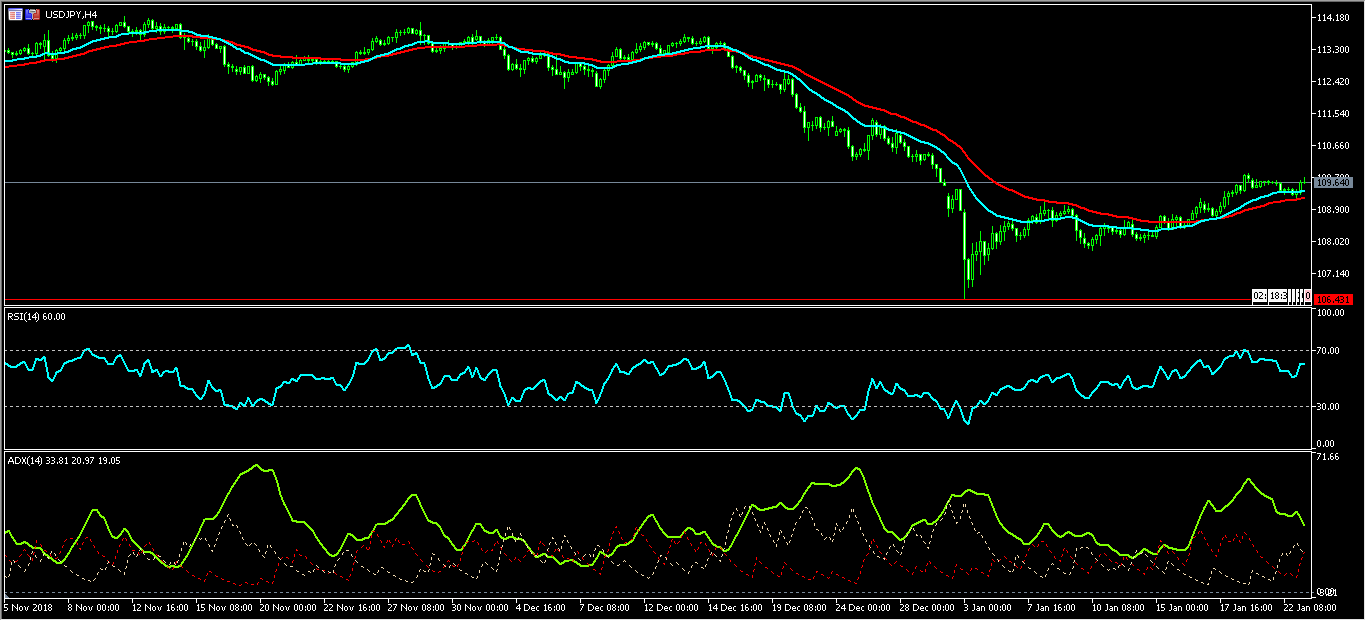
After a few days of declines, the USD/JPY pair rose today after the statement from the Bank of Japan. The pair is now trading at 109.66, which is along the previous weekly high. On the hourly chart, the price of the pair is slightly above the short and medium-term EMAs while the RSI has gone up close to the overbought level of 70. The Average Directional Movement Index has fallen from 58 to the current 38, which is an indication that the current rally is fading. The pair will likely remain along these levels or move up slightly to test the important resistance level of 110.
NZD/USD
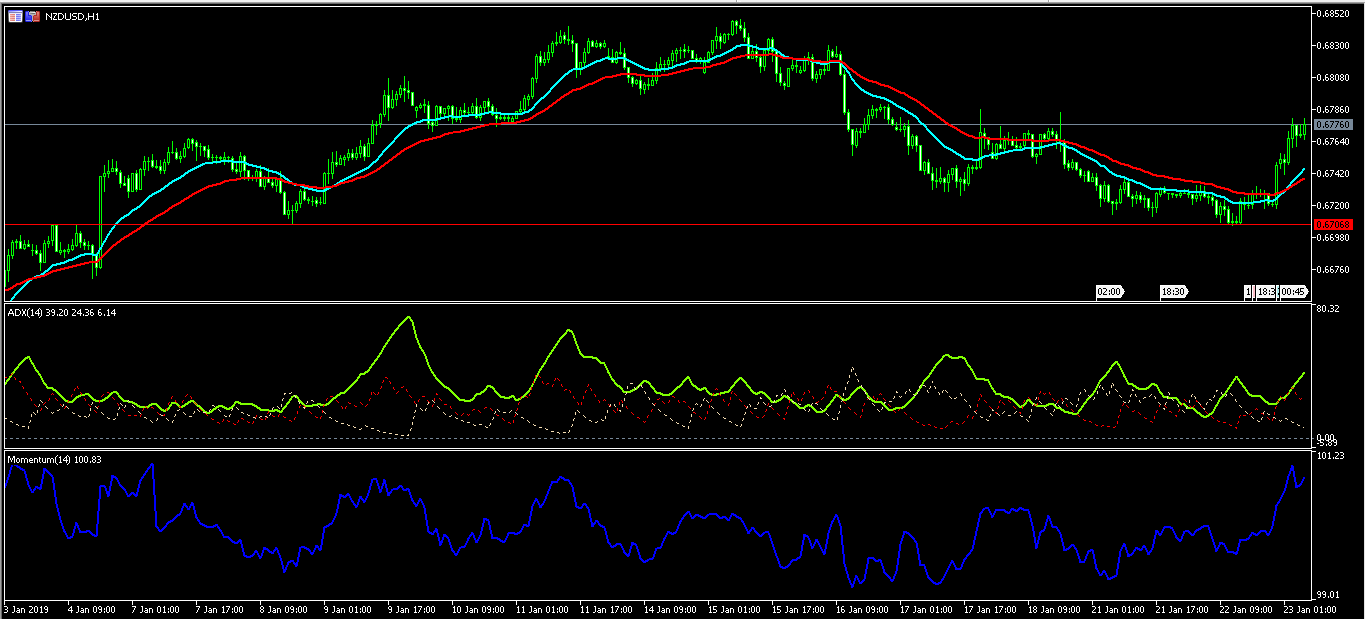
The NZD/USD pair rose today after positive inflation numbers. The pair reached a high of 0.67800, which is the highest level since Monday this week. It is also a major resistance level. The price is above the short and medium-term EMAs while the signal in the ADX indicator is rising. The momentum indicator too has risen to multi-week highs. There is a possibility that the rally on the pair will continue until it tests the 0.6800 level.
EUR/AUD Daily Outlook
Daily Pivots: (S1) 1.5884; (P) 1.5925; (R1) 1.5993; More....
EUR/AUD is staying in consolidation above 1.5774 temporary low and intraday bias remains neutral. With 1.6154 resistance intact, further decline is still expected in the cross. On the downside, break of 1.5774 will resume the fall from 1.6765 and target 1.5346 key support. However, break of 1.6154 will turn intraday bias back to the upside for retesting 1.6765 instead.
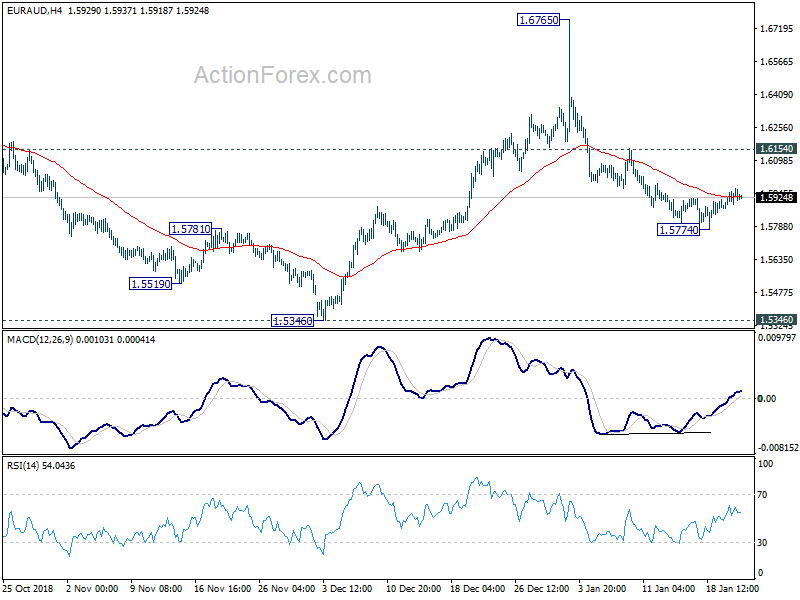
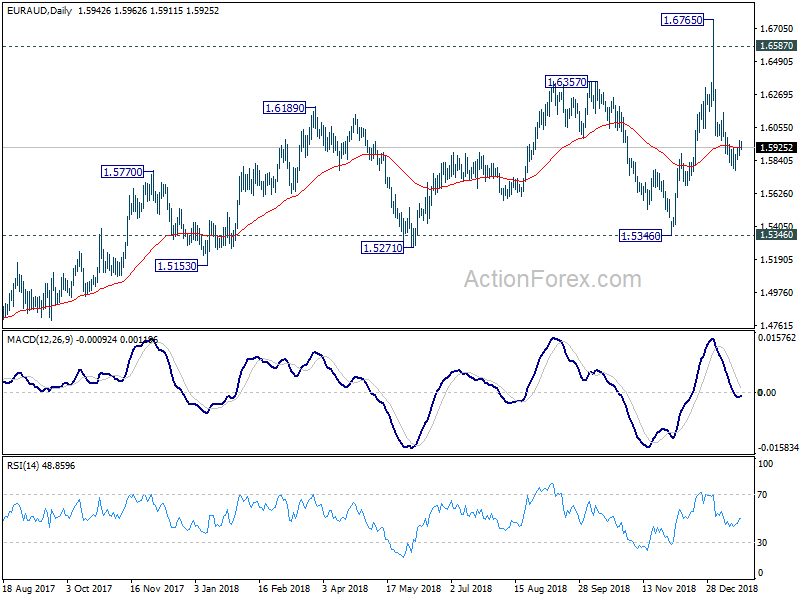
In the bigger picture, the failure to sustain above 1.6587 key resistance (2015 high) argues that up trend from 1.1602 (2012 low) is not ready to resume yet. But still, as long as 1.5346 support holds, outlook will remain bullish. Break of 1.6765 will target 61.8% retracement of 2.1127 (2008 high) to 1.1602 at 1.7488 next. However, firm break of 1.5346 key support will indicate trend reversal, with bearish divergence condition in weekly MACD, and turn outlook bearish.
EUR/CHF Daily Outlook
Daily Pivots: (S1) 1.1316; (P) 1.1330; (R1) 1.1343; More...
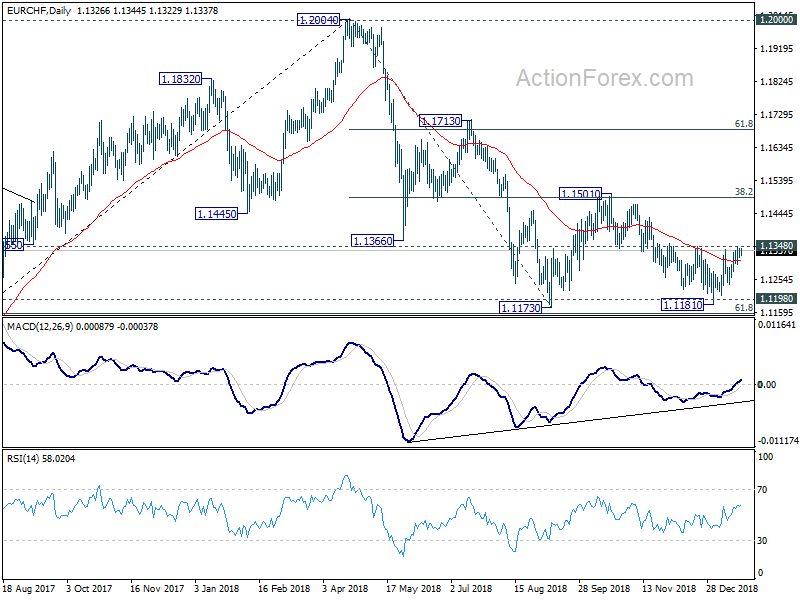
Intraday bias in EUR/CHF remains neutral with focus on 1.1348 resistance. Outlook is unchanged as we're slightly favoring the case the choppy decline from 1.1501 has completed at 1.1181 already. On the upside, break of 1.1348 will confirm this bullish case and turn bias to the upside for retesting 1.1501 next. On the downside, in case of another fall, we'd expect strong support from 1.1154/98 support zone to contain downside to bring rebound.
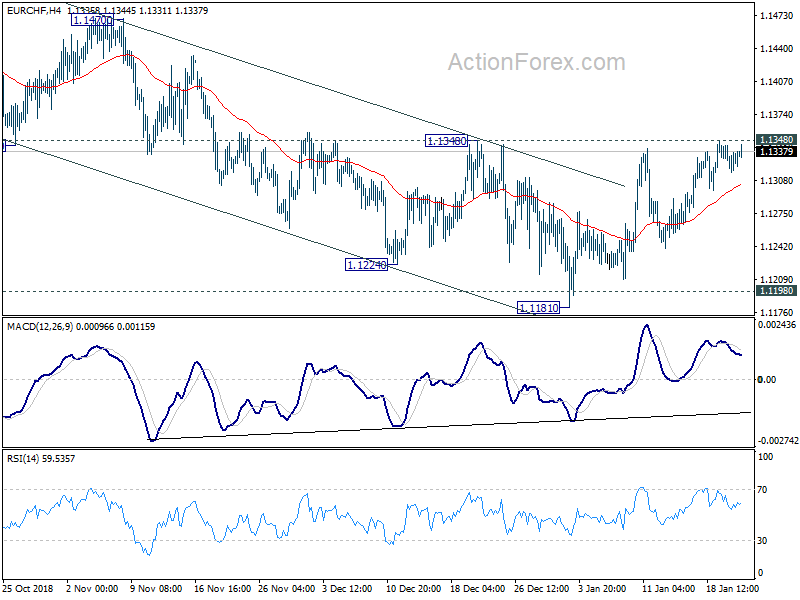
In the bigger picture, price actions from 1.2004 medium term top is seen as a correction only. Downside should be contained by support zone of 1.1198 (2016 high) and 61.8% retracement of 1.0629 to 1.2004 at 1.1154 to complete it and bring rebound. A break of 1.2 key resistance is still expected in the medium term long term. However, sustained break of the mentioned support zone will mark reversal of the long term trend. In that case, 1.0629 key support will be back into focus.
USD/CAD Daily Outlook
Daily Pivots: (S1) 1.3313; (P) 1.3336; (R1) 1.3380; More...
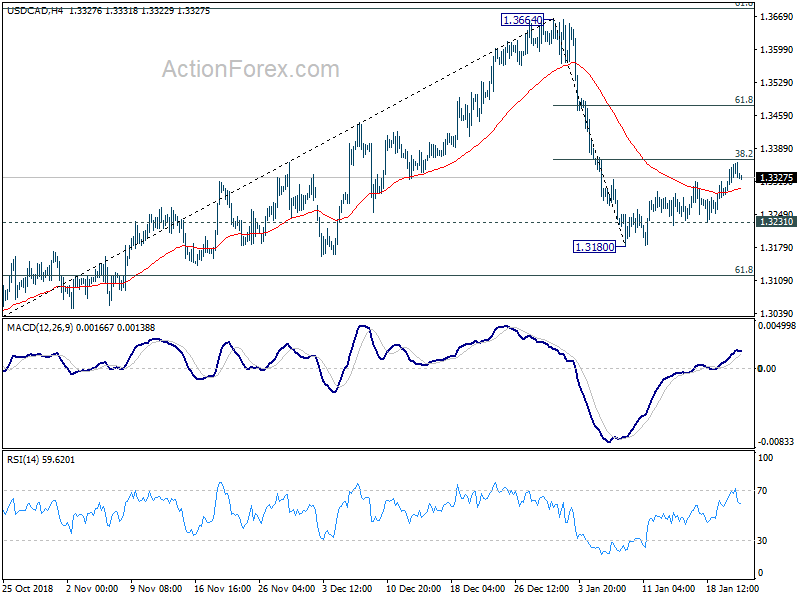
Intraday bias in USD/CAD remains mildly on the upside. Rebound from 1.3180 short term bottom is still in progress. Break of 38.2% retracement of 1.3664 to 1.3180 at 1.3365 will target 61.8% retracement at 1.3479. We'd look for strong resistance from 1.3479 to limit upside. On the downside, break of 1.3231 will likely resume fall from 1.3664 to 61.8% retracement of 1.2781 to 1.3664 at 1.3118.
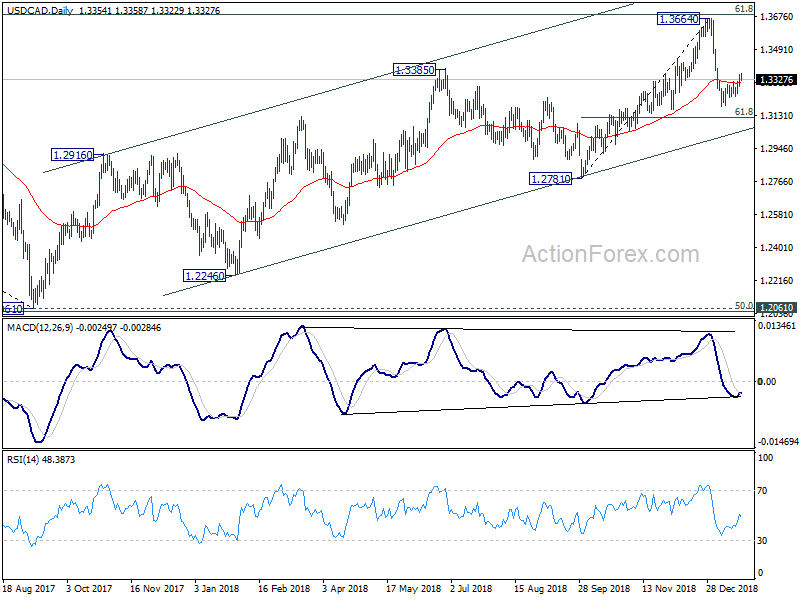
In the bigger picture, the medium term rise from 1.2061 (2017 low) might continue further. But the structure of such rise is not clearly impulsive so far. Hence, we'd stay cautious on strong resistance from 61.8% retracement of 1.4689 (2016 high) to 1.2061 at 1.3685 and 1.3793 resistance to limit upside, and bring medium term topping. But in any case, medium term outlook will stay bullish as long as channel support (now at 1.3036) holds. Sustained break of 1.3793 will pave the way to retest 1.4689 (2015 high).
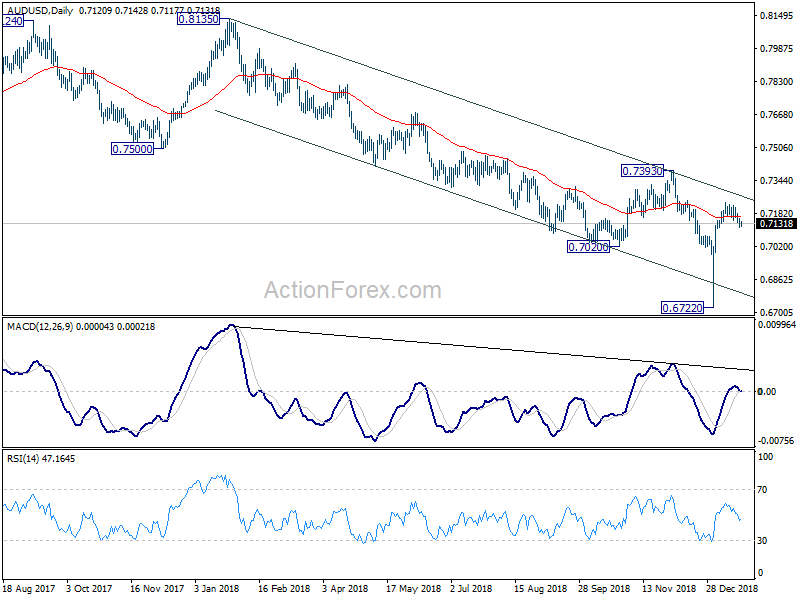
AUD/USD Daily Outlook
Daily Pivots: (S1) 0.7103; (P) 0.7132; (R1) 0.7149; More...
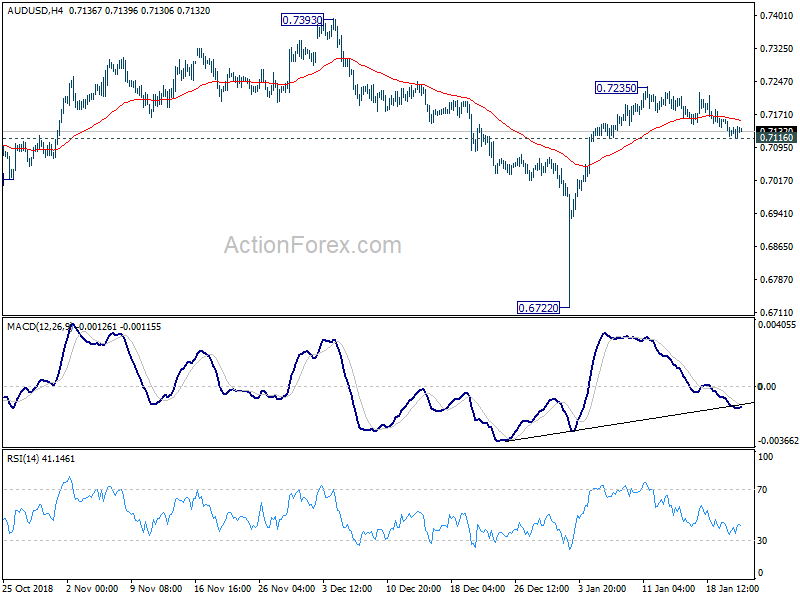
Intraday bias in AUD/USD remains neutral with focus on 0.7116 minor support. Break there will suggest completion of rebound from 0.6722. Intraday bias will then be turned back to the downside for retesting this low. On the upside, above 0.7235 will extend the rebound towards 0.7393 resistance. We'd expect strong resistance from there to limit upside.
In the bigger picture, the failure to sustain below 0.6826 (2016 low) suggests that the long term down trend is not ready to resume yet. But prior rejection by 55 week EMA indicates underlying medium term bearishness in the pair. Outlook will also stay bearish as long as 0.7393 resistance holds. On the downside, sustained break of 0.6826 will target 0.6008 (2008 low).
USD/JPY Daily Outlook
Daily Pivots: (S1) 109.10; (P) 109.40; (R1) 109.65; More...
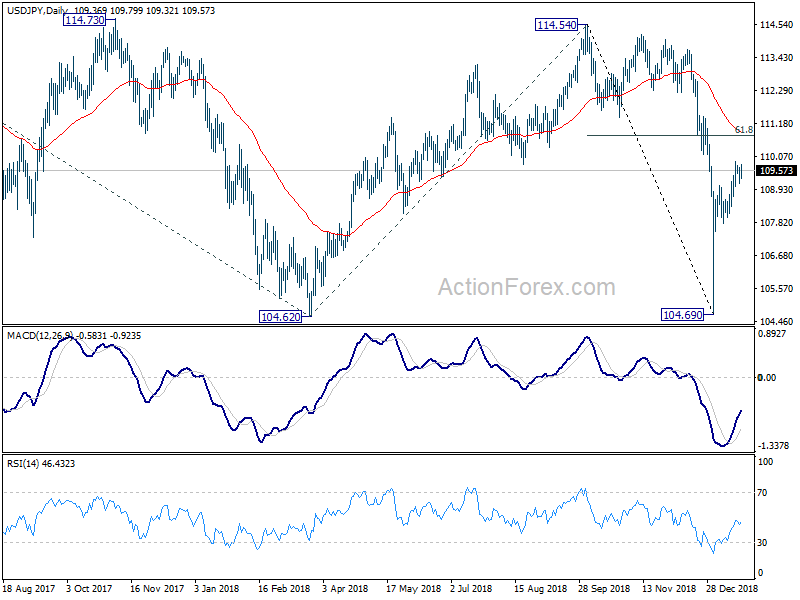
USD/JPY's consolidation from 109.89 is still in progress and intraday bias remains neutral. Another rise could be seen with 107.77 minor support intact. On the upside, above 109.89 will target 61.8% retracement of 114.54 to 104.69 at 110.77. We'd look for topping signal above there. On the downside, break of 107.77 will indicate completion of the rebound from 104.69. Intraday bias will be turned back to the downside for retesting this low.
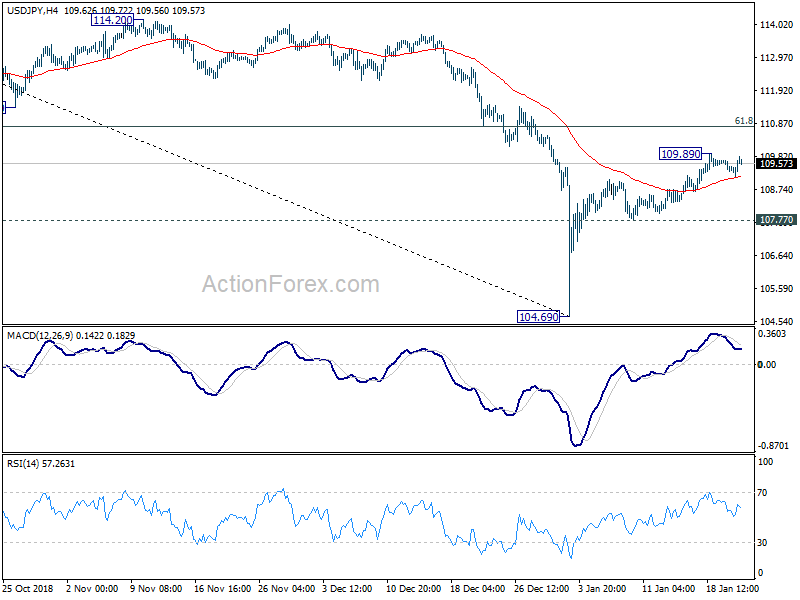
In the bigger picture, price actions from 125.85 (2015 high) are seen as a long term corrective pattern, no change in this view. Apparently, such corrective pattern is not completed yet. Fall from 114.54 is seen as part of the falling leg from 118.65 (2016 high). Break of 104.62 will target 100% projection of 118.65 to 104.62 from 114.54 at 100.51, which is close to 100 psychological level. But in that case, we'd expect strong support from 98.97 to contain downside to bring reversal. Also, this bearish case will remain the preferred one as long as 114.54 resistance holds.