

Sample Category Title
New Zealand: CPI Rose 0.1% In Dec Quarter, Annual Inflation 1.9%
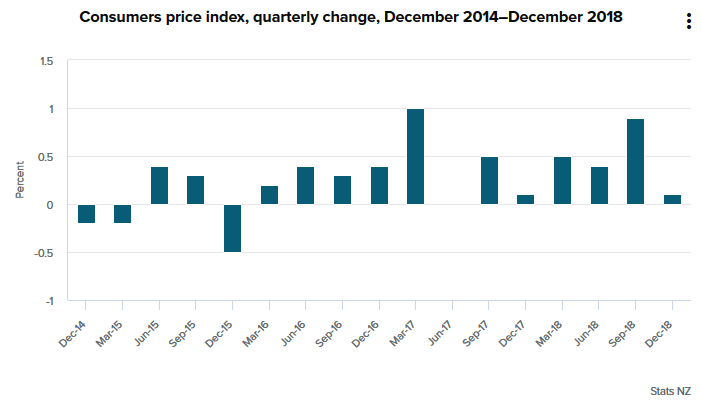
- The Consumer Price Index (CPI) rose by 0.1% in the December quarter, maintaining the annual inflation rate at 1.9%.
- A sharp fall in fuel prices has taken some of the pressure off headline inflation in the near term.
- However, locally-generated inflation pressures have been stronger than the Reserve Bank forecast.
- We expect a gradual pick-up in inflation over the next few years, though it will be some time before the RBNZ needs to respond with higher interest rates.
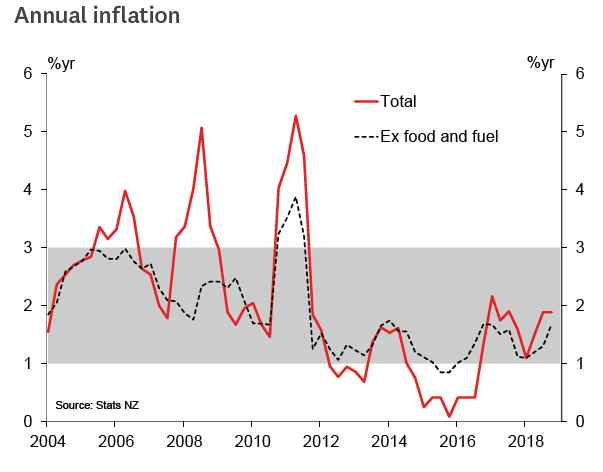
Today's CPI release provided more evidence that the era of uncomfortably low inflation has passed. Annual inflation is now tracking close to the 2% midpoint of the Reserve Bank's target range, and domestically-driven inflation pressures have tended to be stronger than the RBNZ's forecasts in recent quarters. That said, inflation has yet to test the upper end of the RBNZ's target range, meaning that the need for interest rate hikes is still some time away.
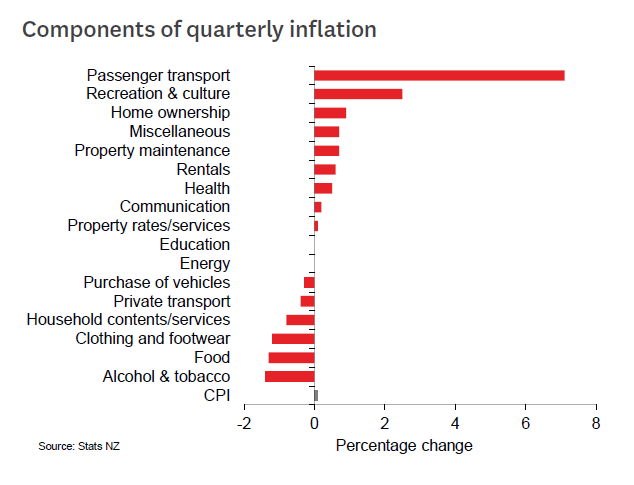
Consumer prices rose 0.1% in the December quarter, which was in line with our forecast. The December quarter result is typically on the low side, reflecting the balance of seasonal factors – in particular, a 21% drop in vegetable prices from their winter peaks. This group alone outweighed the gains in airfares, car rentals and accommodation during the peak tourism period. In seasonally adjusted terms, the CPI rose by 0.4% in the December quarter, a similar pace to previous quarters.
While the headline result was a bit below the 0.2% that the RBNZ estimated in its November Monetary Policy Statement, that hides some important detail. Petrol prices fell sharply over the course of the December quarter, with much of the decline occurring after the RBNZ had prepared its forecast. As a result, the 0.4% decline in tradables prices was softer than the RBNZ's forecast of -0.1%.
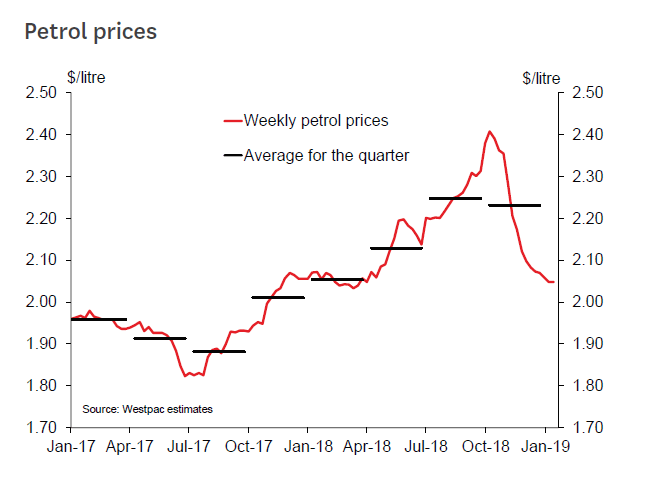
Petrol wasn't actually much of a feature in today's release – the average over the December quarter was only slightly lower than in the September quarter. However, it will have a substantial dampening effect on the March quarter outturn, with petrol prices starting the year about 8% below the December quarter average. Consequently, headline inflation is likely to dip lower again in the next couple of quarters, but the RBNZ is able to look through this shortterm effect.
Setting aside fuel prices, tradables inflation has remained subdued. However, there were signs of a mild pick-up in the latest quarter, reflecting the lower New Zealand dollar over the last year. The exchange rate tends to have a lagged impact on the prices of imported goods, so we expect to see a further modest lift in tradables inflation this year. In contrast to tradables, prices for non-tradable goods and services outstripped the RBNZ's forecast (and in fact have done so for the last six quarters). The 0.7% gain for the quarter lifted the annual rate of increase to 2.7%, which was the highest since June 2014.
We expect non-tradables inflation to accelerate further over the coming years. The tightening labour market, along with some government-mandated pay increases, are expected to lead to an acceleration in wage costs. Firms are reporting greater cost pressures, and will be looking to pass this on to consumers over time.
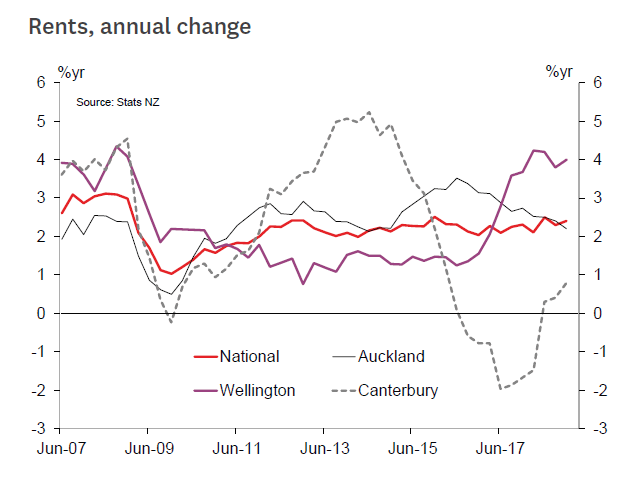
Even so, we think that the rise in non-tradables inflation will be gradual – the reason being that some of the most significant components aren't linked to labour costs at all. Rents make up nearly 10% of the CPI, and they yet to show any acceleration in recent years at a national level. Within that, there are some regional variations – growth in rents is actually slowing in Auckland, even as it picks up in other parts of the country.
It's worth noting that from the June 2019 quarter Stats NZ will be introducing a new method of measuring rental prices in the CPI. The new method tends to produce a faster pace of rental price growth over history compared to the existing method, though the change is unlikely to have a meaningful impact on the future pace of inflation as a whole. Also on the housing front, price increases for newly-built homes have actually slowed from their peaks over the last couple of years, in line with the slowdown in house sale prices. With a range of Government policies aimed at dampening speculative demand in the housing market, we expect prices for both existing and new homes to remain subdued over the next few years.
NZD jumps on solid CPI, AUD/NZD complete post flash crash rebound
New Zealand Dollar is lifted notable today but better than expected consumer inflation data. CPI rose 0.1% qoq in Q4 versus expectation of 0.0% qoq. On annual basis, CPI was unchanged at 1.9% yoy, above expectation of 1.8% yoy. The data eased worries that inflation outlook is worsening and chance for a rate cut by RBNZ is reduced. Majority of economists are still expecting the next move to be a hike. But for now, there is no time frame for that move yet.
Meanwhile, the outlook is still clouded by fading momentum in the economy, as show in recent forward-looking indicators. There is question on whether domestic inflation could sustain. And should data ahead disappoint, there bets on rate cut will re-emerge.
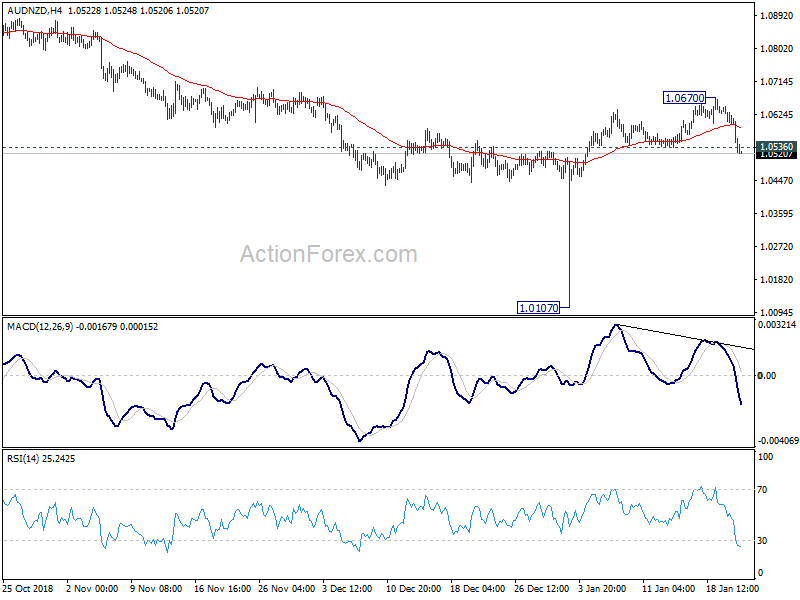
AUD/NZD's fall from 1.0670 accelerates today. Break of 1.0536 minor support now suggests that the rebound from 1.0107 flash crash low has completed at 1.0670 already. Further decline is now in favor back to retest 1.0107.
BoJ stands pat, sharp downward revision in fiscal 2019 inflation forecast
BoJ left monetary policies unchanged today as widely expected. New economic projections are also released with upgrade in fiscal 2019 and 2020 GDP forecasts. But inflation forecasts was lowered rather sharply for fiscal 2019.
The short term interest rate is held unchanged at -0.1%. And under the yield curve control frame work, BoJ will continue to kept 10-year JGB yield at around 0%, with some upward and downward movements allowed. The annual amount of JGB purchase will be kept at JPY 80T.
Member G. Katakoa dissented as usual, pushing to strengthen monetary easing. Y Harada also dissented again, criticizing that allowing the long-term yields to move upward and downward to some extent was too ambiguous
On economy, BoJ maintained that "Japan's economy is likely to continue on an expanding trend through fiscal 2020." Also, "overseas economies are expected to continue growing firmly on the whole, although various developments of late warrant attention such as the trade friction between the United States and China."
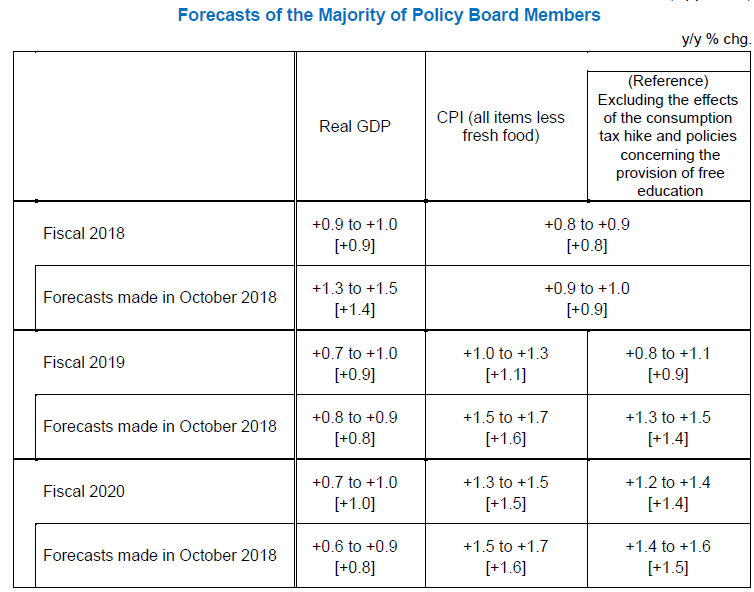
In the new GDP projections, comparing with October forecasts:
- Fiscal 2018 is revised to 0.9% to 1.0% (median 0.9%), down from 1.3% to 1.5% (median 1.4%).
- Fiscal 2019 is revised to 0.7% to 1.0% (median 0.9%), up from 0.8% to 0.9% (median 0.8%).
- Fiscal 2020 is revised to 0.7% to 1.0% (median 1.0%), up from 0.6% to 0.9% (median 0.8%).
The revisions showed that while BoJ is optimistic for 2019, it also sees larger uncertainties.
In new core CPI projections, comparing with October forecasts, and exclude effect of sales tax hike:
- Fiscal 2018 is revised to 0.8% to 0.9% (median 0.8%), down from 0.9% to 1.0% (median 0.9%).
- Fiscal 2019 is revised to 0.8% to 1.1% (median 0.9%), down sharply from 1.3 to 1.5% (median 1.4%).
- Fiscal 2020 is revised to 1.2% to 1.4% (median 1.4%) down from 1.4% to 1.6% (median 1.5%).
The downside revision in fiscal 2019 core CPI is rather steep.
US Senate to hold competing votes to end government shutdown
The US Senate will hold two competing votes on Thursday as effort to end the record government shut down. Trump's plan, which includes USD 5.7B for border wall will be voted on. Also, Democrat's proposal, to reopen government through February 8, will also be voted on. It's seen as a concession by Senate Majority Leader Mitch McConnell who previously refused to vote on a bill that Trump would veto.
Trump includes a provisional three-year work permits for the youngsters under Deferred Action for Childhood Arrivals program as bargaining chip. But his plan is still likely to be voted down as Democrats have open rejected to compromise on the issue.
The Democrats could gain enough support from Senate Republicans rebels to vote for their proposal, which was already pass in the House. However, even so, Trump will likely veto even if the Democrat's bill is passed in the Senate. The Democrats are way short of two-third majority to override Trump's veto.
So, the shutdown might still extend beyond Thursday.
WH Kudlow denies cancelling meeting with China, reiterates importance of enforcing promises
There were rumors that Trump's administration declined, or cancelled, a second deputy-level meeting with China on trade. The meeting was intended for preparation on the top level meeting between US Trade Representative Robert Lighthizer and Chinese Vice Premier Liu He. There were various versions of the rumor. But the key message was that the US is not satisfied with the lack of concrete progress on intellectual property theft and forced technology transfer. China's offer to buy more goods from the US is simply not enough.
But White House economic advisor Larry Kudlow came out denying the rumor and said there was "no cancellation". And he maintained the high-level meeting later this month between Lighthizer and Liu was "very, very important" and "determinative." And, "There were no other intermediate meetings scheduled," while "The story is unchanged. We are moving towards negotiations."
Yet, Kudlow also emphasized that "enforcement is absolutely crucial to the success of these talks." "Promises are great but enforcement is what we want -- things like deadlines and timetables and full coverage of the various structural issues," he said. "Will this all be solved at the end of the month? I don't know. I wouldn't dare to predict."
Is The Eurozone Economy Close To Recession?
Executive Summary
The recent slowdown in Eurozone economic growth has sparked fears that the bloc may be approaching, or already in, a recession. Forecasting recessions is a notoriously difficult task, and even defining what marks a recession is not always straightforward. In this report, we identify a couple simple rules of thumb that may allow readers to monitor the economic data for signs of an imminent recession in the Eurozone. While some recent indicator readings are worrying, we do not believe the data at present suggest a Eurozone recession is either imminent or inevitable.
Draghi Acknowledges Economic Disappointments
European Central Bank (ECB) President Mario Draghi spoke to the European Parliament last week and, as part of that speech, provided his latest assessment of the Eurozone economy. Among his comments, Draghi said consumption and investment are still expanding and that the labor market remains strong. He added that economic expansion is happening at slower and slower growth rates and that significant monetary stimulus is still needed, but nonetheless stated that the European economy is not heading to a recession. Clearly the prolonged period of slow growth is attracting the attention of ECB policymakers. A natural question to ask is “how close is the Eurozone to recession?” – the answer to which could have significant implications for Eurozone financial markets and ECB monetary policy.
How Can We Tell If a Recession Is Taking Place?
Of course, to know if we are in an economic recession or heading in that direction, it is important to understand what a recession looks like and how to determine if it is taking place. For the United States, an official recession, as defined by National Bureau of Economic Research (NBER), is:
“a significant decline in economic activity spread across the economy, lasting more than a few months, normally visible in real GDP, real income, employment, industrial production, and wholesale-retail sales.”
In terms of identifying a recession, there are essentially two differing approaches. The first is to simply monitor the contemporaneous or recently released economic figures, and assess whether the data are suggestive of an economy that is in contraction. For example, a “shorthand” definition of a recession is often considered to be two consecutive quarters of a decline in real GDP.
A second and less timely approach to identifying and determining recession is to rely on an “official” arbiter of the economic or business cycle. In the United States, for example, this role is fulfilled by the NBER. Meanwhile, acknowledging that there is a shorter history of business cycle dating in Europe, the Center for Economic Policy Research (CEPR) fulfills a broadly similar task for the Eurozone economy. Determining recessions via an “official” arbiter is a less timely approach, simply because these institutions assess a broader range of economic indicators and await potential revisions to economic data before determining that the economy has started contracting. Because of this, it can be several months or quarters later before there is an official declaration that a recession has either started or ended.
Eurozone Recessions: Five Since 1970
For the Eurozone economy as a whole, economic recessions have been reasonably infrequent. The CEPR has determined that since 1970 there have been five region-wide recessions. Our primary interest for the purposes of this report are the two most recent Eurozone recessions that occurred around 2008-2009 and 2011-2013, periods for which relatively high quality, high frequency economic data for the aggregate Eurozone economy are available.
The CEPR dates Eurozone recessions by quarter, and has determined that the past two Eurozone economic recessions took place from Q2 2008 to Q2 2009, and from Q4 2011 to Q1 2013. The 2008- 2009 recession was particularly sharp and severe, occurring around the time of the global financial crisis. Thus, for the purposes of our analysis, it may be the latter 2011-2013 recession that is more instructive in assessing just how close we might be to a Eurozone recession
Perspective One: The Pace of GDP Growth
One approach is to monitor whether GDP growth slowed below a certain speed, and for how long, prior to the Eurozone falling into recession. Analogous to a bicycle needing to maintain a certain amount of forward momentum to avoid falling over, the idea is that the economy needs to maintain a certain degree of forward momentum to avoid falling into recession. Just ahead of the recession that began in late 2011, the second and third quarters registered zero growth, an outcome that was consistent with the economy subsequently falling into recession. There were, however, other periods of particularly slow growth since 2000 where despite that slow growth the Eurozone economy was able to avoid recession (Figure 1). We detail those episodes below:
- Q3 2004-Q1 2005: cumulative 0.9% growth over three quarters, with all three quarters positive.
- Q4 2002-Q2 2003: cumulative 0.1% growth over three quarters, with two of those three quarters positive. Arguably it was this episode that was closest to providing a “false signal” of an impending recession.
- Q2 2001-Q1 2002: cumulative 0.6% growth over four quarters, with all four quarters positive.
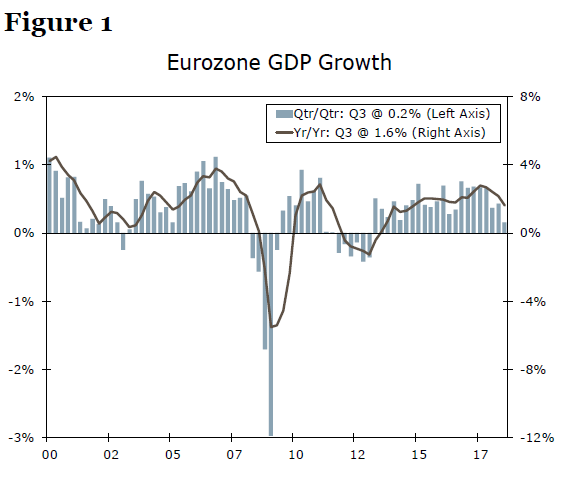
To summarize then, two quarters of zero growth in 2011 was shortly thereafter followed by a Eurozone recession, while an average quarterly growth pace of 0.15% to 0.30% over three to four quarters was “strong” enough for the economy to avoid falling into recession. Expanding on the bicycle analogy and referring specifically to the Q4 2002-Q2 2003 period, we note that a meager pace of forward progress does not guarantee a bicycle will fall over, but it certainly makes the rider more susceptible to an uneven road surface or an unexpected wind gust. In a similar fashion, once economic growth slows below a certain speed, the economy likely becomes more susceptible to unexpected shocks. Taking that into account, we believe a reasonable rule of thumb is that an average growth pace of 0.15% for as long as three to four quarters is perhaps still strong enough for the Eurozone economy to avoid recession, but a drop below that pace could be a signal of an impending recession.
Perspective Two: Monitoring Timely Survey Data
Another constructive approach, in our opinion, is to monitor the timely Purchasing Managers Indices (PMI) data for signs of an approaching recession (PMI data are available since the late 1990s). Figure 2 compares lows in the composite PMI for the entire economy (that is, both the manufacturing and service sectors) relative to Eurozone GDP growth. Theoretically, PMI readings above 50 indicate economic expansion, while readings below 50 indicate economic contraction. Overall, movements in the PMI offer good guidance on trends in GDP, although the relationship is not perfect. For example, there were a couple of instances in the early part of the last decade where the PMI fell below 50, but the Eurozone economy did not fall into an official recession.
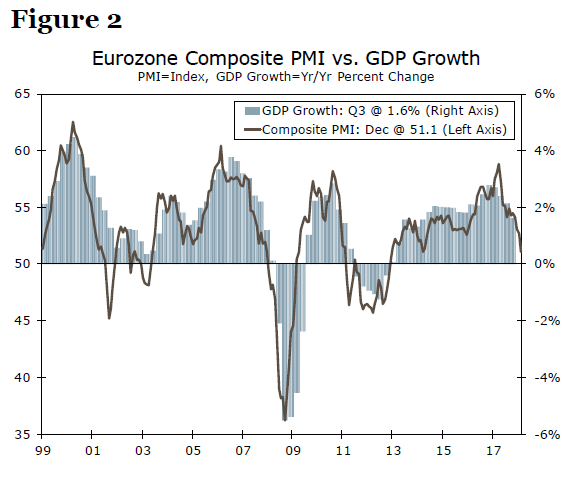
Once again utilizing our bicycle analogy, our question becomes whether there is a certain level of forward economic momentum that is needed to avoid falling into recession. In this case, we view the equivalent question as ‘is there a certain level of the PMI below which we should be worried about an increased risk about a Eurozone recession?”
Over the past two decades, there are several instances in the Eurozone of slowing growth and a falling PMI. In a few instances, the PMI stabilized and recovered above the 50 level (i.e. consistent with expansion). Moreover, in those instances GDP growth firmed and the expansion continued. In some other cases the PMI fell below the 50 level (i.e. consistent with contraction) and in some— but not all—of the instances the economy fell into recession. A couple of times there were arguably special factors—proverbial bumps on the road—that may have exacerbated declines and led to depressed readings. For example, the October 2001 low in the PMI occurred immediately in the wake of the September 11 terrorist attacks, while the June 2003 low occurred at the onset of the U.S. military invasion of Iraq, which happened in late March of that year. In any case, all of episodes above are detailed in the immediately following table:
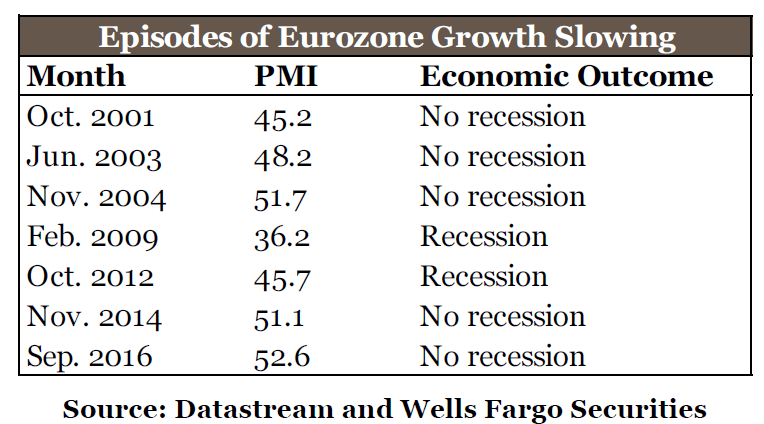
Looking first at the episodes where the PMI declined meaningfully but ultimately stabilized in expansion territory above 50, the PMI reached lows in November 2004, November 2014 and September 2016. The lowest of three troughs was 51.1 in 2014 which, in our view, suggests some evidence the PMI can stabilize and recover so long as the PMI stays above 51.0. Put another way, PMI readings above 51.0 were consistent with an economy that ultimately avoided recession. That said, the 51.0 level could also arguably be viewed as one in which the economy is teetering on the edge. In every other instance where the PMI fell below 51.0 it ultimately bottomed clearly in contraction territory. In essence, the risk of recession arguably increases once the PMI falls to 51.0 or below, and thus a potential rule of thumb is that a decline (or a trough) in the composite PMI below 51.0 could be a signal of an impending recession, whereas a stabilization above 51.0 suggests a recession could be avoided.
Warning Lights Flashing Yellow, Not Red
Taking things a step further, we combine each of the recession signals (the level of the composite PMI and trailing GDP growth) to assess whether the Eurozone economy is close to recession now. The idea here is that the strongest signal of a potential recession, or that we are close to recession, is when both of these indicators/signals are pointing to that outcome. Examining the episodes we described earlier, the table below highlights whether there was an overall signal of, or confirmation that the economy was already in, recession.
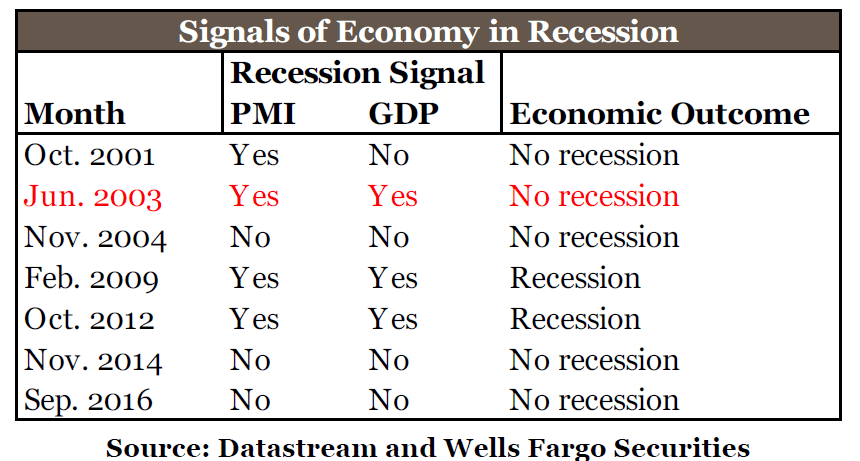
In only one instance (June 2003) was there a false signal, where both the level of the PMI and trailing GDP growth were signaling an impending recession that never occurred. Thus, while assessing how close the Eurozone is to economic recession is clearly part art and part science, our findings suggest that our rules of thumb have done a reasonable job in signaling whether a recession is approaching or not. What then are the implications for the current episode? Like ECB President Draghi, we do not (yet) believe these important economic indicators are signaling an approaching Eurozone recession. GDP growth has averaged 0.33% per quarter over the past three quarters, a pace that has been consistent with the Eurozone avoiding recession in the past (Q3 2004-Q1 2005 and Q2 2001 to Q1 2002). Similarly, the December 2018 PMI of 51.1 is not yet at a level that would more clearly and consistently signal an approaching economic downturn, although it is close. Accordingly, while some recent indicators are worrying, we do not believe a Eurozone recession is imminent or inevitable. In our view, GDP growth would need to range between 0.1%-0.2% (or slower) per quarter for three or more quarters AND the composite PMI would have to remain at or below the 51.0 level for several months before we would become seriously concerned that the Eurozone is either imminently approaching, or in, economic recession
Market Morning Briefing: Aussie Has Been Coming Off From 0.7235
STOCKS
Yesterday we said, "maybe growth concerns will trigger profit-taking in the medium term." But, profit-taking came in yesterday itself, instead of a little later in time.
Dow Jones (24404, -301.87, -1.22%) has seen a decent dip and could be breaking the uptrend since 21712.53 (Dec). 25000 now gets established as a strong medium-term Resistance. Be ready for dip towards 23000 at least, possibly even 22500 over the next few weeks.
As mentioned earlier, DAX (11090, -46.09, -0.41%) has good Resistance at 11300 and might turn down towards 10600 anytime now.
Given that profit-taking is setting in already, upside in Nikkei (20631) might be limited to 21000 instead of the 21300 we mentioned yesterday.
Shanghai (2586, +0.31%) is up today after dip to 2573 yesterday. Still see important Resistance in the 2600-60 region and favour a profit-taking dip from anywhere between current level and 2660.
Although the Sensex (36444.64, -134.32, -0.37%) and Nifty (10922.75, -39.10, -0.36%) appear a little more resilient than the other Indices, it might be incorrect to expect them to be bullish while the others fall for the next few weeks. It might be prudent to budget for a corrective dip towards 34000 and 10500 on the Sensex and Nifty respectively in the medium term.
COMMODITIES
Brent (61.49) and WTI (52.99) have dipped as expected. Resistances on the longer term line charts seemed to have held and could push prices towards 60-58 (on Brent) and 50 (on WTI) respectively.
Gold (1284.10) and Silver (15.38) have tried to move up a bit but while Gold and Silver trade below 1290 and 16, view is bearish for the near term.
Copper (2.6680) looks bearish while below 2.70 and could target 2.60 in the coming sessions.
FOREX
Dollar Index (96.33) and Euro (1.1363) are trading stable just now. As mentioned yesterday, Euro is trading above immediate support at 1.1350 and while that holds, the currency could bounce back towards 1.14-1.15 levels. Unless a clear break below 1.1350 is seen, we may not consider bearishness for the coming sessions just now. Correspondingly, a dip in the dollar Index is expected towards 95.50-94.50.
Dollar Yen (109.66) saw a slight dip but while above 108, the pair looks bearish towards 111 in the near term. Overall medium term bullishness is intact.
Pound (1.2958) has risen and could re-test 1.30 before coming off from there. While 1.30 holds, a fall to 1.2750 can be expected; else Pound could test upside resistance near 1.31 as seen on the 3-day line charts.
Aussie (0.7133) has been coming off from 0.7235 and looks bearish towards 0.7050, if an immediate bounce from here is not seen. A fall to 0.705 is possible followed by a rise back to current levels.
USD-CNY (6.7973) has dipped slightly within the medium term upmove. The current dip could be restricted to 6.78 while the pair may move up again towards 7.83. View is bullish.
Dollar Rupee (71.4450) rose yesterday to close above 71.40. While the pair trades higher, a test of 71.60 is possible on the upside. We continue to watch price action near 71.40/60 levels. A break above 71.60 would take it higher towards 71.85
INTEREST RATES
Slight dip in US Yields yesterday, being attributed to slowdown fears. The US 5Yr (2.58%), 10Yr (2.75%) and 30Yr (3.07%) have all dipped 2bps compared to no movement in the 2Yr (2.59%). We have to see whether the US 5Yr can see a deeper fall towards 2.45% which is a strong, long-term Support coming up from near 0.90% in 2016.
Bank of Japan meeting today. Japanese Yields (2Yr -0.18%, 5Yr -0.18%, 10Yr -0.01%, 20Yr +0.44% and 30Yr +0.65%) are again heading lower. A rise in yields looks unlikely anytime soon.
In Germany also, all the Yields (5Yr -0.36%, 10Yr 0.23% and 30Yr 0.83%) expect for the 2Yr (-0.60%) could also dip a bit.
In India too, the 10Yr GOI (7.5327%) dipped a bit more yesterday. As such, we may consider 7.59-7.65%-7.70% to be a decent Resistance for now.
AUD/USD Could Extend Downside Correction To 0.7050
Key Highlights
- The Aussie Dollar started a downside correction after trading as high as 0.7235 against the US Dollar.
- There was a break below a key contracting triangle with support at 0.7155 on the 4-hours chart of AUD/USD.
- The US Existing Home Sales declined 6.4% in Dec 2018 (MoM).
- The Euro Zone Consumer Confidence for Jan 2019 (Prelim) will be released today, which could decline to -6.5 from -6.2.
AUDUSD Technical Analysis
After a solid uptrend, the Aussie Dollar faced sellers near the 0.7220-0.7240 area against the US Dollar. As a result, the AUD/USD pair started a downside correction and declined below 0.7200 and 0.7150.
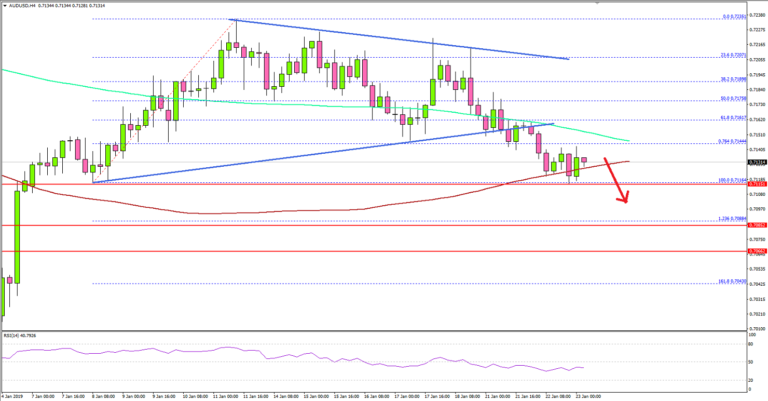
Looking at the 4-hours chart, the pair traded as high as 0.7235 and later declined steadily and slowly. Sellers pushed the pair below the 0.7150 support and the 200 simple moving average (green, 4-hours).
There was a break below the 76.4% Fib retracement level of the last wave from the 0.7116 swing low to 0.7235 high. More importantly, the pair traded below a key contracting triangle with support at 0.7155 on the same chart.
It has opened the doors for more declines below the 0.7116 swing low and the 0.7100 level. The next stop could be the 1.236 Fib extension level of the last wave from the 0.7116 swing low to 0.7235 high at 0.7088. However, if sellers remain in action, the pair might even test the 0.7050 support area.
On the upside, the previous supports near 0.7150 and 0.7160 along with the 200 simple moving average (green, 4-hours) are likely to act as resistances for buyers in the short term.
Fundamentally, the US Existing Home Sales report for Dec 2018 was released by the National Association of Realtors. The market was looking for a 1.2% decline in sales Dec 2018, compared with the previous month.
The actual result was well below the market forecast as the US Existing Home Sales declined 6.4%. On the other hand, the last reading was revised up from 1.9% to 2.1%.
Overall, the US Dollar may correct lower in the short term, but downsides remain support and pairs like EUR/USD and GBP/USD may resume bearish moves.
Economic Releases to Watch Today
- Euro Zone Consumer Confidence Jan 2019 (Preliminary) – Forecast -6.5, versus -6.2 previous.
- Canadian Retail Sales Nov 2018 (MoM) – Forecast -0.6%, versus +0.3% previous.
- Canadian Retail Sales ex Autos Nov 2018 (MoM) – Forecast -0.4%, versus 0% previous.
Daily Markets Broadcast
Wall Street falls as economic outlook sours
US indices extended the downward trajectory yesterday as weak earnings and a poor outlook from reporting companies hit risk appetite.
US30USD Daily Chart
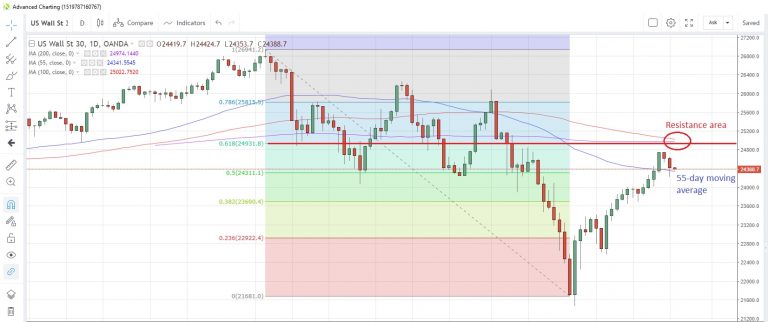
The US30 index fell the most in nearly three weeks yesterday but rebounded off the lows after the US assured that trade negotiations with China were still on. Earlier in the session, rumours circulated that a mid-level meeting had been cancelled. The US confirmed it was never due to happen in the first place
The index is retesting the 55-day moving average at 24,341, which it breached to the upside last Friday
US existing home sales decelerated in December, data released yesterday showed. Senate leaders have agreed to votes on rival proposals for reopening the government for the first time since the shutdown began last month. President Trump has already said he will veto any measures that don’t include funding for his Mexico wall.
DE30EUR Daily Chart
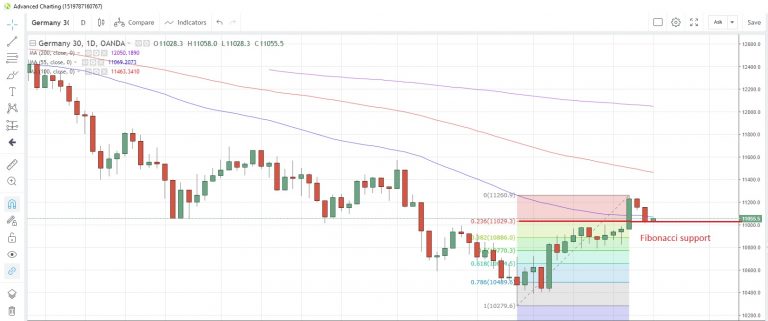
The Germany30 index fell for a second day yesterday, led by weakness in Asia and disappointing results from UBS. A lack of definitive progress on the Brexit front also pressured
The index is back below the 55-day moving average at 11,069 and is testing Fibonacci support at 11,029, which is 23.6% retracement of the December-January rally
Euro-zone consumer confidence is expected to dip to -6.5 in January from -6.2 the previous month. Yesterday, Germany’s ZEW survey was not as bad as feared, coming in at -15.0 instead of -18.4 forecast.
HK33HKD Daily Chart
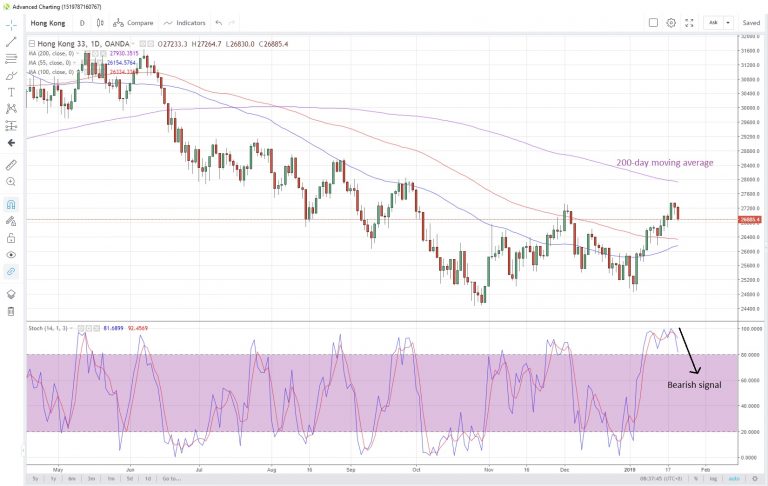
The Hong Kong33 index appears to be stalling ahead of the 200-day moving average as weakness on Wall Street influences
The 200-day moving average is at 27,930 while the daily slow stochastics momentum indicator is giving bearish signals
Hong Kong press is reporting that the “Made in China 2025” plan has been hurt by the trade war, with advanced manufacturing sectors in China facing weakening demand.
Eco Data 1/23/19
[php_everywhere instance="1"]