Sample Category Title
EUR/USD Tests Deep 78.6% Fibonacci After Bearish Zigzag
A break above the resistance trend line (red) would indicate a bullish breakout towards the Fibonacci targets of wave C vs A. A break below the 100% Fibonacci level of wave 2 vs 1 however would invalidate the wave 2 pattern. Bearishness is only expected if price is able to break below the bottom of the consolidation zone (orange arrows).
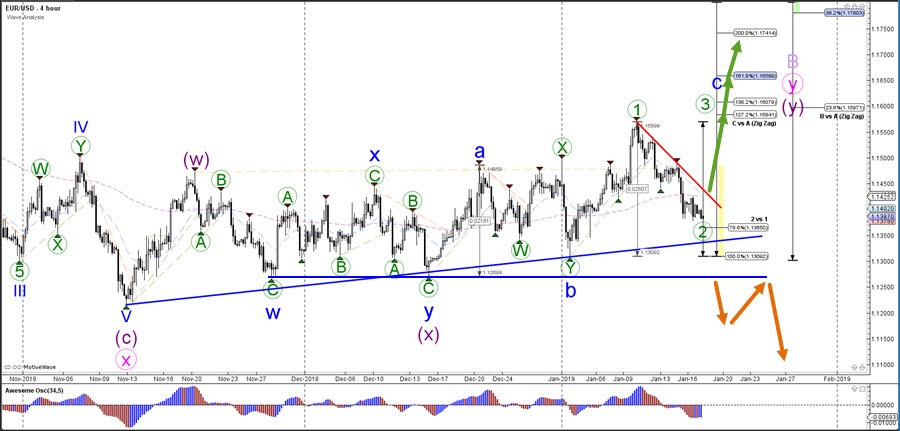
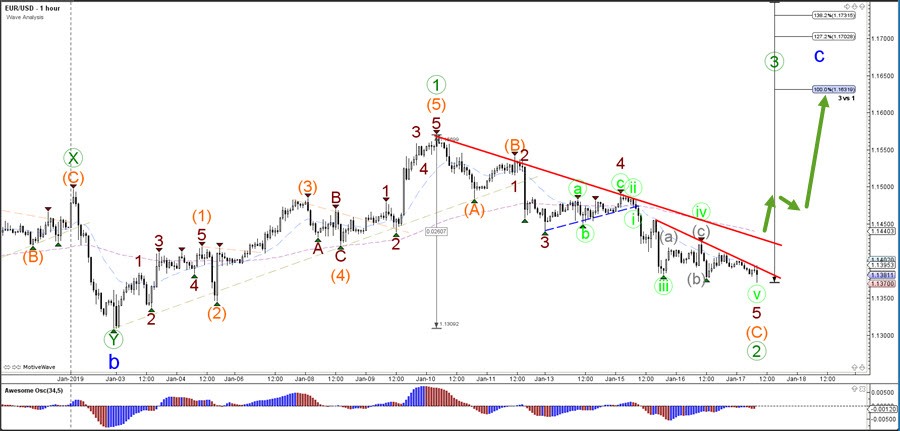
The EUR/USD seems to be completing a bearish ABC (orange) zigzag pattern within wave 2 (green). But the confirmation only occurs if price is able to break above the resistance trend lines (red lines) with strong bullish momentum.
XAUUSD Intraday Analysis
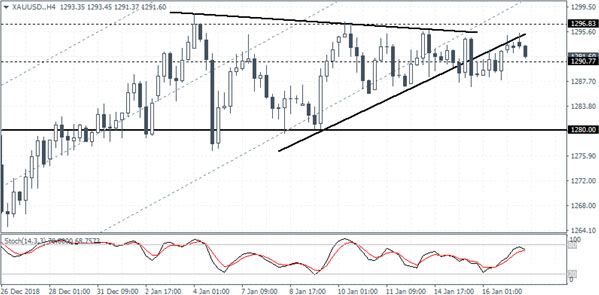
XAUUSD (1291.60): Gold prices inched higher to test intraday highs of 1295 before easing back. Price action remains flat, and the consolidation could potentially trigger a breakout in the near term. But with the 1280 support holding on any declines could likely stall at this level. Only a break down below 1280 will signal the move to the 1250 handle. As a result, we expect gold to remain trading flat at the current levels with multiple upside retest to the 1295 level. There is scope for gold prices to test the 1300 level to establish resistance.
AUDUSD Intraday Analysis
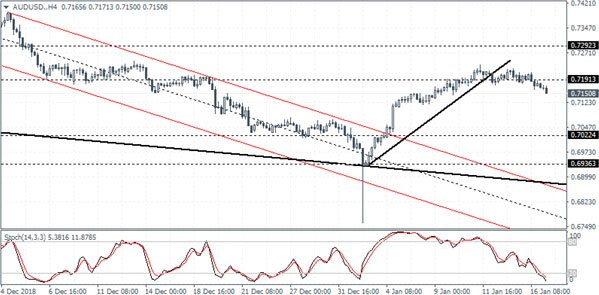
AUDUSD (0.7150): The AUDUSD currency pair is seen breaking out of its consolidation as price action is seen trading below the support level of 0.7191. The declines could potentially mark a retest of the support at 0.7022. In the short term, we could expect to see the AUDUSD retesting the current level of 0.7191 which could be tested for resistance. This could confirm the move to the lower support which has been pending retest for a while. As long as AUDUSD remains above 0.7022, we expect the bias to stay to the upside.
EURUSD Intraday Analysis
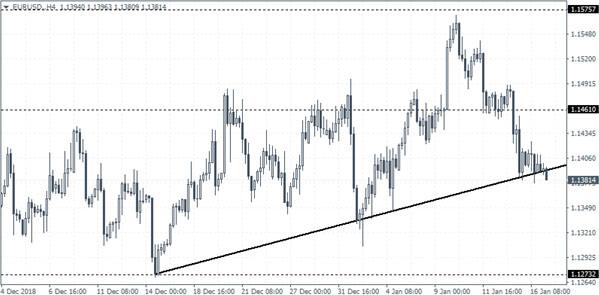
EURUSD (1.1381): The EURUSD currency pair is looking to extend the declines down to 1.1200 level as price action is breaching past the minor rising trend line. The drops come following the failure of support at 1.1461. If price action posts a daily close below the minor rising trend line, we could expect the currency pair to push lower and potentially retest the lower end of the range. In the longer term, price action is seen staying flat within the levels of 1.1461 and 1.1200.
Eurozone Inflation To Fall To 1.9% In December 2018
The markets continued to focus on Brexit which dominated the headlines for a second consecutive day. No less than 24 hours after the UK Parliament rejected the Brexit bill, the opposition party leader Jeremy Corbyn moved for a no-confidence motion against the government.
This led to the no-confidence vote to happen later in the day. The result was that Theresa May won the vote of no-confidence. This puts Brexit back into the headlines as the negotiations with the EU continue.
Earlier in the day, the Bank of England governor, Mark Carney gave his testimony to the UK parliament. He said that the UK banks have enough capital to face with any extreme outcomes. Carney was confident that the recent surge in the GBP showed that a no-Brexit deal is not in sight.
The UK's inflation data showed that headline consumer prices rose just 2.1% in December on an annualized basis. This was a slower pace of increase in consumer prices following November's print of 2.3%.
The core inflation rate was however slightly higher, rising from November's 1.8% to 1.9% in December on the year.
Data from the U.S. showed that import prices fell by 1.0% compared to the forecasts of a 1.3% decline.
The markets today start off with the Eurozone's final inflation report for December. According to the preliminary flash estimates, Eurozone's consumer prices were seen rising 1.9% on the year in December while core inflation was seen at 1.0%. This would mark a slowdown in the pace of inflation increase and comes as the ECB is starting to tighten monetary policy.
The NY trading session will see the Philly Fed manufacturing index data coming out. The index should increase to 10.1, up from 94 previously.
Currencies: How Long Will USD Maintain The Benefit Of The Doubt?
- Rates: Looking for new clues
Technically-inspired and sentiment-driven trading characterizes core bond moves the past days. The thin eco/event calendar today and tomorrow, suggests more of the same. Italian BTP’s profited from a relief rally following Wednesday’s bumper 15y syndicated deal. - Currencies: How long will USD maintain the benefit of the doubt?
The dollar rebounded this week as markets focused on US economic outperformance (especially versus EMU) instead of on a softer Fed. However, as there is also plenty of event risk in the US, this trade might run into resistance soon. Sterling rallied on market hopes for a softer Brexit or a delay. This move might also halt unless there are concrete signs of progress
The Sunrise Headlines
- US equity markets gained modest ground yesterday as earnings season started better than expected. Asian equities opened mainly in green, but very cautiously.
- UK PM May remains in the saddle as her government survived the no-confidence vote, called by opposition and Labour leader Corbyn, very narrowly (325/306). Afterwards, she invited opposition leaders to join the talks.
- US federal prosecutors are said to take a more aggressive stance against the Chinese company Huawei, as the investigation of the tech giant for stealing trade secrets from US partner companies is entering an advanced stage.
- Greek PM Tsipras survived a 4th vote of no confidence (151/149) of his term in office. He lost majority after his coalition partner pulled out of the government in protest over a reform with its northern neighbouring Republic of Macedonia.
- Italian PM Conte said that his cabinet will approve the final budget today and confirms that it contains key measures of income support for the poor and a lower retirement age for some.
- Fed’s beige book paints a rather positive picture for the US economy but said optimism is fading among businesses. Trade disputes, government shutdown and rising borrowing costs causes companies to scale back planned investments.
- Today’s US economic calendar contains the Philadelphia Fed Business Outlook for January and weekly jobless claims. The earnings season continues (Morgan Stanley, Netflix,…) and several ECB/Fed governors speak. Spain taps the market.
Currencies: How Long Will USD Maintain The Benefit Of The Doubt?
USD rally to shift into lower gear?
The (trade-weighted) dollar continued its rebound yesterday. Doubts on the EMU economy counterbalanced expectations for a cautious Fed and capped the EUR/USD rebound from the start of the year. US equities outperformed and interest rate differentials widened in favour of the US dollar. Good results from major US banks gave investors some further confidence on the resilience of the US economy. The Fed Beige book reported respondents to become less optimistic but had little impact on the dollar. EUR/USD closed at 1.1392 (from 1.1413). USD/JPY ended the day at 109.09 (from 108.68). Asian indices show a mixed picture This morning. Headlines on the US probing Huawei is bringing the China-US trade tensions again to the forefront, slowing the global risk rally. Changes in the major USD cross rates are limited, but the (trade-weighted) dollar (DXY 96.15 area) maintains a tentative upward bias. EUR/USD is trading near 1.1385. USD/JPY is running into resistance. The pair struggles not to fall back below 109. Later today, the EMU CPI is expected to be confirmed at 1.6% Y/Y. US housing data are postponed due to the government shutdown. The Philly Fed Business outlook is expected little changed (9.5 from 9.1) after a decline in previous months. Maybe there are downside risks. Last week, the dollar eased on a softer Fed. This week the focus turned to the relative performance between the US and EMU economies. Markets currently see more risks to EMU growth than is the case for the US. This balance might tilt again (e.g. due to the shutdown) but for now the dollar gets the benefit of the doubt. We still see no hard case for a sustained USD rally, but the day day-to-day momentum is EUR/USD negative. We look for a bottoming out process. EUR/USD 1.1309 is first minor support. We also look out whether the dollar can maintain its positive spin if the (US-inspired) risk rally and the rise in US yields were to slow.
Sterling maintained recent gains against the euro and the dollar yesterday, as markets saw a rising chance of a delay of the March 29 Brexit deadline and/or a softer Brexit. UK PM May surviving a no-confidence vote, didn’t change the overall picture on Brexit. PM now tries to work out a new deal with parliament. We don’t expect a break-through anytime soon. If so, the recent sterling rally might run into resistance and more sideways, erratic-like sterling trading might again be on the cards with Monday’s appearance of PM before Parliament the next milestone. The low EUR/GBP 0.88 area is first minor support
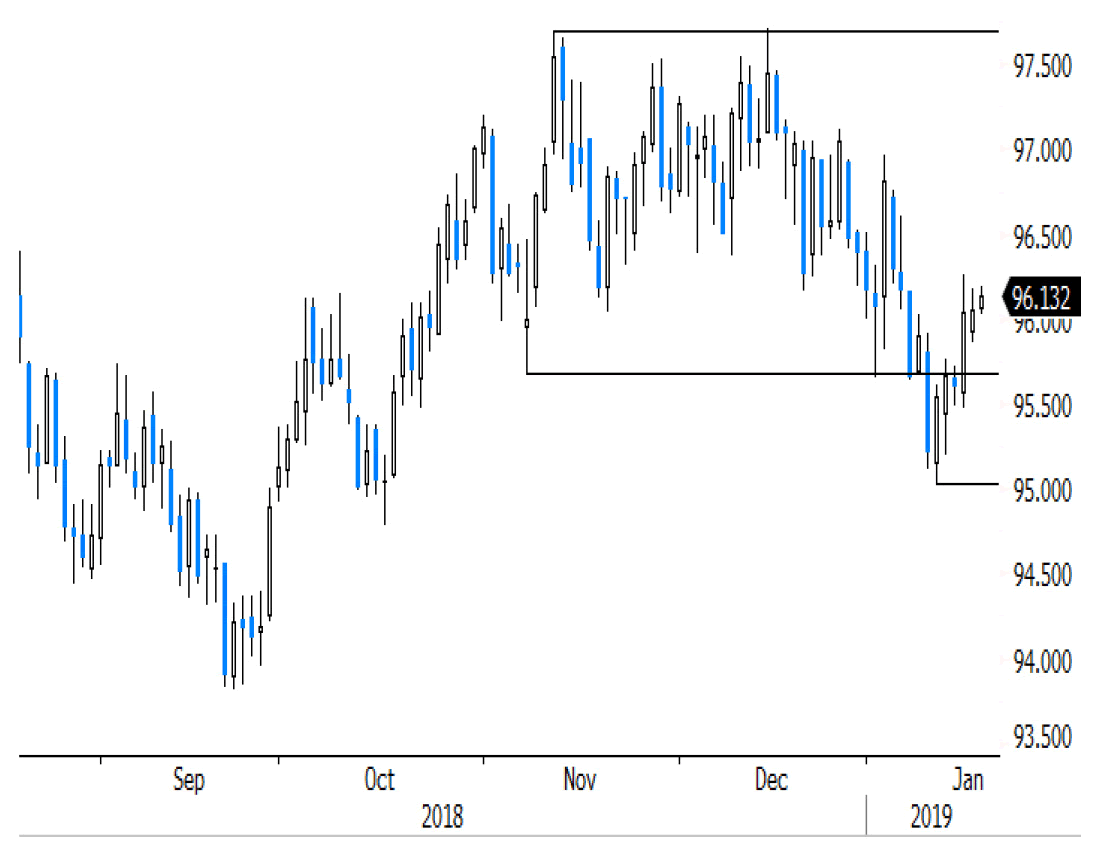
USD (trade-weighted): Dollar profits as markets still see relative outperformance of the US economy.
GBPUSD Watcing Key Moving Average
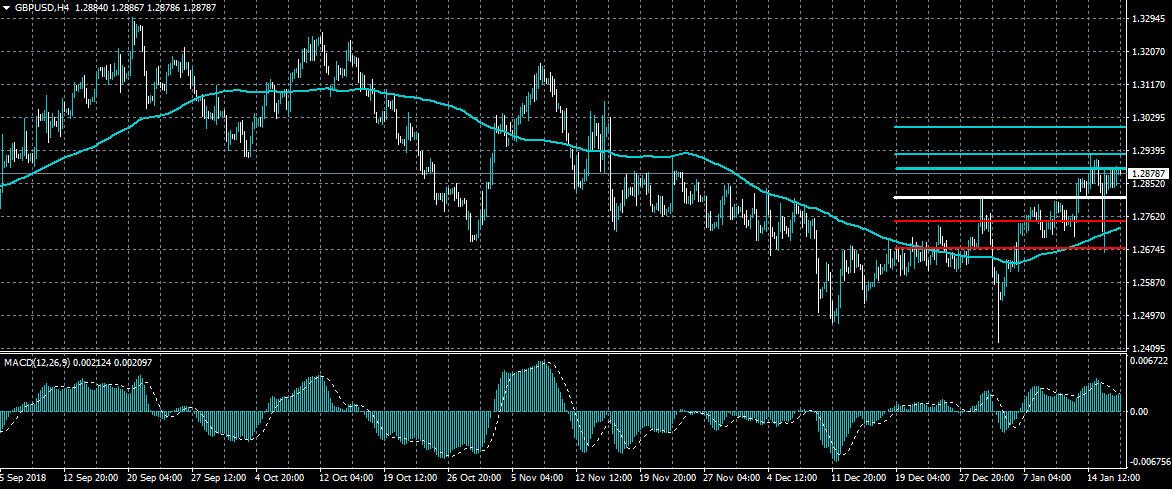
The British pound is moving back towards the 1.2900 level against the US dollar after British PM Theresa May survived a vote of no-confidence in her leadership in UK Parliament on Wednesday. The GBPUSD pairs one-hundred moving average, at 1.2894, is currently capping rallies and is the strongest resistance area before the 1.2930 level. If buyers fail to hold price above the 1.2894 level, a decline back towards the 1.2810 level should be expected.
The GBPUSD pair is intraday bullish while trading above the 1.2810 level, key technical resistance is found at the 1.2894 and 1.2930 levels.
If the GBPUSD pair falls from current levels, key technical support is found at the 1.2810 and 1.2750 levels.
EURUSD Struggling To Move Higher
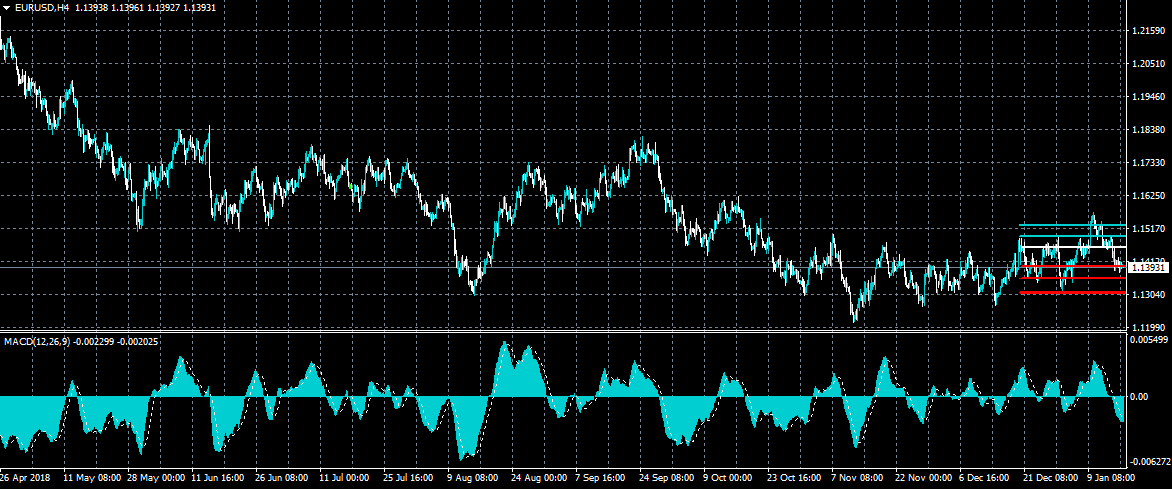
The euro is struggling to move higher against the US dollar, with the pair still trading tentatively around the key 1.1400 level. The Moving Average Convergence Divergence indicator is continuing to create bearish lower price lows across the four-hour and daily time frames. Sellers will likely target the 1.1360 support level, with a move below this area likely to lead to an eventual test of the technically important 1.1300 level.
The EURUSD pair is bearish while trading below the 1.1400 level, key technical support is found at the 1.1360 and 1.1300 levels.
If the EURUSD pair starts to trade above the 1.1400 level, buyers may target the 1.1430 and 1.1460 resistance levels.
BTCUSD Watching $3,485 Level
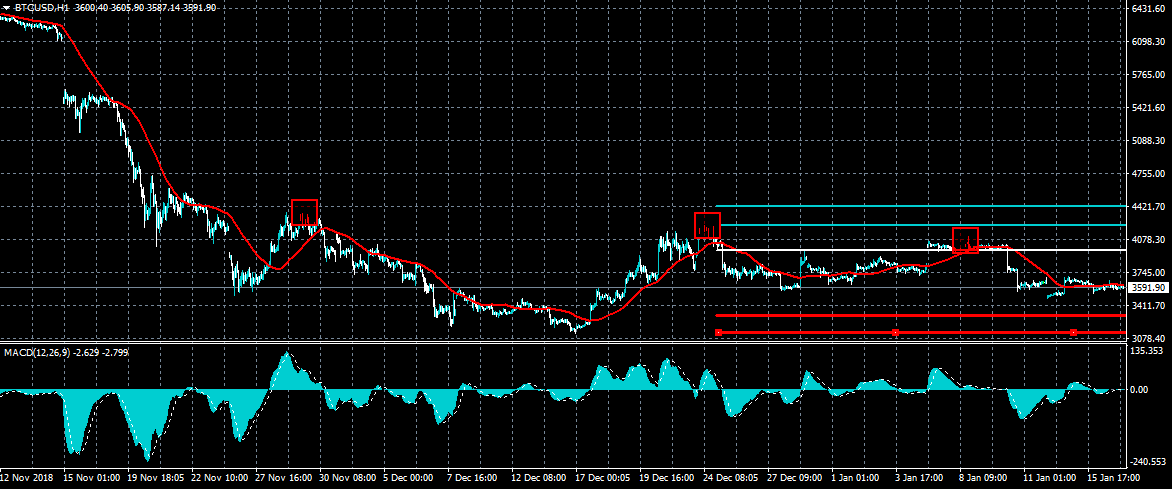
Bitcoin continues to consolidate around the worst trading levels of the week, with the BTCUSD pair currently unable to build a sustainable rally above the $3,660 level. The $3,485 level is now the key intraday region to watch, as it represents the lowest trading level for BTCUSD pair since it started to surrender recent gains. The MACD indicator on the four-hour time frame has also corrected to neutral and awaits the next directional move.
The BTCUSD pair is strongly bearish while trading below the $3,485 level, key technical support is found at the $3,300 and $3,100 levels.
If the BTCUSD pair trades back above the $3,660 level, key resistance is found at the $3,960 and $4,200 levels.
USDJPY Fails To Post Significant Move, Indicators Signal Bullish Shift In Short Term
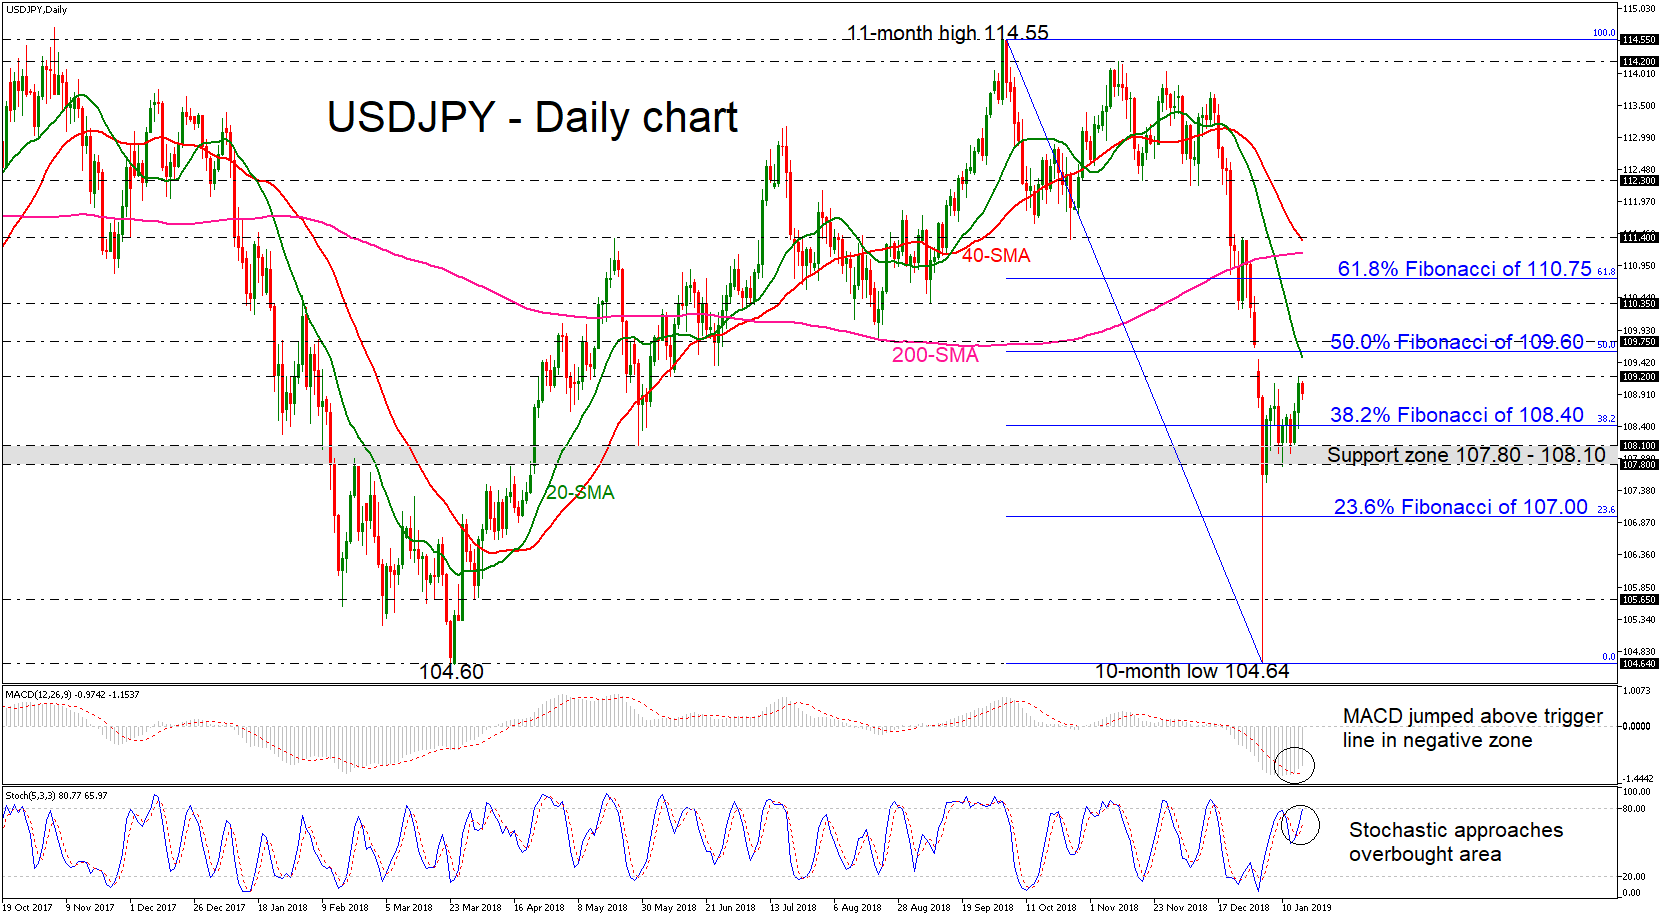
USDJPY printed its second day of gains, touching the 109.20 resistance. However, currently, the pair is paring some of these gains, failing to exit the narrow range within the 107.80 support and the 109.20 resistance in the very short-term. Chances for an upside reversal are increasing as the MACD oscillator recorded a bullish cross with its trigger line and the stochastic oscillator is approaching the overbought zone.
Another step higher may reach key resistance at 109.60 – 109.75, which encapsulates the 50.0% Fibonacci retracement level of the downleg from 114.55 to 104.64. Should this prove a weak obstacle, the buying interest could pick up speed until the 110.35 resistance, taken from the low on September 7, where any violation would bring more pressure to the market with the price extending bullish movement until the 61.8% Fibonacci of 110.75. Though only a close above the latter hurdle would confirm a start of an uptrend.
On the other side, in case of a downward pullback, immediate support could come from the 38.2% Fibonacci mark of 108.40 before the focus shifts to the 107.80 – 108.10 strong support area again. Lower, the 23.6% Fibonacci region of 107.00 could also restrict bearish movements.
In the medium-term structure, USDJPY is still increasingly negative as long as it holds below the 20- and 40-simple moving averages (SMAs) in the daily timeframe, and more importantly under the 200-day SMA, which is still marginally rising.