Sample Category Title
USDJPY Key Moving Average Capping Further Gains
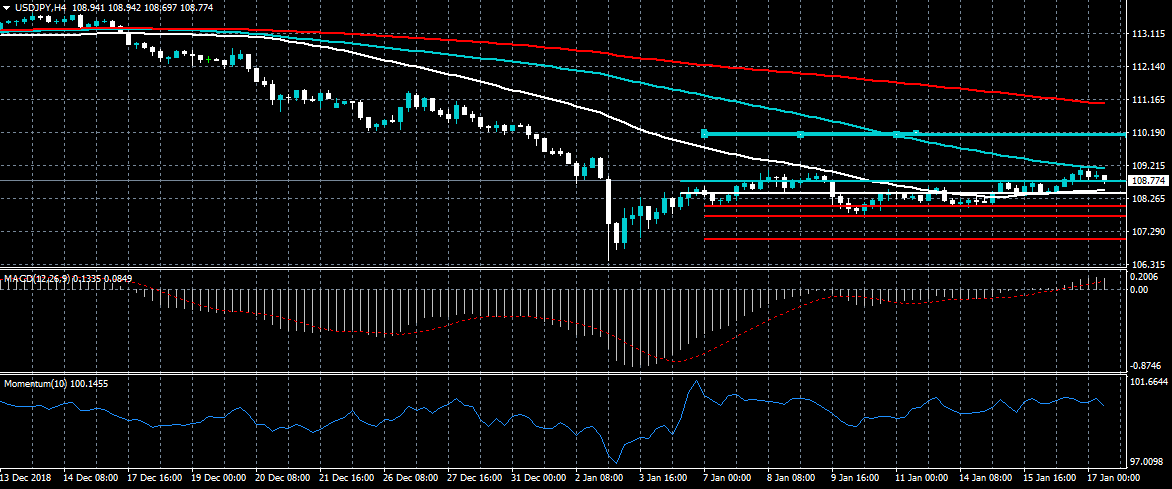
The US dollar continues to advance higher against the Japanese yen, with the risk-sensitive pair earlier breaking above its former weekly trading high, reaching 109.19. The break above the 109.09 level should be taken as bullish, although buyers need to sustain price above this key area for further upside advancement. The USDJPY pairs 100-period moving average on the four-hour time frame is now the key resistance area to watch before the 110.00 level.
The USDJPY pair is strongly bullish while trading above the 108.75 level, key technical resistance is found at the 109.19 and 110.00 levels.
If the USDJPY pair trades below the 108.75 level, sellers may test towards the 108.60 and 108.40 levels.
EURUSD 1.1360 Support Holds Firms
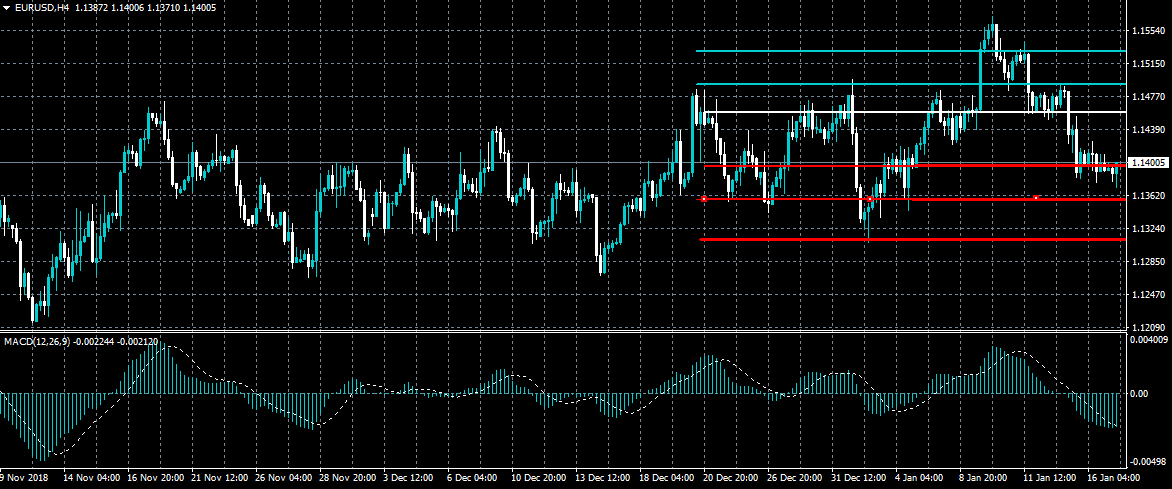
The euro has moved back towards the 1.1400 level against the US dollar after the pair found strong support from just above the 1.1360 level during the European trading session. Continued failure to move price under the 1.1360 level may eventually lead to a technical rebound towards the important 1.1460 level. Overall, the short-term trend still remains bearish while price continues to trade below the 1.1460 level.
The EURUSD pair is intraday bearish while trading below the 1.1400 level, key technical support remains at the 1.1360 and 1.1300 levels.
Should the EURUSD pair start to advance above the 1.1400 level, the price may correct back towards the 1.1430 and 1.1460 resistance levels.
WTI OIL Outlook: Oil Price Remains Within Triangular Consolidation
WTI oil eases in early trading on Thursday, following report about new record high in US oil production, which soured the sentiment.
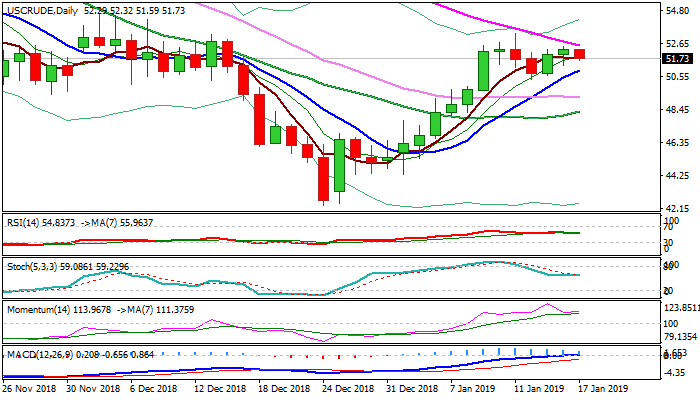
EIA report showed stronger than expected draw in US weekly crude inventories (-2.6 mln bls vs 1.3 mln bls f/c) but positive impact was offset by much stronger rise in distillate and gasoline stocks (distillate 2.9 mln bls build vs 1.5 mln bls f/c, gasoline 7.5 mln bls build vs 2.7 mln bls f/c). Oil price continues to trade in extended directionless mode, shaped in triangular consolidation of recovery leg from $42.36 low.
The upside remains capped by falling 55SMA (currently at $52.55), with falling thick daily cloud continuing to heavily weigh.
On the other side, strong bullish momentum and daily 10/20/30SMA's in bullish setup continue to underpin.
Initial signals could be expected on violation of 10 SMA ($50.97) or 55SMA ($52.55).
Bearish scenario would require extension below 30SMA ($49.25) and confirmation on close below 20SMA ($48.35). Conversely, sustained break above 55SMA would signal attack at daily cloud base ($54.16), violation of which would be bullish signal.
Res: 52.55, 53.29, 54.16, 55.55
Sup: 51.25, 50.97, 50.00, 49.25
Investors’ Attention Is Still Focused On Brexit
During yesterday's trading session, the US currency did not change a lot against the basket of major currencies. The US dollar index (#DX) closed yesterday in the positive zone (+0.07%). Today, important economic statistics will be published in the US. Investors' attention is mainly focused on the Brexit.
After the Brexit vote, the leader of the Opposition Labour Party, Jeremy Corbyn, offered to carry out a vote of no confidence against the government of Prime Minister Theresa May. Yesterday, members of the House of Commons of the UK Parliament expressed confidence in the government: 306 members of parliament supported Theresa May and 325 deputies voted against. If the government faced a no-confidence vote, it could dent the position of Great Britain even more. The issue concerning Brexit is still unresolved. As it became known, the European Union is ready to postpone the process of the UK exit from the EU on the latter half of 2019. According to the plan, Brexit was supposed to end on March 29.
The "black gold" prices are declining after the release of the report on crude oil inventories in the US. At the moment, futures for the WTI crude oil are testing the mark of $51.85 per barrel.
Market Indicators
- Yesterday, there was a variety of trends in the US stock market: #SPY (+0.24%), #DIA (+0.51%), #QQQ (-0.02%).
- The 10-year US government bonds yield is at the level of 2.70-2.71%.
The news feed on 17.01.2019:
- Consumer price index in the Eurozone at 12:00 (GMT+2:00);
- Data on the real estate market in the US at 15:30 (GMT+2:00);
- Philadelphia Fed manufacturing index at 15:30 (GMT+2:00).
The Analytical Overview Of The Main Currency Pairs
The EUR/USD currency pair
Technical indicators of the currency pair:
Prev Open: 1.14111
Open: 1.13923
% chg. over the last day: -0.16
Day's range: 1.13824 – 1.13985
52 wk range: 1.1214 – 1.2557
Yesterday EUR/USD was in a bearish mood. The USD is slightly strengthened against the EUR. The technical picture remains ambiguous, the quotes are moving sideways. The key levels are 1.13800 and 1.14100. You should open positions from these levels. A technical correction is possible soon.
The Economic News Feed for 17.01.2019:
Consumer Price Index (EU) – 12:00 (GMT+2:00);
Real Estate Market Report (US) – 15:30 (GMT+2:00);
PMI Index by the Federal Reserve of Philadelphia (US) – 15:30 (GMT+2:00).
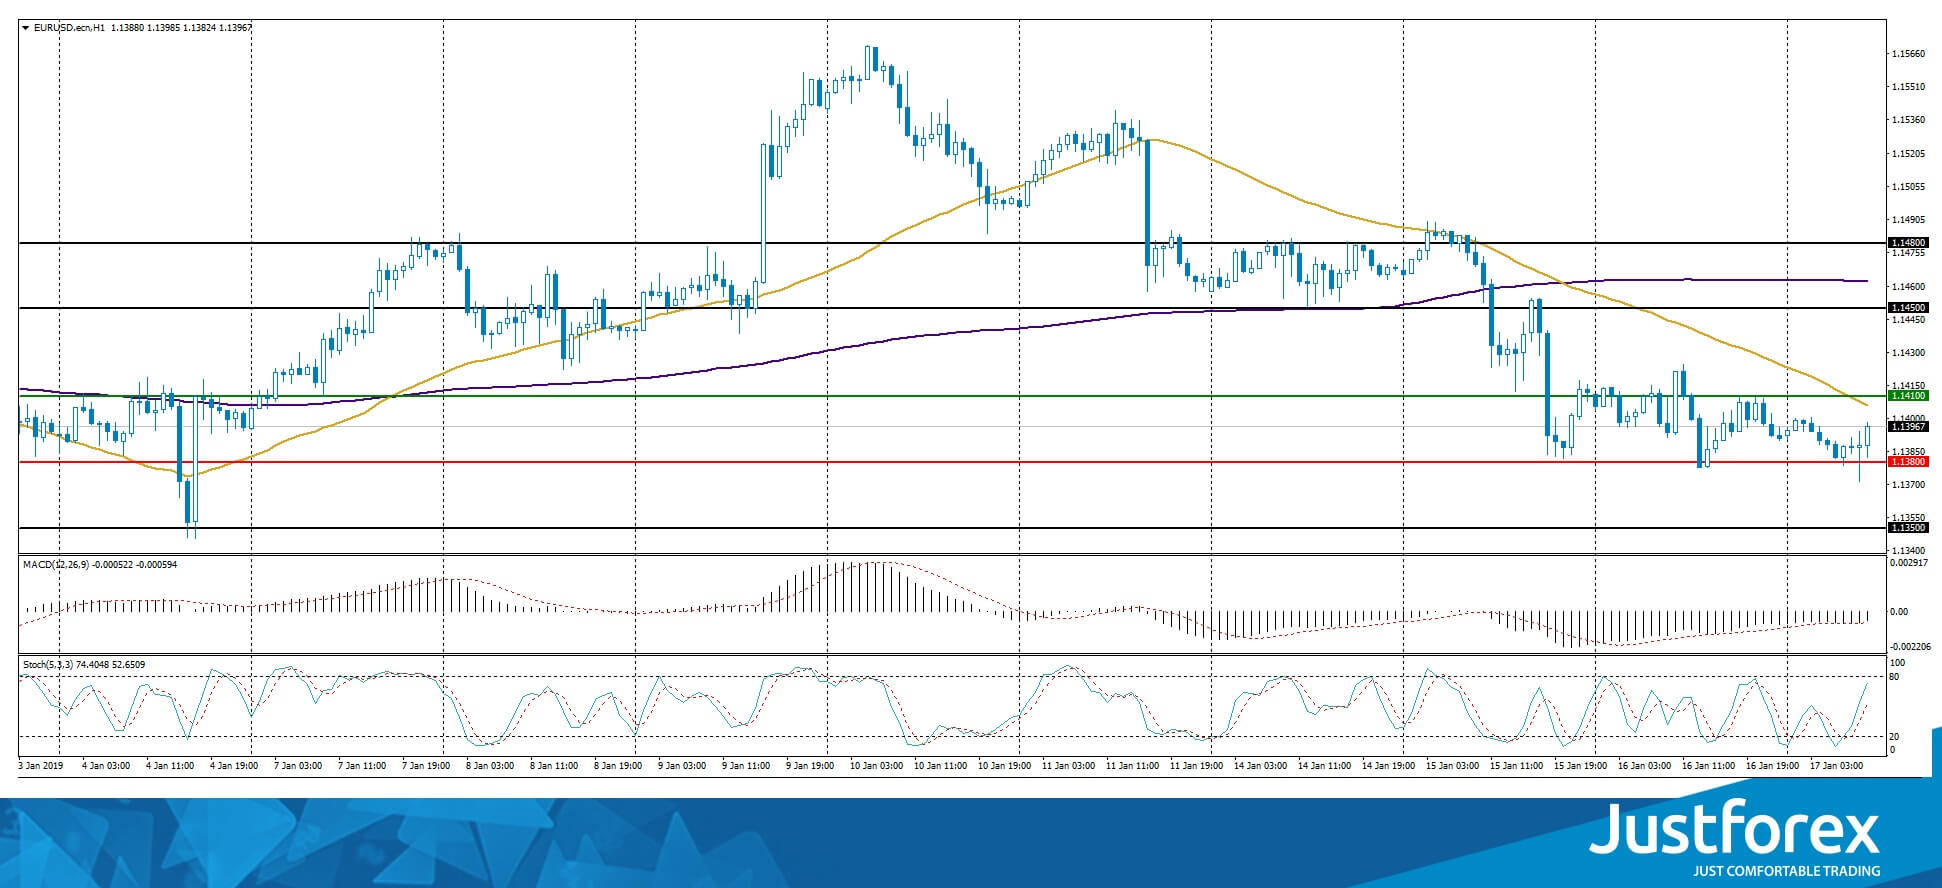
The indicators point to the power of the buyers, the price fixes below 50 MA and 200 MA.
The MACD histogram is in the negative zone but above the signal line which gives a weak signal to sell EUR/USD.
The Stochastic Oscillator is in the neutral zone, the %K line is above the %D line which points to a bullish mood.
Trading recommendations
Support levels: 1.13800, 1.13500
Resistance levels: 1.14100, 1.14500, 1.14800
Should the price fix above 1.14100 expect the quotes to correct toward 1.14500-1.14800.
Alternatively the quotes can fall toward 1.13500-1.13300.
The GBP/USD currency pair
Technical indicators of the currency pair:
Prev Open: 1.28573
Open: 1.28775
% chg. over the last day: +0.21
Day's range: 1.28628 – 1.28705
52 wk range: 1.2438 – 1.4378
GBP/USD is showing a variety of trends. Yesterday the UK published the Consumer Price Index, which grew by 2.1%, as expected. You should open positions from the key levels 1.28500 and 1.28900.
The Economic News Feed for 17.01.2019 is calm.
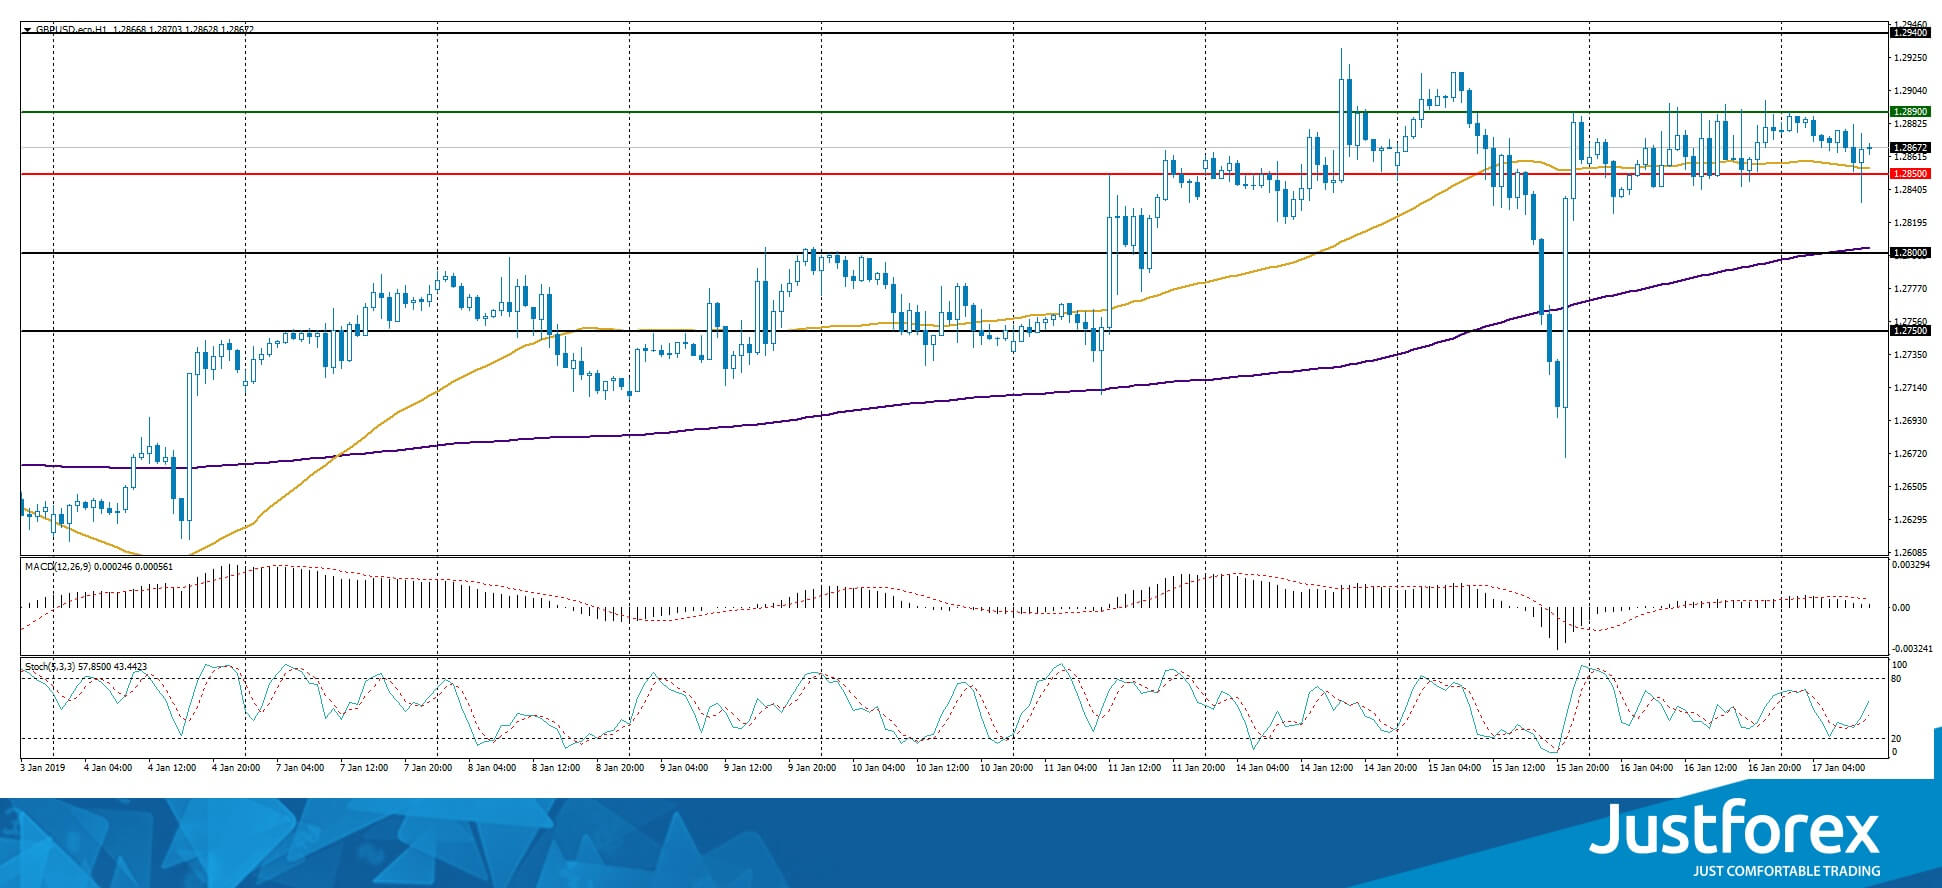
The price fixed above 50 MA and 200 MA which points to the power of the buyers.
The MACD histogram is close to 0. There are no signals.
The Stochastic Oscillator is in the neutral zone, the %K line is above the %D line which points to a bullish mood.
Trading recommendations
Support levels: 1.28500, 1.28000, 1.27500
Resistance levels: 1.28900, 1.29400
If the price fixes below 1.28500, look for market entry points to open short positions. The movement will tend toward 1.28000-1.27800.
Alternatively the quotes can grow toward 1.29400-1.29600.
The USD/CAD currency pair
Technical indicators of the currency pair:
Prev Open: 1.32685
Open: 1.32530
% chg. over the last day: -0.06
Day's range: 1.32769 – 1.32880
52 wk range: 1.2248 – 1.3664
USD/CAD keeps showing an ambiguous technical picture. Today the quotes slightly grew. The investors are waiting for additional drivers. Right now the key support and resistance levels are 1.32700 and 1.33000. You should open positions from these levels. The quotes can grow further.
The Economic News Feed for 17.01.2019 is calm
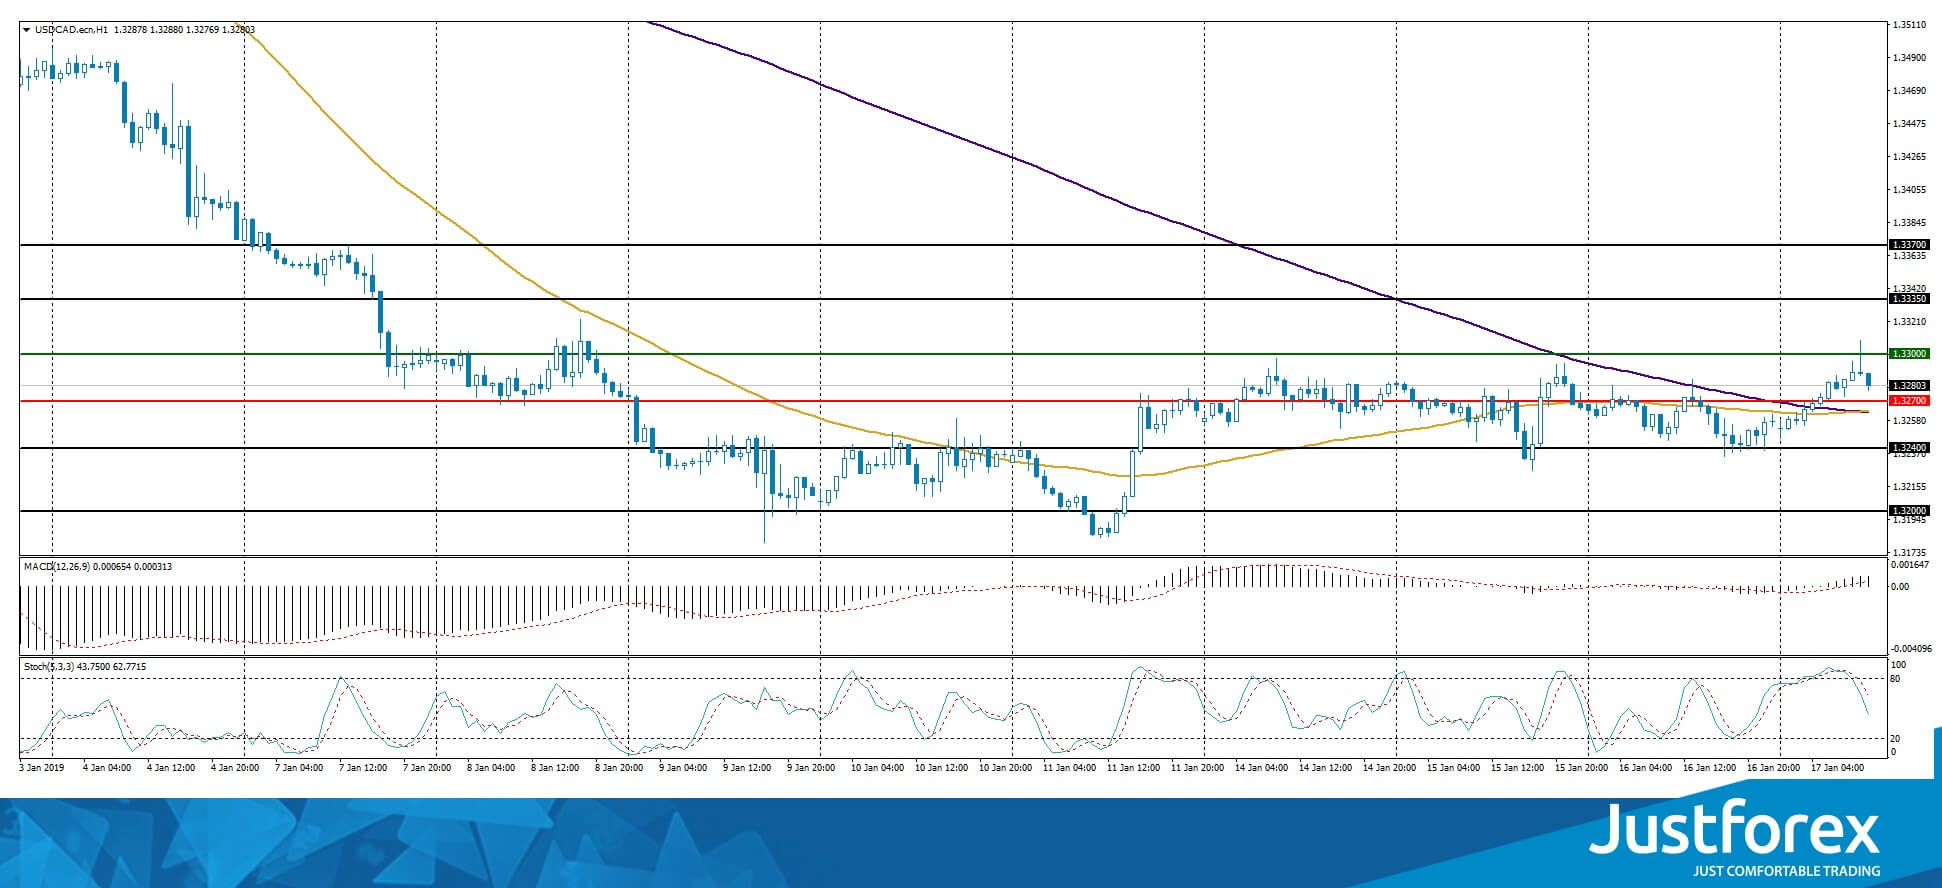
The indicators do not provide signals, 50 MA has crossed 200 MA.
The MACD histogram is in the positive zone, which points toward a bullish mood.
The Stochastic Oscillator is in the neutral zone, the %K line is below the %D line, which gives a signal to sell USD/CAD.
Trading recommendations
Support levels: 1.32700, 1.32400, 1.32000
Resistance levels: 1.33000, 1.33350, 1.33700
If the price fixes above 1.33000 consider buying USD/CAD. The movement will tend toward 1.33350-1.33500.
Alternatively the quotes can fall toward 1.32400-1.32200.
The USD/JPY currency pair
Technical indicators of the currency pair:
Prev Open: 108.653
Open: 109.102
% chg. over the last day: +0.35
Day's range: 108.763 – 108.843
52 wk range: 104.56 – 114.56
USD/JPY was in a bullish mood. The quotes grew by 60 points. However, it is in a bearish mood now, with the key levels being 108.700 and 109.000. The quotes have a tendency to descend further.
The Economic News Feed for 17.01.2019 is calm.
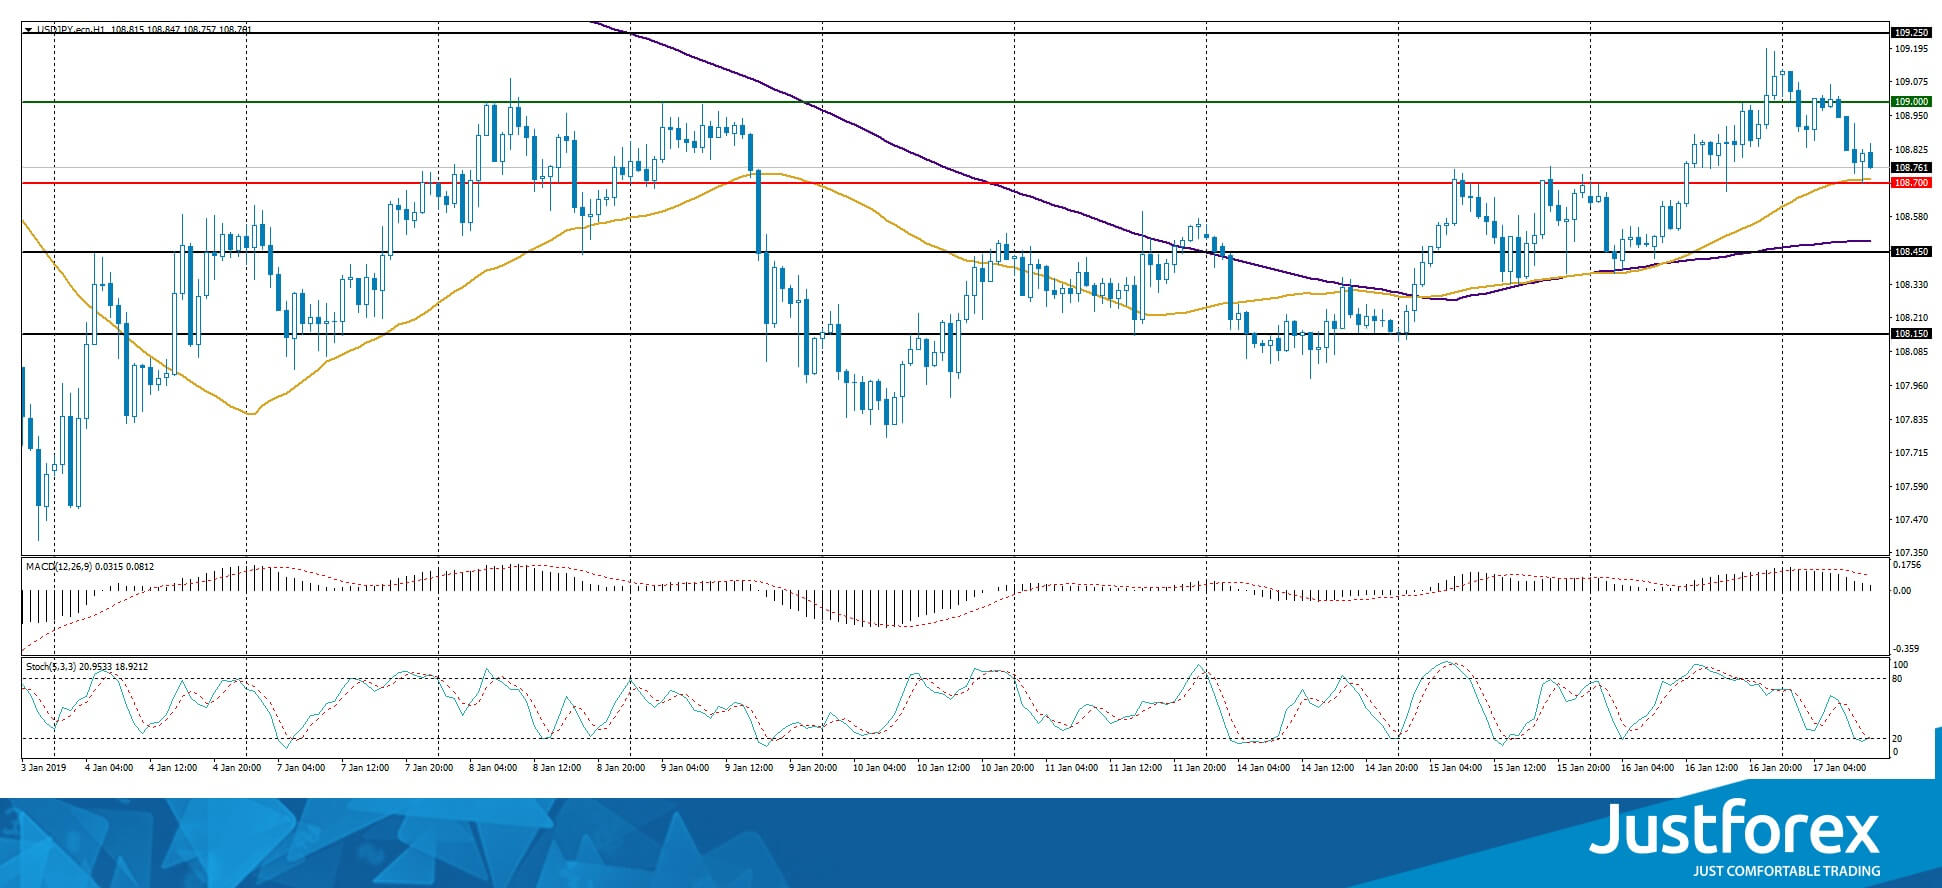
The price fixed above 50 MA and 200 MA which points towards the power of the buyers.
The MACD histogram is in the positive zone but below the signal line, which gives a weak signal to buy USD/JPY.
The Stochastic Oscillator is near the oversold zone, the %K line is crossing the %D line. There are no signals.
Trading recommendations
Support levels: 108.700, 108.450, 108.150
Resistance levels: 109.000, 109.250
If the price fixes below the mirror support 108.700 expect the quotes to fall further toward 108.450-108.200.
Alternatively the quotes can grow toward 109.250-109.500.
Theresa May Wins Confidence Vote In UK Parliament
Theresa May won the motion for a confidence vote yesterday, tabled by the Labour party by a margin of 19 votes securing for the time being her position. Attention now, turns to Theresa May's plan B and analysts expect the plan not to differ much if compared to her previous Brexit deal, in which case the UK parliament could reject it once again. The expectation for Theresa May seeking cross party backing for a new deal could provide reassurance, however we expect little from such efforts. Also expectations for a softer Brexit may have risen according to analysts, as the opposition seems to be seeking closer ties with the EU. We could see volatility being maintained for the pound and the currency to remain Brexit driven. Cable maintained a sideways motion yesterday, continuously testing the 1.2880 (R1) resistance line, unable to clearly break it. We maintain an outlook for a range bound movement today, however the pair could experience volatility, should there be any Brexit headlines, for example the EU being willing for some concessions, or hard Brexiteers delivering a preemptive strike on any plan B of Theresa May. Should the pair come under the market's selling interest we could see cable aiming if not breaking the 1.2795 (S1) support line. Should on the other hand the pair's long positions be favored by the market, we could see it breaking clearly the 1.2880 (R1) resistance line and aim if not break the 1.2960 (R2) resistance level.
USD remains steady after gains made
The USD remained steady yesterday against a number of its counterparts, after gains made in previous sessions especially against the EUR. Persistent worries about the Eurozone economy seem to weigh on EUR/USD and financial releases as well as ECB official's statements seem to strengthen arguments for a bearish market of the pair. Across the Atlantic, the US government shutdown seems to remain the main theme and may have started to take its toll on the economy, however analysts point out also that the Fed's rate hike cycle could be approaching its end and some even are mentioning possible rate cuts. Never the less, a possible rate cut this year, currently seems as a remote scenario in our view, for the time being. Please be advised, that in a recent report the Fed had indicated that US businesses have become less optimistic in recent months and we see the case for the conclusion to strengthen Fed's recent comments about “patience” on interest rate hikes. EUR/USD maintained a rather sideways movement yesterday, continuously testing and finally breaking during today's late Asian session, the 1.1387 (R1) support line (now turned to resistance). We maintain the view of a bearish market for the pair, as a downward trendline is forming since the 10th of January and consecutive lower peaks appear on the 11th and 15th of January. For our view to change, we would require the pair's price action to clearly break the prementioned downward trendline. Should the bears continue to dictate the pair's direction, we could see the pair breaking the 1.1350 (S1) support line and aim for lower grounds. Should on the other hand the bulls take over, we could see the pair breaking the 1.1387 (R1) resistance line and aim for the 1.1425 (R2) resistance barrier.
Today's other economic highlights
In today's European session, we get Eurozone's final HICP reading for December. In the American session, we get from the US, the number of building permits and housing starts for December, as well as the initial jobless claims figure. As for speakers, ECB's Sabine Lautenschlager, BoE's Governor Mark Carney and Sam Woods as well as Fed's Randal Quarles speak.
GBP/USD H4
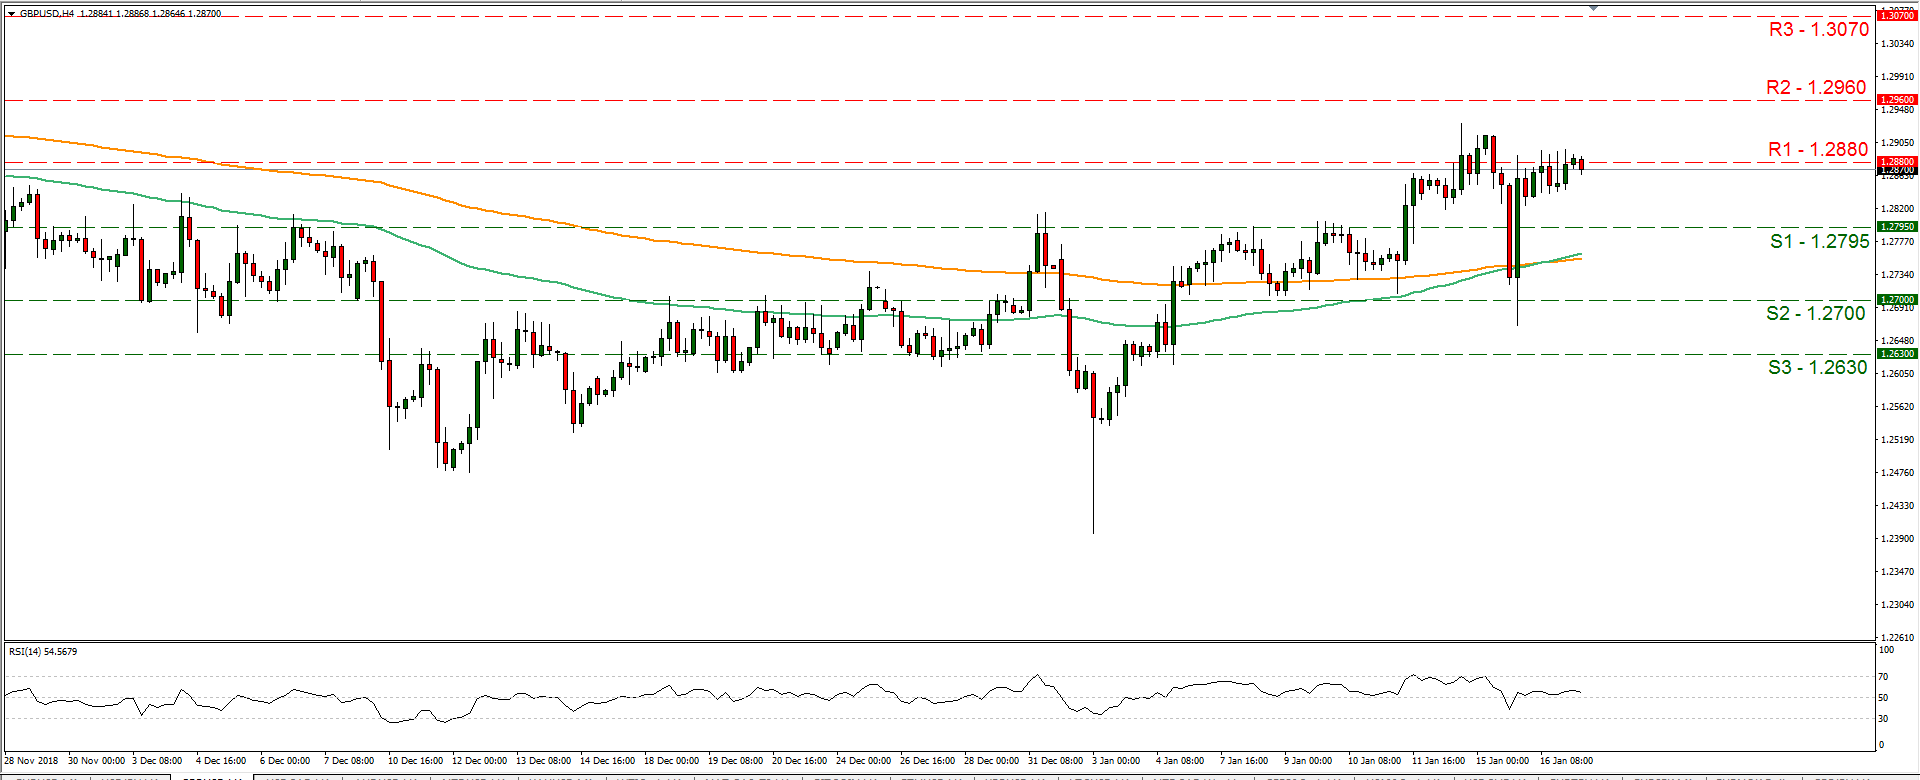
Support: 1.2795 (S1), 1.2700 (S2), 1.2630 (S3)
Resistance: 1.2880 (R1), 1.2960 (R2), 1.3070 (R3)
EUR/USD H4
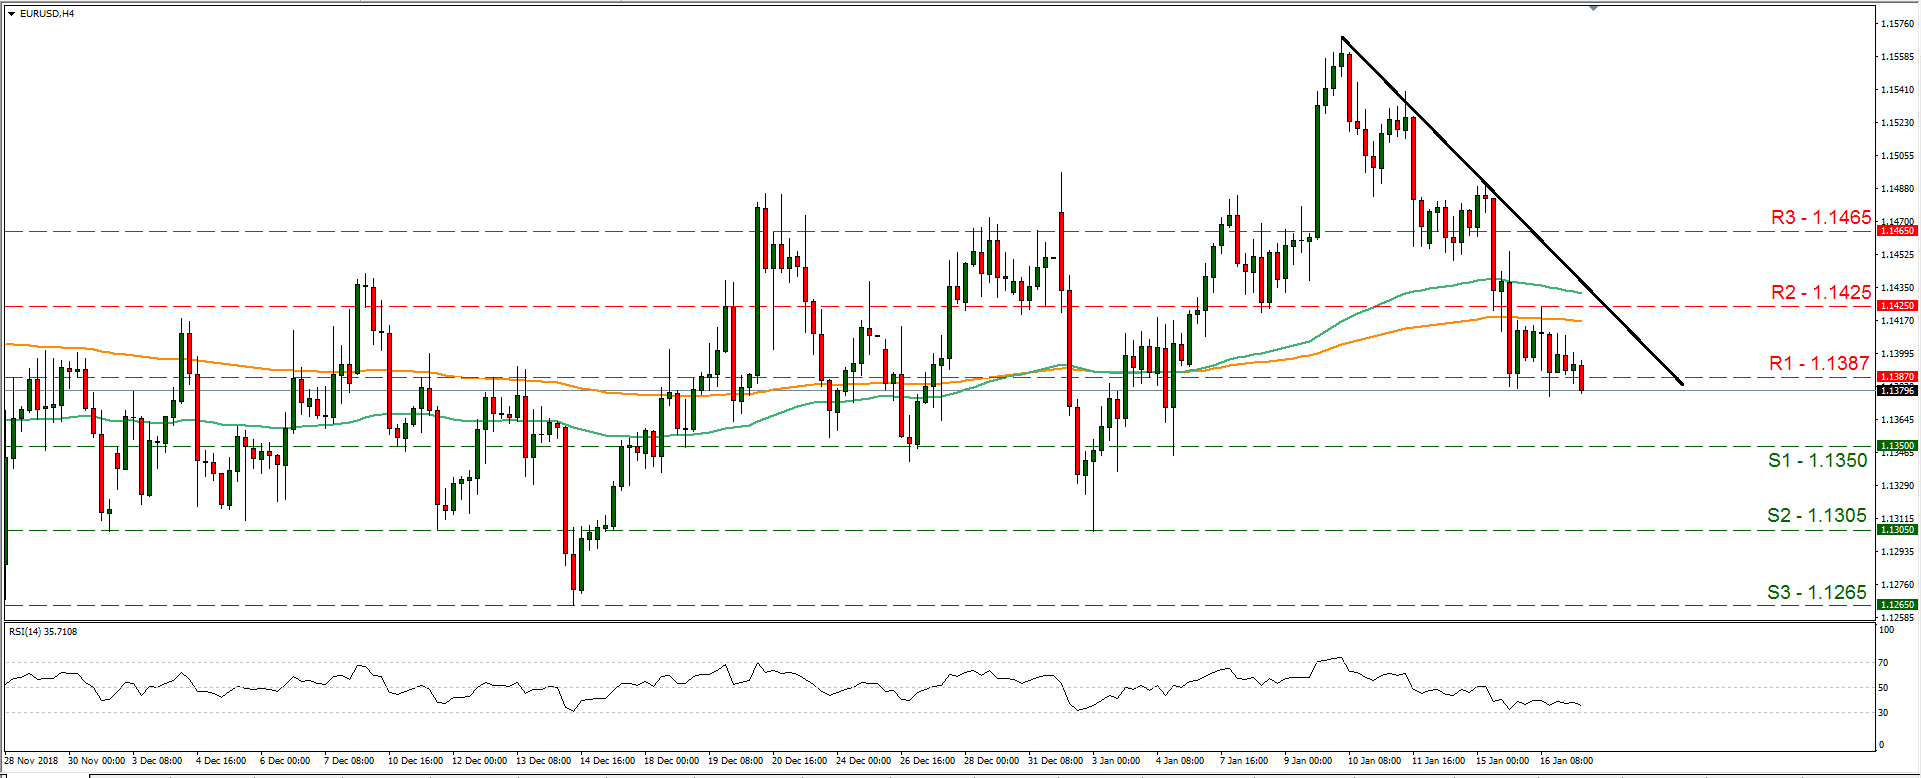
Support: 1.1350 (S1), 1.1305 (S2), 1.1265 (S3)
Resistance: 1.1387 (R1), 1.1425 (R2), 1.1465 (R3)
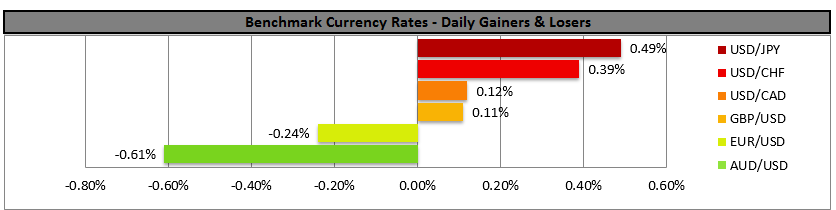
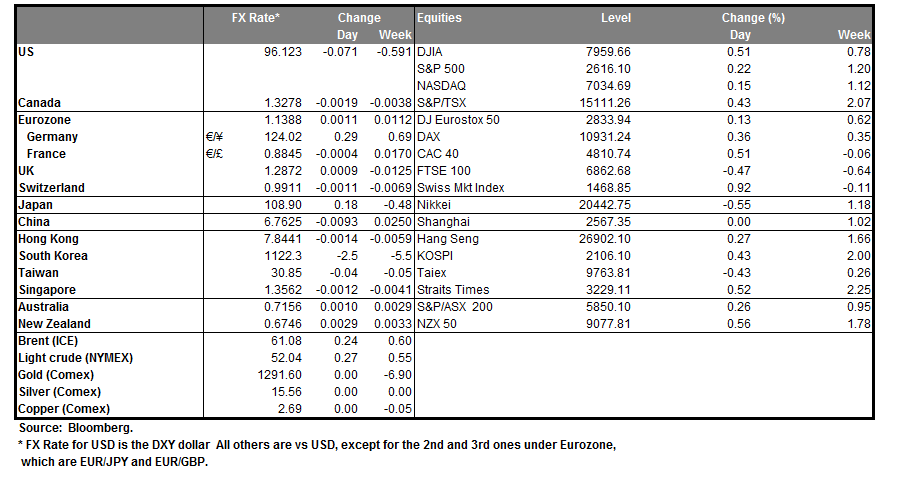
Forex Technical Analysis: EUR/USD, USD/JPY, GBP/USD
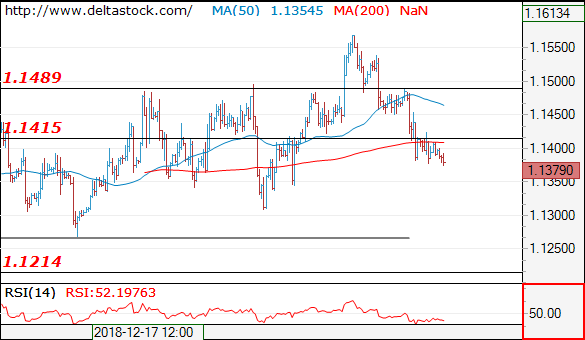
EUR/USD
Current level - 1.1379
The outlook remains bearish, for a slide towards 1.1310, en route to 1.1214 lows. Initial resistance lies at 1.1450.
| Resistance | Support | ||
| intraday | intraweek | intraday | intraweek |
| 1.1450 | 1.1630 | 1.1310 | 1.1214 |
| 1.1540 | 1.1820 | 1.1260 | 1.1100 |
USD/JPY
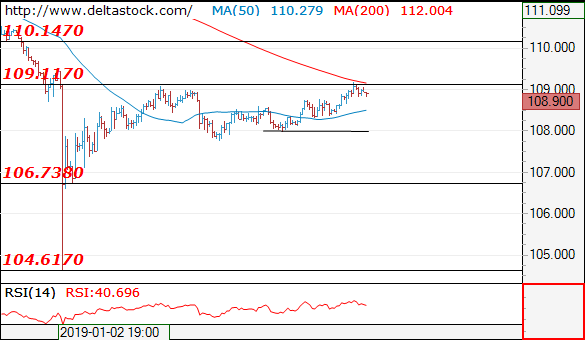
Current level - 108.90
The intraday bias is positive and a break through 109.20 will challenge 110.20 area. Crucial on the downside is 108.20 low.
| Resistance | Support | ||
| intraday | intraweek | intraday | intraweek |
| 109.10 | 111.45 | 108.20 | 106.70 |
| 109.10 | 112.20 | 106.70 | 104.60 |
GBP/USD
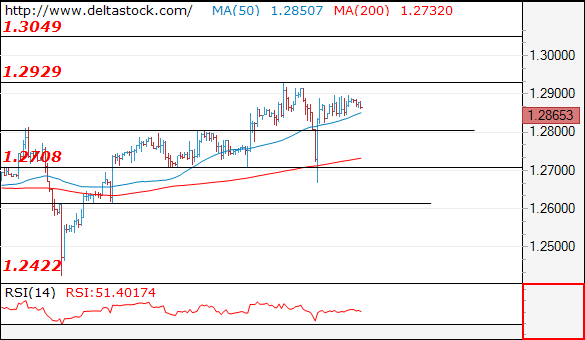
Current level - 1.2865
While 1.2930 peak holds, there will be a risk of another wave downwards, to 1.2800 and even 1.2710.
| Resistance | Support | ||
| intraday | intraweek | intraday | intraweek |
| 1.2930 | 1.3050 | 1.2800 | 1.2420 |
| 1.3050 | 1.3250 | 1.2710 | 1.2340 |
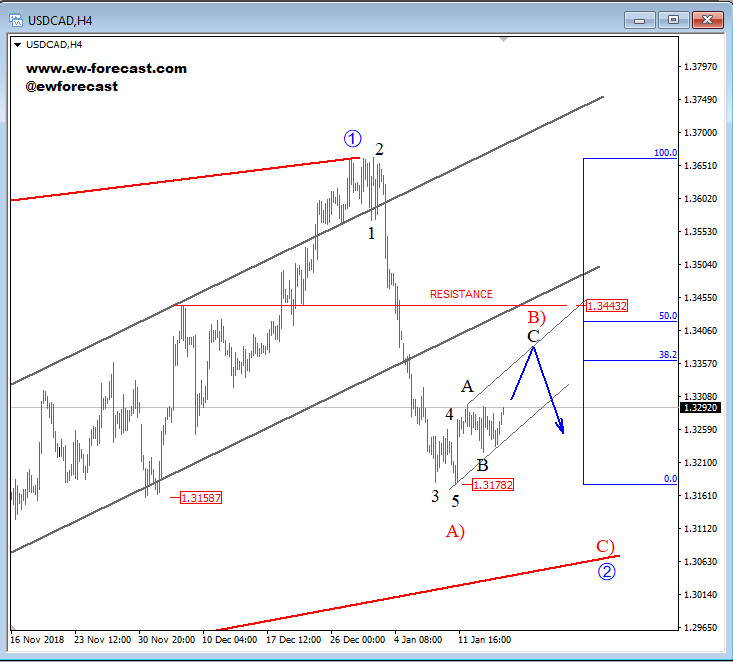
Weakness On USD/CAD Stopping For A Temporary Correction; Resistance Around 1.34/1.344
USDCAD made a sharp bearish reversal down from 1.366 level, an impulsive wave A) to be specific which looks to have found a base at the 1.318 level. A sharp recovery that followed from the lows can now be part of a temporary three-wave pullback labelled as wave B), which can retrace towards the 1.344 level(level of a former swing high) and there find resistance and make a reversal lower. Also, Fibonacci ratios of 38.2 and 50.0 can react as possible turning point zones for the pair.
USDCAD, 4h
AUD/USD Outlook: Firmer Direction Signals On Break Of 20SMA Or Daily Cloud Base
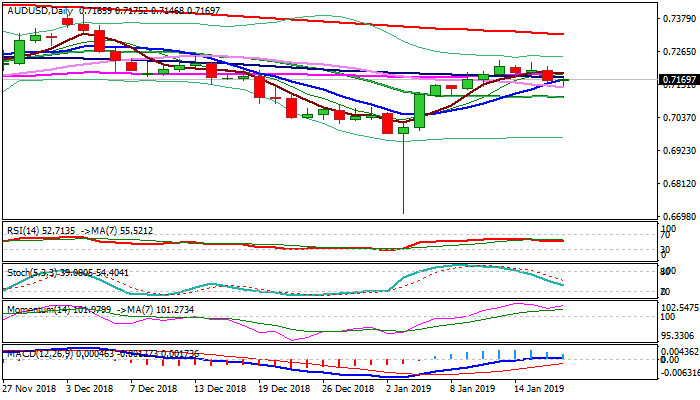
The Australian dollar holds in tight range on Thursday, following bearish close below near-term congestion floor / 100SMA support (0.7176) on Wednesday, as rising thick 4-hr cloud (0.6970/0.7178) limits dips and strongly underpins.
Near-term action is moving around converging 10/100SMA's and maintaining strong bullish momentum which prevents deeper pullback after repeated rejections at daily cloud base at 0.7207, as bulls peaked at 0.7235 but failed to register clear break above cloud base.
Daily techs are mixed and look for firmer direction signals which could be generated on extension below 20SMA at 0.7110 (bearish) of lift and close above daily cloud base / 0.7235 peak (bullish).
Res: 0.7175, 0.7207, 0.7235, 0.7282
Sup: 0.7140, 0.7110, 0.7033, 0.7000
USD/JPY Outlook: Strong Barrier At 109.15 Caps For Now And Keeps The Pair In Extended Sideways Mode
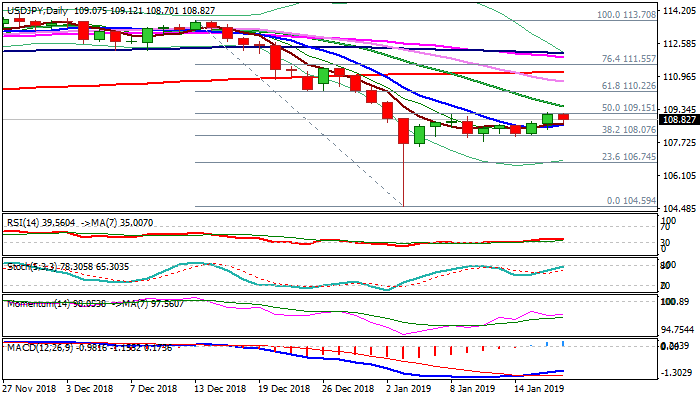
The pair stands at the back foot in early European trading following repeated failure at pivotal 109.15 barrier (daily Kijun-sen / 50% retracement of 113.70/104.59 descend).
Falling 20SMA (109.49) reinforces resistance as momentum and RSI are neutral on daily chart and so far offset positive signal on 1/10SMA bull-cross.
Break out of near-term range (109.15/107.76) is needed to generate fresh direction signal.
Bullish scenario on close above 109.15/49 pivots would expose targets at 110.00 (psychological) and 110.26 (Fibo 61.8% of 113.70/104.59).
Rising 10SMA marks initial support at 108.57, loss of which would weaken near-term structure, but sustained break below 107.76 would generate stronger bearish signal.
Res: 109.15, 109.49, 110.00, 110.26
Sup: 108.70, 108.57, 108.07, 107.76