Sample Category Title
Gold Hits New 6-Month High; Strongly Bullish in Near Term
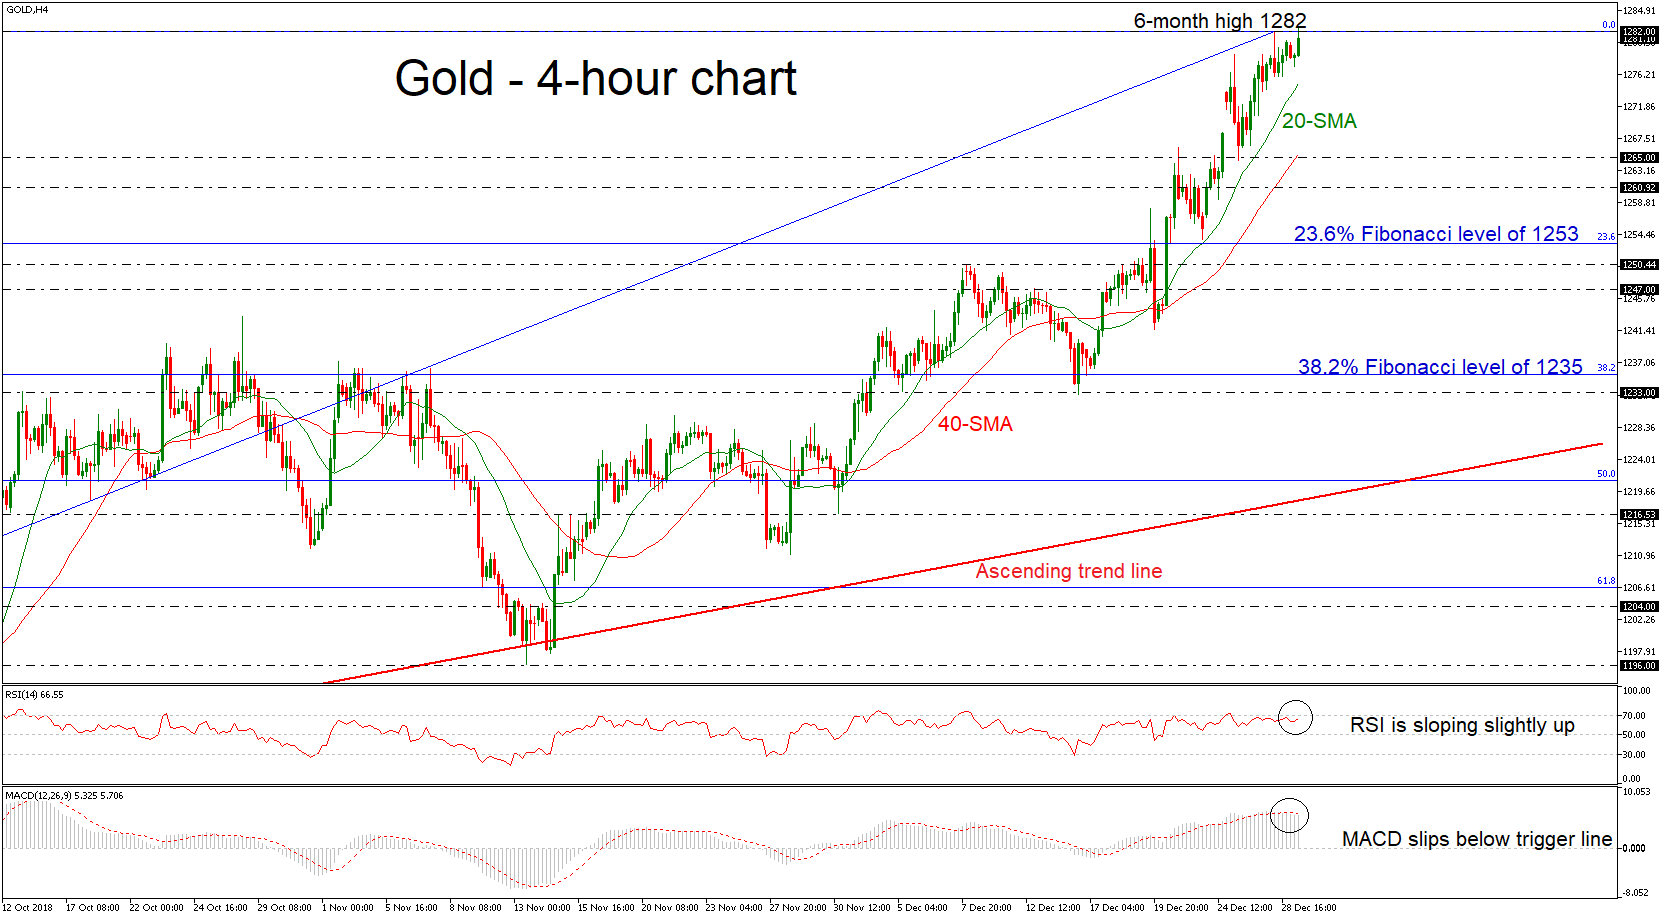
Gold has been in a flying mode over the last couple of days, touching a fresh six-month high of 1282 earlier today. The rally brought the price above the 20- and 40-simple moving averages (SMAs) in the 4-hour chart, endorsing the outlook to a strongly positive one.
From the technical point of view, the RSI indicator is moving slightly higher near the overbought zone, while the MACD oscillator dropped below the trigger line but remains well above the zero level, while a bearish correction is possible in the short term.
On the upside, the bulls will likely retry to pierce the 1282 high, with scope to hit a more restrictive area around 1290. Even higher, the highs on June 7 of 1303 could be the next resistance to have in mind. Also, if the price jumps above this peak it could challenge the 1309 hurdle, taken from the high on June 14.
Alternatively, if the price slips lower and start a bearish retracement, immediate support is coming from the 20-SMA around 1275. Should this fail to hold, subsequent declines could open the way for the 1265 support, which stands near the 40-SMA.
Overall, gold prices are still bullish in the short- and medium-term structure as they hold above the four-month ascending trend line.
XAUUSD Intraday Analysis
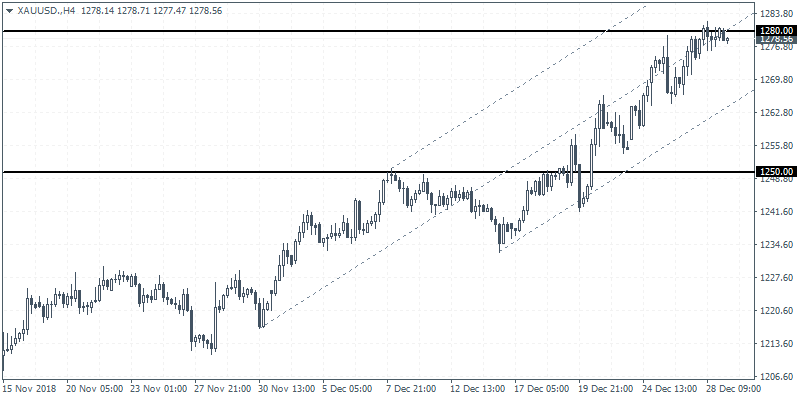
XAUUSD (1278.56): Gold prices maintained strong gains last week as price action settled near the 1280 handle as previously noted. With resistance being established here, gold prices are likely to remain consolidating around this level. Failure to breakout out above 1280 could keep gold prices biased to the downside. The downside target is seen at 1250 where support is yet to be established. This short-term correction could eventually pave way for gold prices to potentially breakout above 1280 handle. However, we expect that the precious metal could remain caught in the range for the near term.
AUDUSD Intraday Analysis
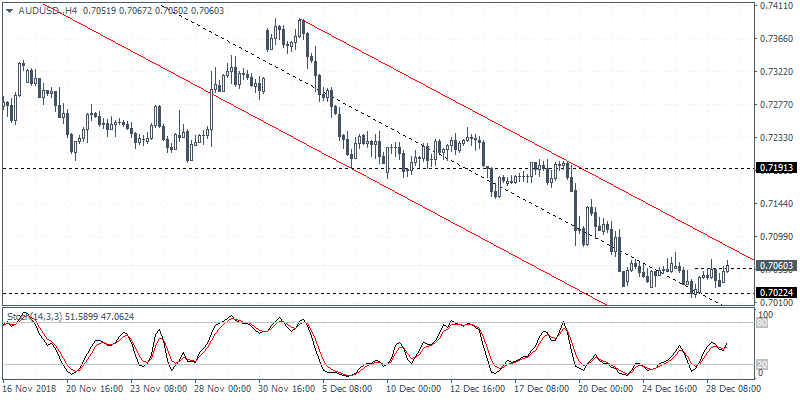
AUDUSD (0.7060): The Australian dollar was seen extending declines last week. Price action briefly hit the lows near 0.7022 before posting a modest rebound. However, failure to build upon the gains saw the Aussie closing bearish again by Friday’s close. With the Stochastics likely to indicate a bullish divergence, watch the AUDUSD for a potential double bottom pattern being formed near the lows. A bullish divergence with a retest of support near the 0.7000 level could potentially signal a short-term rebound in price action. The upside resistance at 0.7191 comes in at a key level of resistance.
EURUSD Intraday Analysis
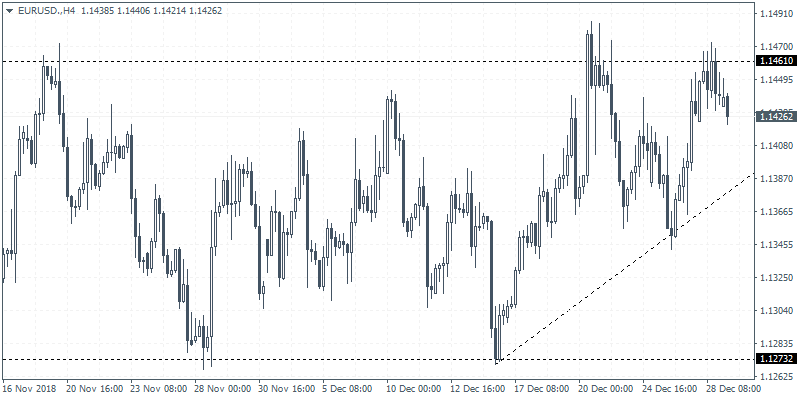
EURUSD (1.1426): The EURUSD currency pair has been trading flat with the resistance level of 1.1461 holding strong. Multiple retests to this level have failed to push prices higher. As a result, price action has consolidated into a potential ascending triangle pattern. If the resistance level breaks, the EURUSD could be on track to post gains toward the 1.1575 level which forms the minimum upside objective in price. Alternately, failure to break past the resistance level could lead to a downside breakout of the trend line. This could send the euro currency lower to retest the support at 1.1273 region.
Subdued Trading Expected amid Sparse Economic Data
The U.S. dollar was seen trading a bit weaker on Friday with the markets showing a mixed sentiment overall. The Japanese yen maintained its dominance as the currency continued to appreciate against the U.S. dollar. The sterling was also seen trading stronger on the day.
Economic data was sparse. The day started off with Tokyo core CPI rising at a slower pace of 0.9% but matched expectations. Core CPI was slower compared to the 1.0% increase the month before.
In the Eurozone, Germany’s inflation estimates showed a slower pace of increase of just 0.1% on the month. This was below estimates of a 0.3% increase and marked the same pace of increase as the month before.
Spain’s inflation estimates were also weaker, rising 1.2% on the year, down from 1.7% previously. The NY trading session saw Chicago PMI beating estimates to rise to 65.4. However, the activity was weaker compared to 66.4 previously. Pending home sales were down 0.7% on the month following a 2.6% decline previously.
The economic data for the day is relatively quiet. Earlier today, Australia’s private sector credit showed an increase of 0.3%. China’s manufacturing PMI for December was also released. The data showed that manufacturing activity eased to 49.3 in December while the non-manufacturing PMI was seen rising to 53.8.
EURUSD Fails to Jump above 1.1500 and Downtrend Line; Neutral in Short Term
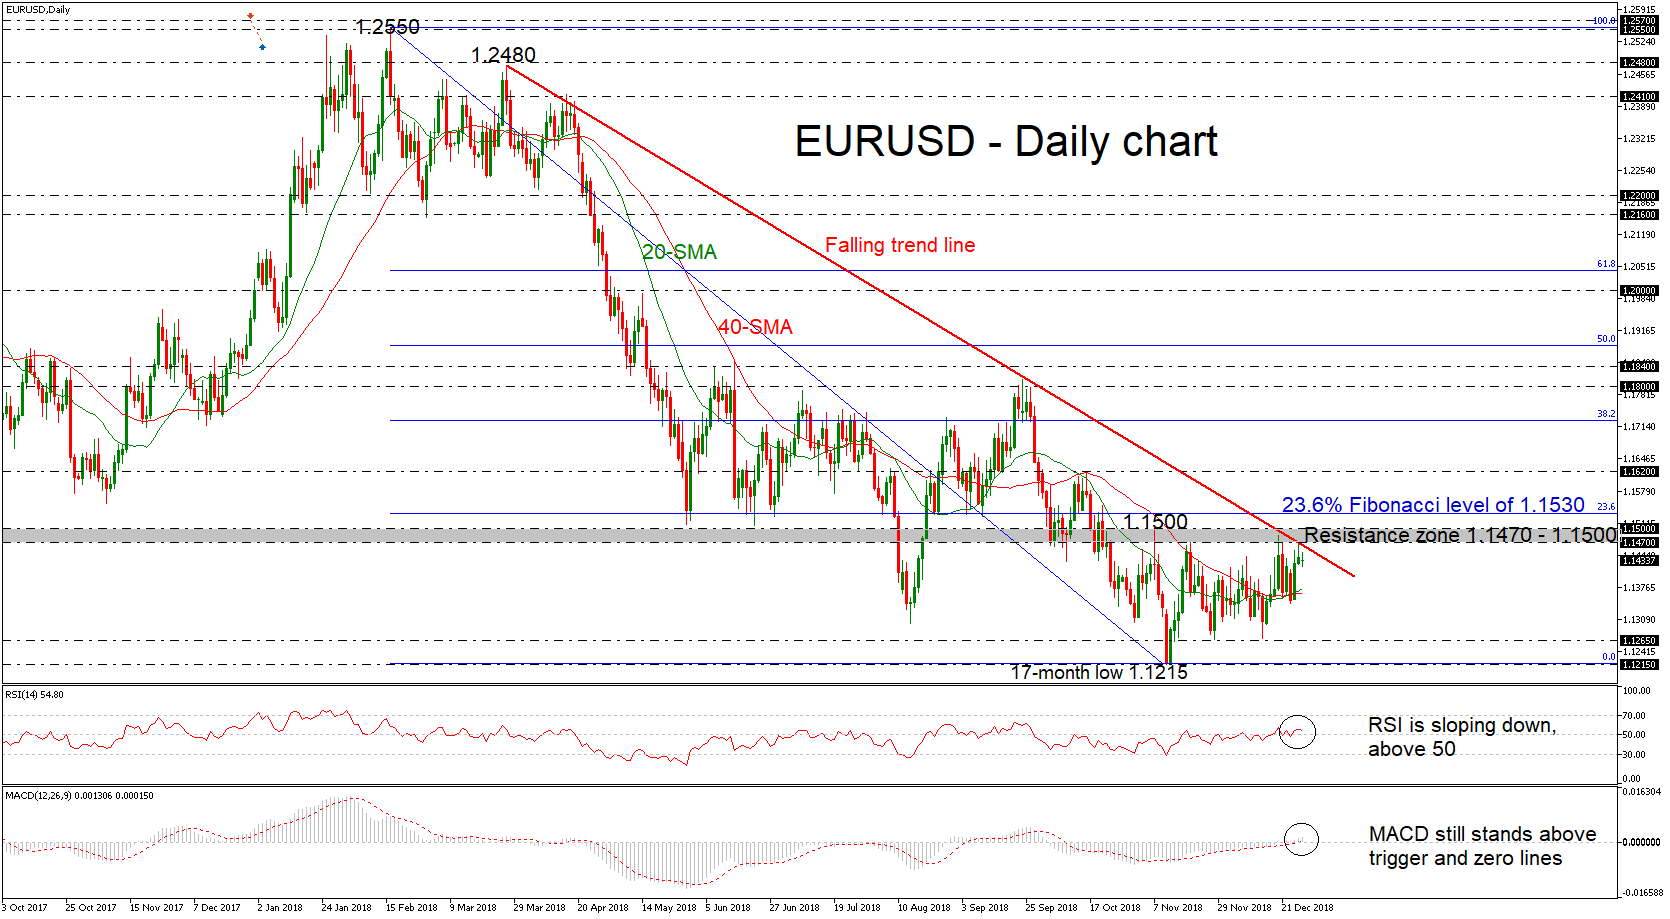
EURUSD has declined after touching the 1.1470 resistance level once again, which overlaps with the falling trend line in the daily timeframe. In the short-term, the pair seems to be in neutral mode over the last one-and-a-half months.
Momentum indicators in the short-term though are currently supporting that neutral momentum. Specifically, the RSI indicator is pointing downwards above 50, while the MACD oscillator continues to stand slightly above the trigger and zero lines, weakening its movement, signaling slightly bullish mode.
Should the pair experience negative pressure, it could challenge the 20- and 40-day simple moving averages (SMAs) around the 1.1370 barrier before the price heads sharply lower towards the 1.1265 support level. In case of steeper declines, the pair could breach this trough, diving to the 17-month low of 1.1215, which was reached on November 13.
On the other side, in case of a climb above the 1.1470 – 1.1500 resistance level and the downtrend line, the price could hit the 23.6% Fibonacci retracement level of the downleg from 1.2550 to 1.1215, around 1.1530. More advances could send prices towards the 1.1620 resistance, taken from the high on October 16.
Concluding, the bearish picture in the long-term looks to persist for a while longer as the price failed several times to jump above the key 1.1500 handle. The downward pattern started at the end of March and may not change unless the market manages to crawl substantially above the descending line.
GBP/USD and EUR/GBP Primed for More Gains
GBP/USD traded higher recently and tested the 1.2700 resistance. EUR/GBP remains in an uptrend above the key 0.9000 support area.
Important Takeaways for GBP/USD and EUR/GBP
- The British Pound recently tested the 1.2700 resistance and later corrected lower.
- There is a major breakout pattern formed with resistance at 1.2700 on the hourly chart of GBP/USD.
- EUR/GBP is following a nice uptrend above the 0.9000 support and a bullish trend line on the hourly chart.
- The pair needs to break the 0.9025 resistance to trade further higher in the near term.
GBP/USD Technical Analysis
The British Pound formed a decent support base near the 1.2600-1.2620 area against the US Dollar. The GBP/USD pair traded above the 1.2650 resistance area to move into a positive zone.
The pair tested the 1.2700 resistance and formed a high at 1.2707 on FXOpen. Later, the pair started consolidating gains below the 1.2700 level and declined below the 23.6% Fib retracement level of the last wave from the 1.2619 low to 1.2707 high.
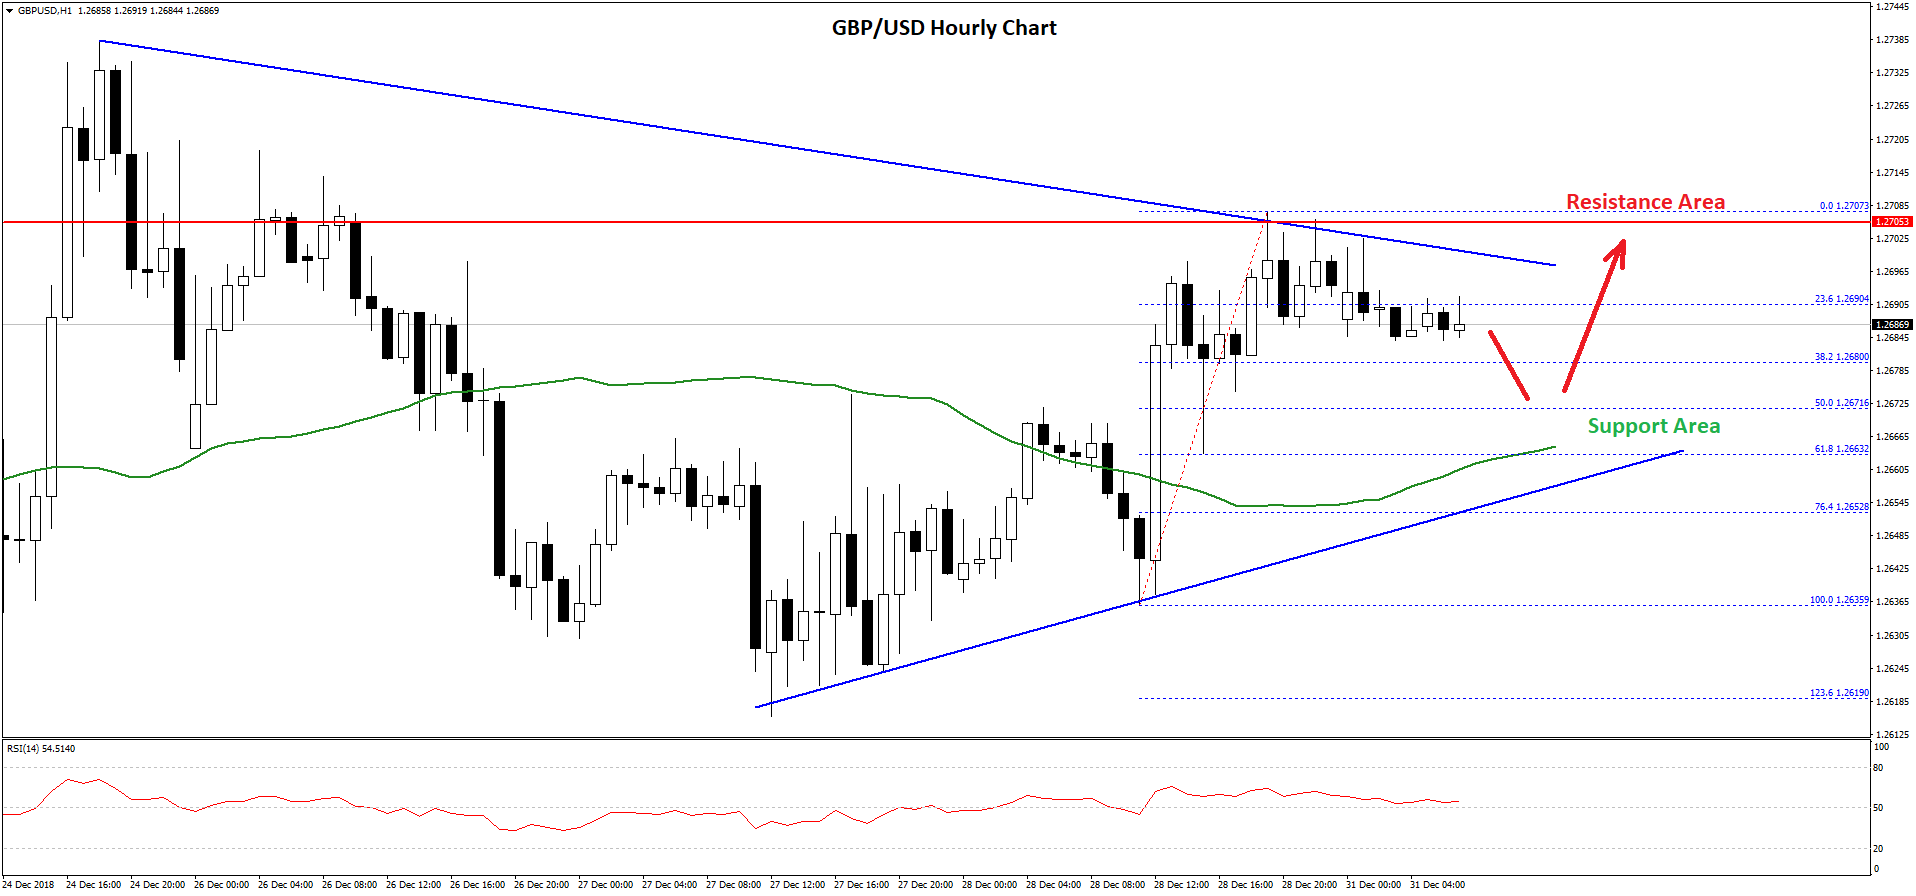
However, there are many supports on the downside near the 1.2670 level and the 50 hourly simple moving average. Besides, the 50% Fib retracement level of the last wave from the 1.2619 low to 1.2707 high is also near 1.2670.
More importantly, there is a major breakout pattern formed with resistance at 1.2700 on the hourly chart of GBP/USD. The pair may dip a few pips in the near term, but it is likely to find support near the 1.2670 or 1.2665 level.
On the upside, a break above the 1.2700 resistance area is needed for more gains. The next key resistance is near the 1.2740 and 1.2750 levels.
Overall, GBP/USD seems to be preparing for the next break either above 1.2700 or below 1.2650. As long as it is above the 1.2650 level, it is likely to clear the 1.2700 barrier in the near term.
EUR/GBP Technical Analysis
The Euro gained bullish momentum recently and cleared the 0.9000 and 0.9030 resistance levels against the British Pound. The EUR/GBP pair even broke the 0.9050 resistance area and traded towards the 0.9065 resistance.
A high was formed at 0.9059 and later the pair corrected lower below 0.9030 and the 50 hourly simple moving average. There was a break below the 50% Fib retracement level of the last wave from the 0.8974 low to 0.9059 high.
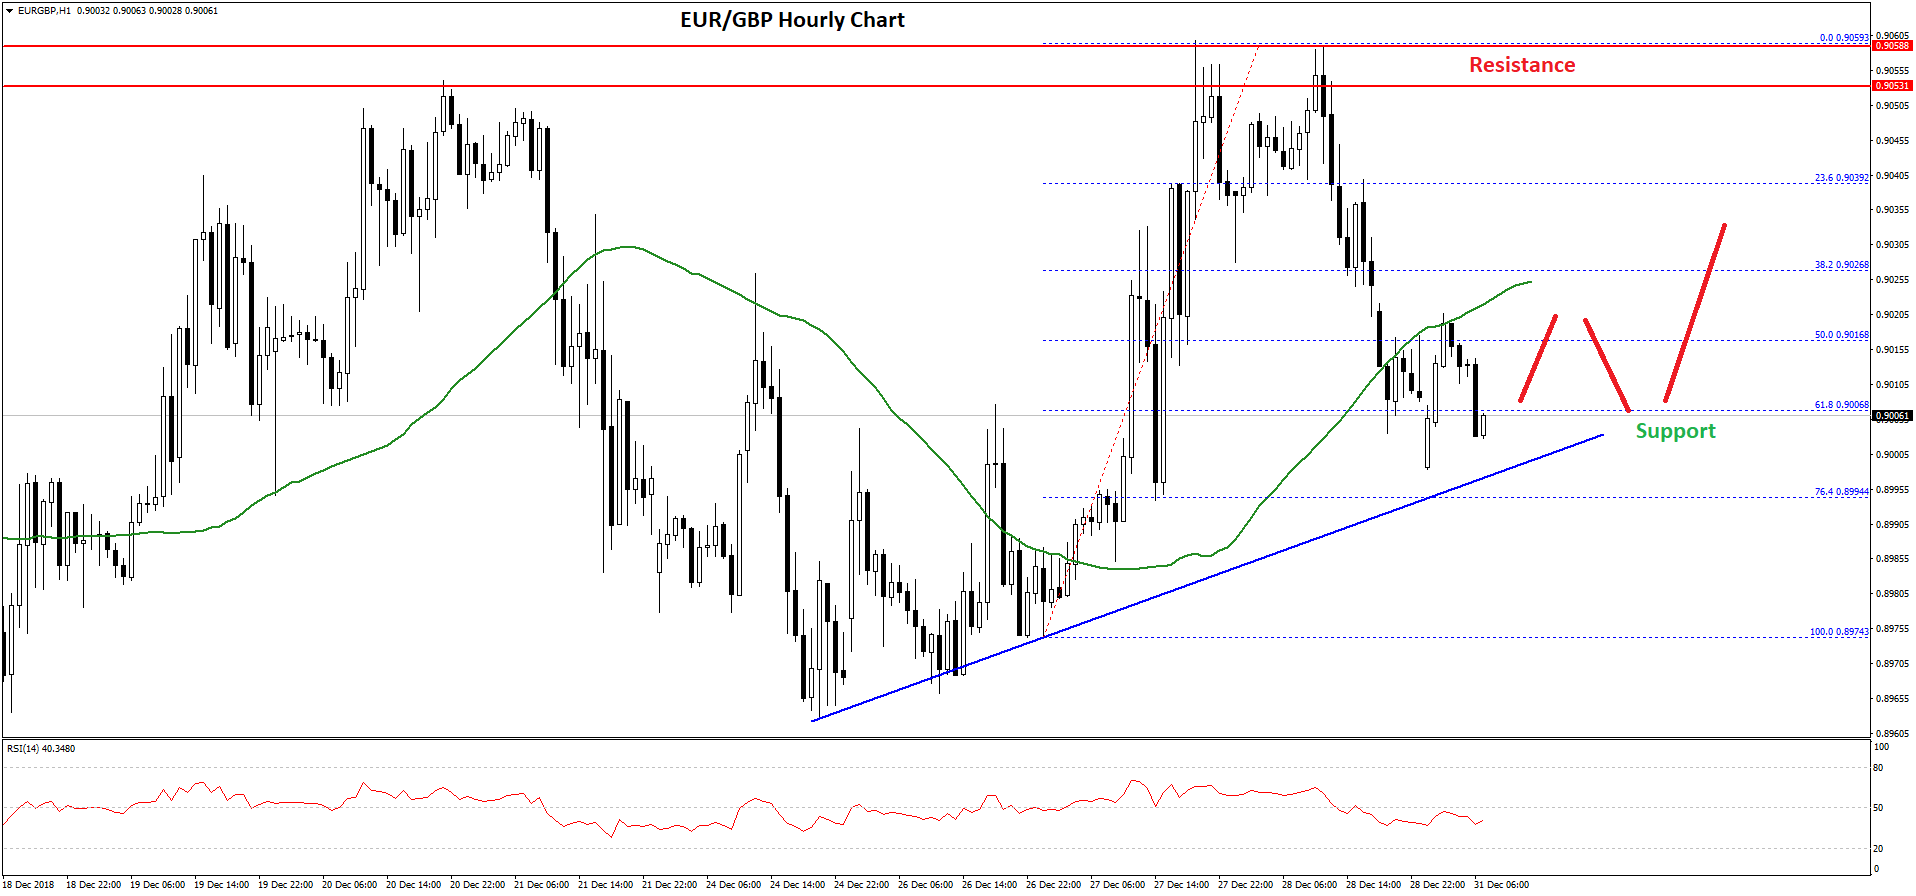
However, the pair tested the key 0.9000 support where buyers emerged. Besides, there is a solid bullish trend line formed with support at 0.9000 on the hourly chart.
Finally, the 61.8% Fib retracement level of the last wave from the 0.8974 low to 0.9059 high is also acting as a support. As long as the pair is above 0.9000, it is likely to bounce back above 0.9020 and 0.9030.
Above 0.9030, the pair may continue towards the 0.9050 and 0.9060 resistance levels. On the other hand, if there is a downside break below the 0.9000 support, EUR/GBP may decline sharply towards the 0.8975 support. The main support for buyers below 0.8975 is near the 0.8960, which is a crucial pivot zone.
USDJPY 110.80 Level Now Key Resistance
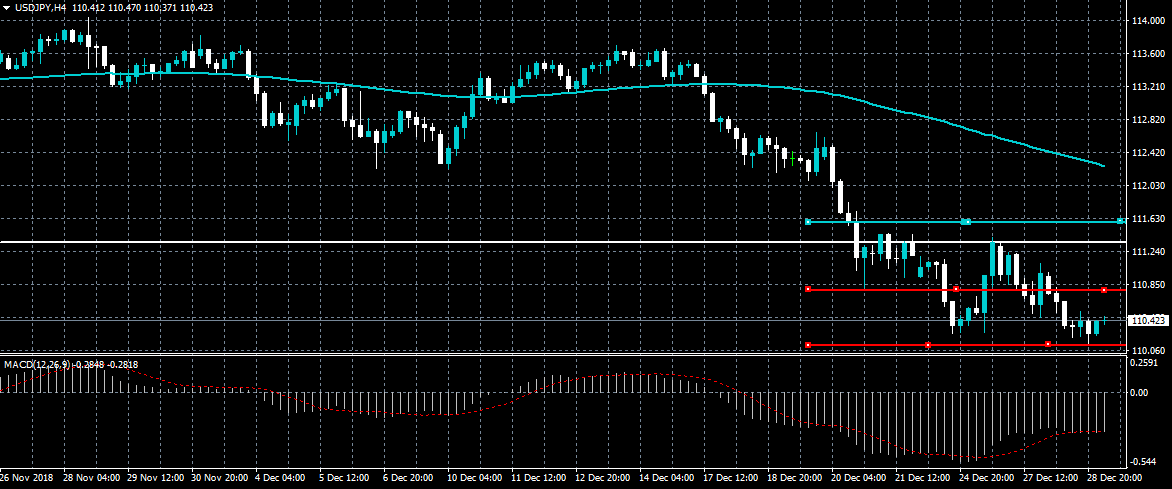
The US dollar is attempting to move higher against the Japanese yen in early Monday trade, following bullish comments from US President Donald Trump over Sino-US trade talks. The USDJPY pair may advance towards the 110.80 resistance level if the intraday recovery continues. Overall, the trend for the USDJPY pair remains bearish, with the 110.13 level now the key support level to watch.
- The USDJPY pair remains bearish while trading below the 110.80 level, key technical support is found at the 110.13 and 109.76 levels.
- If USDJPY pair trades above the 110.80 level, buyers may then test towards the 111.35 and 111.60 resistance levels.
EURUSD Losing Upside Momentum
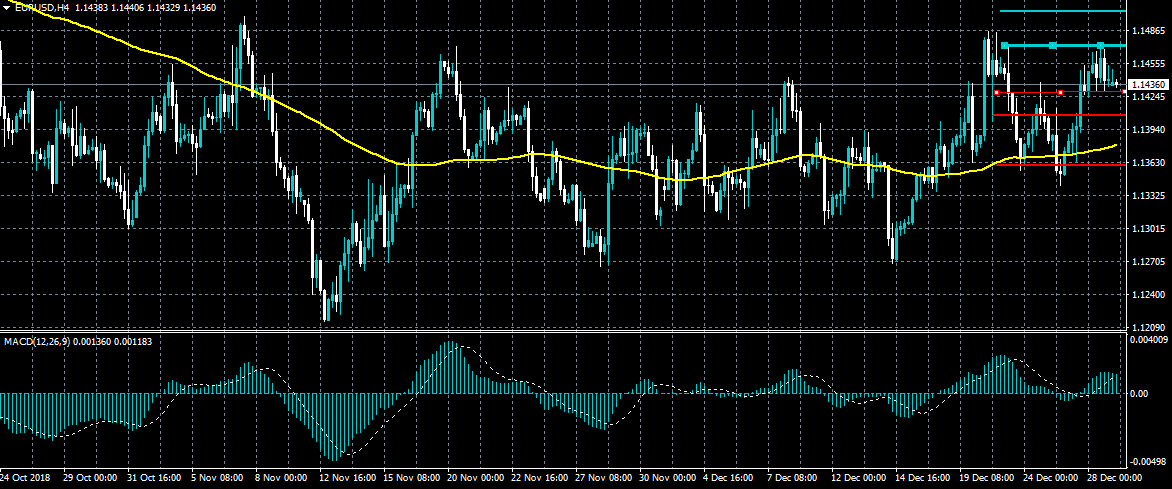
The euro is starting to lose upside momentum against the US dollar after the recent rally found strong selling interest from the 1.1472 resistance level. Price is now moving closer to the pivotal 1.1430 level, a clear break below this key level will likely prompt selling towards the 1.1400 level. The MACD indicator on the four-hour time frame is also showing that bullish momentum is fading.
- The EURUSD pair is only bearish while trading below the 1.1430 level, key technical support is found at 1.1400 and 1.1360 levels.
- If the EURUSD pair holds above the 1.1430 level, buyers may test towards the 1.1472 and 1.1500 levels.
BTCUSD Recovery Remains Weak
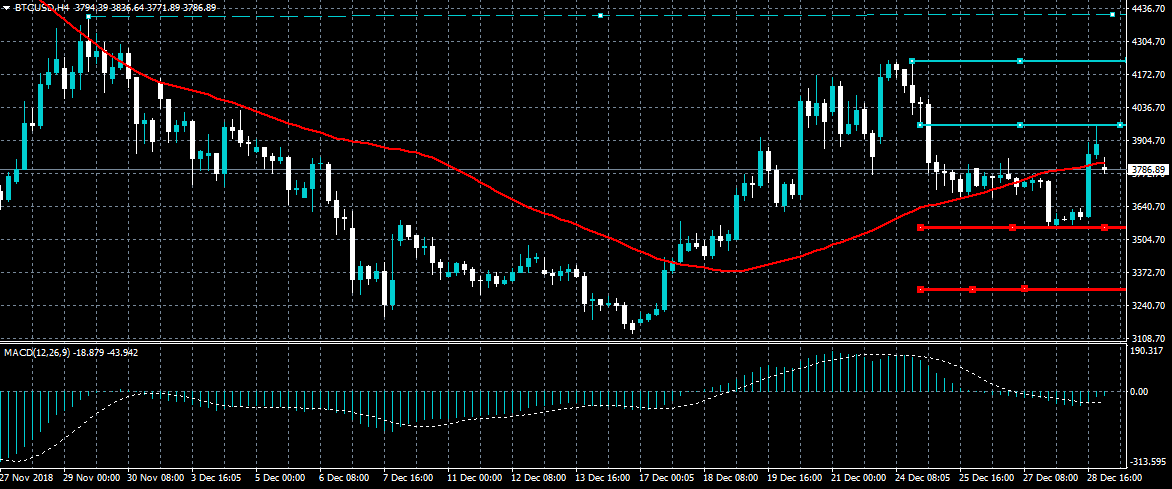
Bitcoin remains under downside pressure on Monday, following another failed attempt to surpass the important $4,200 resistance level. The BTCUSD pair has found short-term support just above the $3,550 level, although the price is still creating bearish lower highs. A sustained move below the $3,550 level is likely to trigger heavy technical selling in the BTCUSD pair towards the $3,300 support level.
- The BTCUSD pair is bearish while trading below the $4,200 level, key support is now found at the $3,550 and $3,300 levels.
- If the BTCUSD pair trades above the $4,200 level, buyers may test towards the $4,400 and $5,000 resistance levels.