Sample Category Title
USD/CAD Daily Outlook
Daily Pivots: (S1) 1.3406; (P) 1.3451; (R1) 1.3512; More...
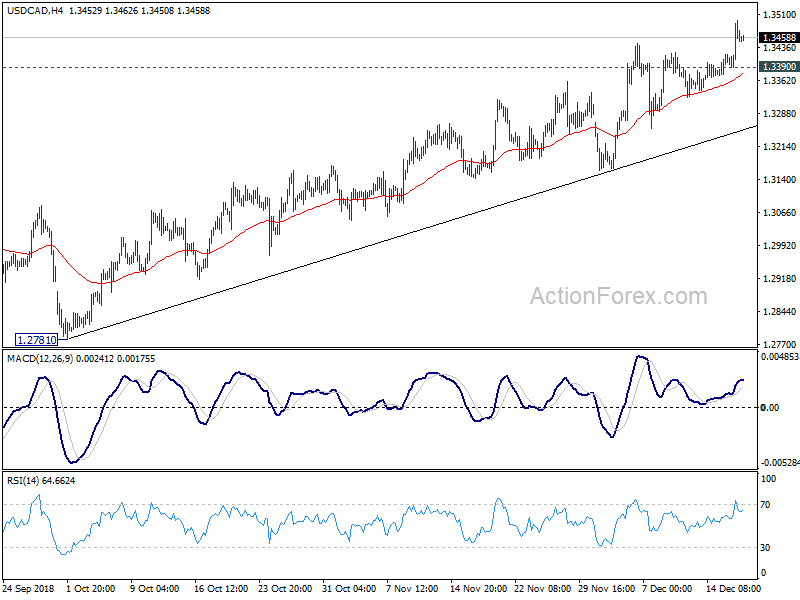
USD/CAD's rally resumed by breaking 1.3444 resistance and hits as high as 1.3496 so far. Intraday bias is back on the upside. Current rise is part of the up trend from 1.2061 and would target 1.3685 fibonacci level next. On the downside, below 1.3390 minor support will turn bias neutral and bring consolidations, before staging another rally.
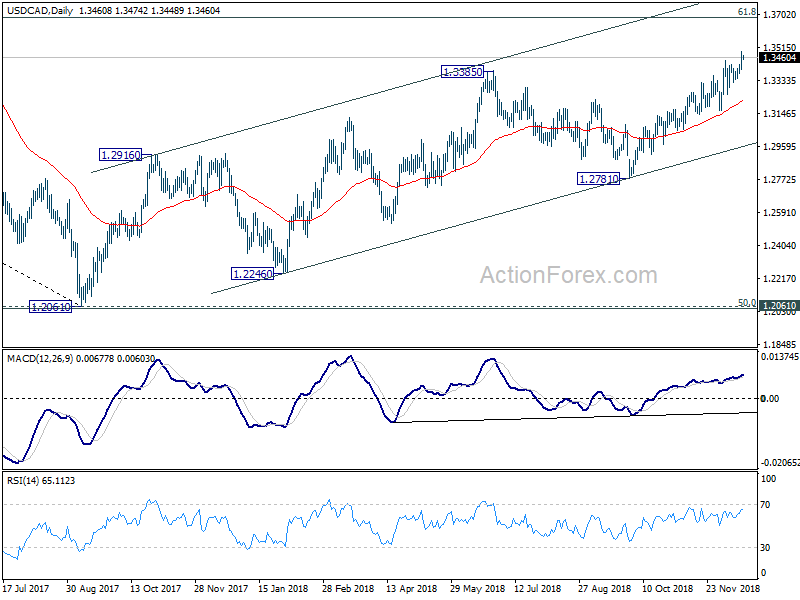
In the bigger picture, up trend from 1.2061 (2017 low) is still in progress and should target to 61.8% retracement of 1.4689 (2016 high) to 1.2061 at 1.3685. However, such rise is not clearly impulsive yet. And it could be the second leg of the long term corrective pattern that started at 1.4689. Hence, even in case of further rally, we'd be cautious on loss of momentum and topping above 1.3685. Nevertheless, in any case, outlook will stay bullish as long as channel support (now at 1.2972) holds.
USD/JPY Daily Outlook
Daily Pivots: (S1) 112.23; (P) 112.55; (R1) 112.85; More..
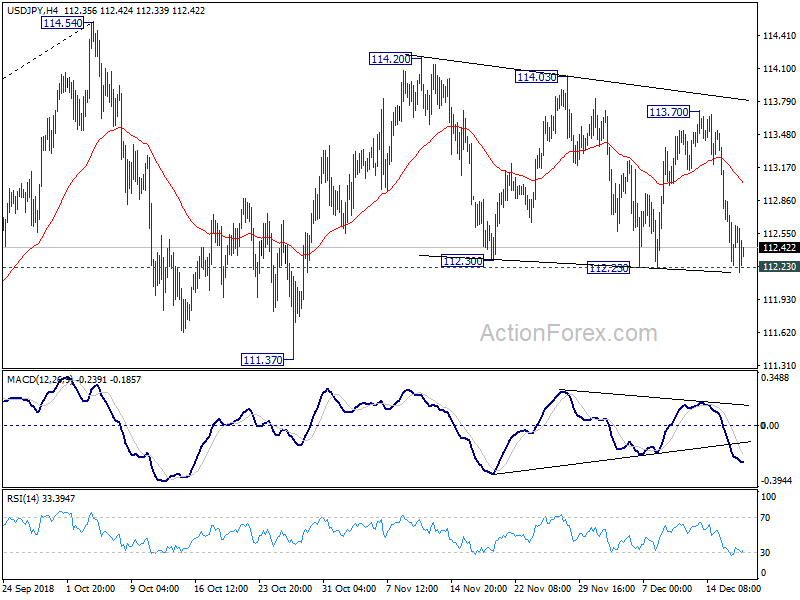
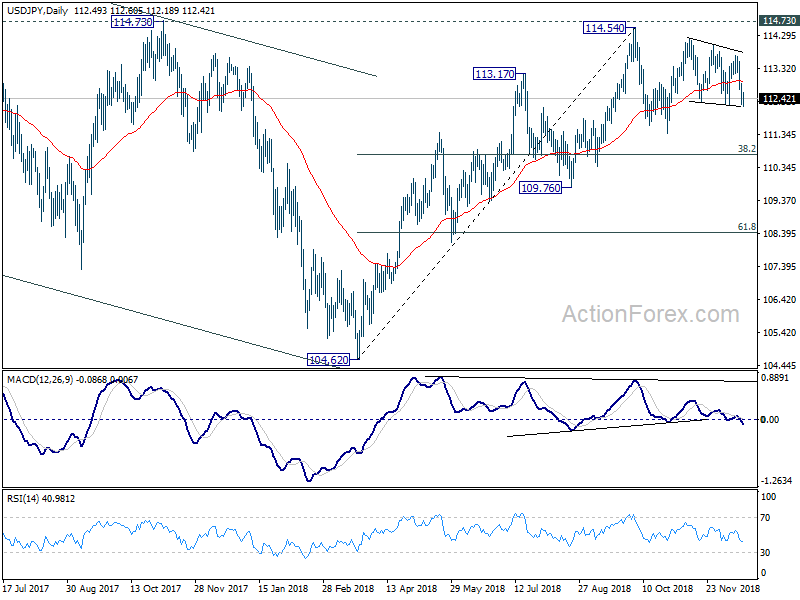
At this point, USD/JPY is holding above 112.23 support despite breaching it. Intraday bias stays neutral first. On the downside, break of 112.23 support will extend the corrective pattern from 114.54 with deeper decline to 111.37 and below. On the upside, above 113.70 will target 114.20 resistance first. Break there will resume the rise from 111.37 and target 114.73 key resistance next. Overall, price actions 114.54 are seen as a consolidative pattern. In case of deeper fall, downside should be contained by 38.2% retracement of 104.62 to 114.54 at 110.75 to bring rebound. Larger rise from 104.62 is expected to resume later.
In the bigger picture, corrective fall from 118.65 (2016 high) should have completed with three waves down to 104.62. Decisive break of 114.73 resistance will likely resume whole rally from 98.97 (2016 low) to 100% projection of 98.97 to 118.65 from 104.62 at 124.30, which is reasonably close to 125.85 (2015 high). This will stay as the preferred case as long as 109.76 support holds. However, decisive break of 109.76 will dampen this bullish view and turns outlook mixed again.
USD/CHF Daily Outlook
Daily Pivots: (S1) 0.9903; (P) 0.9925; (R1) 0.9951; More...
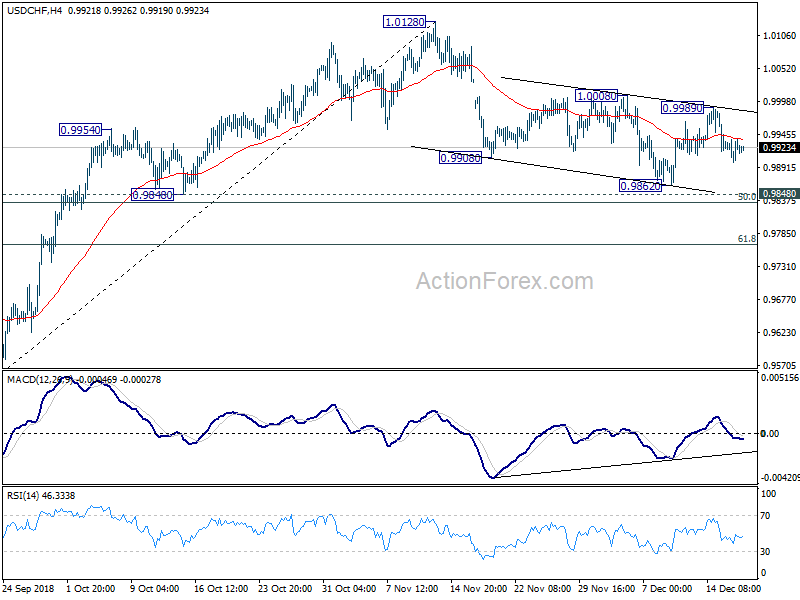
Intraday bias in USD/CHF remains mildly on the downside at this point. Correction from 1.0128 is possibly extending. But downside should be contained by 0.9848 support to bring near term reversal. On the upside, above 0.9989 will turn bias back to the upside. Break of 1.0008 will target a test on 1.0128 high.
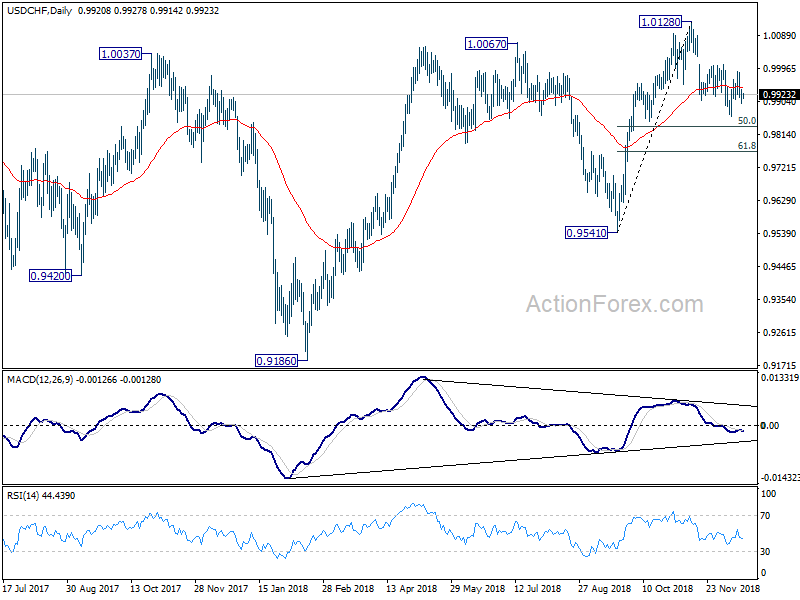
In the bigger picture, current development suggests that the medium term rally from 0.9186 hasn't completed yet. Break of 1.0128 will target 1.0342 key resistance next (2016 high). On the downside, break of 0.9848 support will dampen this bullish view and turn focus back to 0.9541 key support instead.
GBP/USD Daily Outlook
Daily Pivots: (S1) 1.2574; (P) 1.2611; (R1) 1.2650; More...
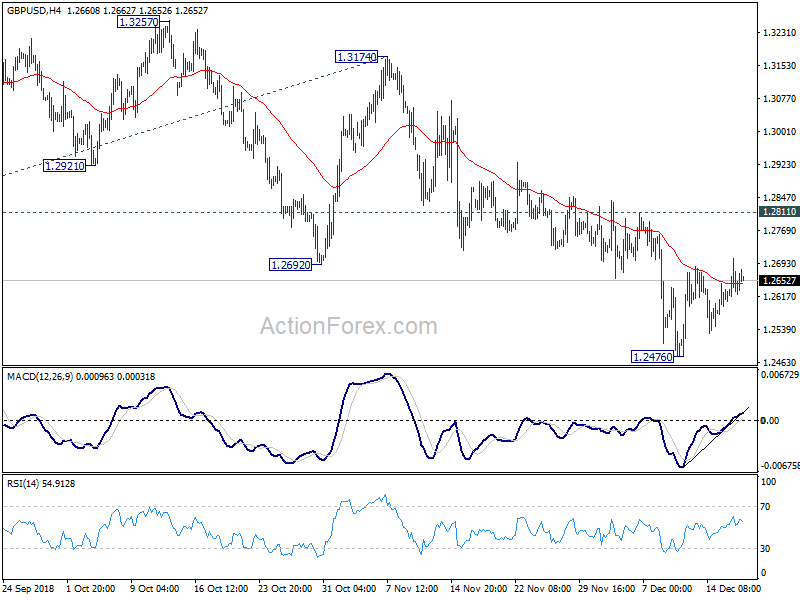
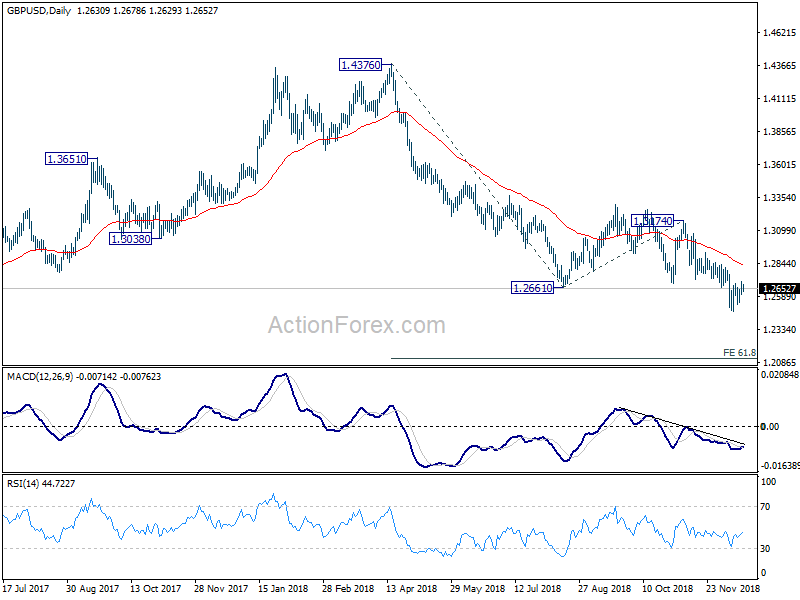
GBP/USD is staying in consolidation from 1.2476 and intraday bias remains neutral at this point. Stronger rise cannot be ruled out, but upside should be limited by 1.2811 resistance to bring fall resumption. On the downside, break of 1.2476 will extend larger down trend from 1.4376 to 61.8% projection of 1.4376 to 1.2661 from 1.3174 at 1.2114. However, firm break of 1.2811 will be an early signal of trend reversal and turn focus back to 1.3174 resistance.
In the bigger picture, whole medium term rebound from 1.1946 (2016 low) should have completed at 1.4376 already, after rejection from 55 month EMA. The structure and momentum of the fall from 1.4376 argues that it's resuming long term down trend from 2.1161 (2007 high). And this will now remain the preferred case as long as 1.3174 structural resistance holds. GBP/USD should now target a test on 1.1946 first. Decisive break there will confirm our bearish view.
EUR/USD Eyeing Upside Break While USD/JPY Downside
EUR/USD recovered recently and traded above the 1.1350 resistance to move into a positive zone. USD/JPY declined heavily and it seems like it could break the 112.25 support.
Important Takeaways for EUR/USD and USD/JPY
- The Euro corrected higher recently and traded above the 1.1300 and 1.1350 levels.
- There was a break above a key bearish trend line with resistance at 1.1352 on the hourly chart of EUR/USD.
- USD/JPY declined heavily and broke the 113.20 and 113.00 support levels.
- There is a bearish trend line formed with resistance at 112.45 on the hourly chart.
EUR/USD Technical Analysis
The Euro declined below the 1.1300 support level this past week against the US Dollar. The EUR/USD pair even broke the 1.1280 support zone before buyers appeared near the 1.1265 level.
The pair traded as low as 1.1269 on FXOpen and later started a decent upside correction. It climbed above the 1.1300 resistance area and settled above the 50 hourly simple moving average. Besides, there was a break above the 61.8% Fib retracement level of the last decline from the 1.1392 high to 1.1269 low.
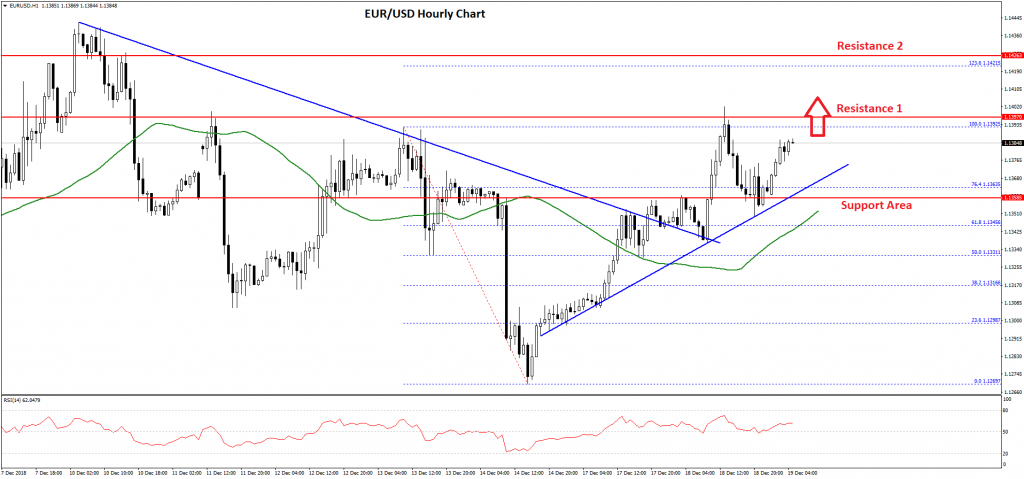
Moreover, there was a break above a key bearish trend line with resistance at 1.1352 on the hourly chart. The pair is now trading just below the last swing high of 1.1392. Therefore, there are chances of more gains above 1.1390 and 1.1400 in the near term.
Above 1.1400, the pair could test the 1.236 Fib extension level of the last decline from the 1.1392 high to 1.1269 low at 1.1421.
On the downside, there is a connecting bullish trend line formed with support at 1.1370, below which there is a solid support near the 1.1355 level (the previous resistance). Overall, the pair remains in an uptrend and it could accelerate above 1.1400 in the near term.
USD/JPY Technical Analysis
The US Dollar failed to trade close the 114.00 resistance area this past week against the Japanese Yen. The USD/JPY pair traded near the 113.70-113.75 area where sellers emerged.
Later, there was a downside break and the pair broke the 113.50 support and the 50 hourly simple moving average. Moreover, there was a break below an ascending channel with support at 113.35 on the hourly chart.
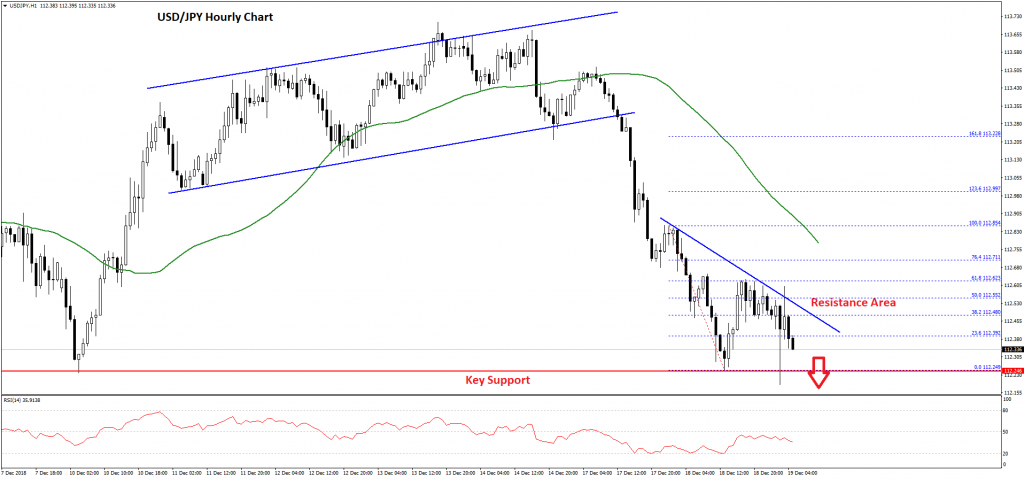
It opened the doors for more losses and the pair declined below the 113.20 and 113.00 support levels. It even broke the 112.50 support and tested the crucial 112.25 support area. Later, there was a correction above the 112.45 level and the 50% Fib retracement level of the recent decline from the 112.85 high to 112.24 low.
However, the upside move was capped by the 112.60 resistance and the 61.8% Fib retracement level of the recent decline from the 112.85 high to 112.24 low. There is also a bearish trend line formed with resistance at 112.45 on the hourly chart.
Therefore, there is a risk of more losses below the 112.25 support level in the near term. The next key support is at 112.00, below which USD/JPY ma even test the 111.60 support. On the upside, an initial resistance is near 112.45, above which the pair must surpass the 112.85 plus the 50 SMA to move into a positive zone.
OIL Elliott Wave Analysis: Calling For More Weakness
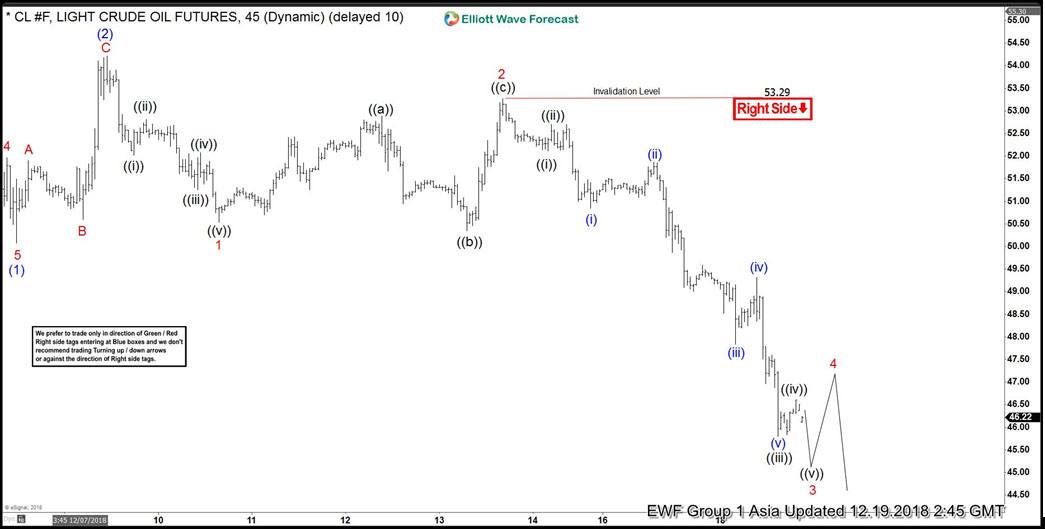
OIL Elliott wave analysis suggests that a decline from October 3, 2018 peak ($76.9) is unfolding as impulse Elliott wave structure. Down from $76.9 peak, the primary wave ((1)) ended at $68.47 low. A primary wave ((2)) bounce ended at $69.65 high. Then a decline to $54.75 low ended primary wave ((3)). Primary wave ((4)) bounce ended at $57.98 high. Oil is currently in the final leg Primary wave ((5)) lower, which also looks to be unfolding as impulsive structure.
Down from $57.98 high, the initial decline to $50.08 low ended intermediate wave (1) in 5 waves. Above from there, a 3 wave bounce to $54.22 high ended intermediate wave (2) as zigzag structure. Below from there, intermediate wave (3) remain in progress in another 5 waves structure where Minor wave 1 ended in 5 waves at $50.53 low. A bounce to $53.29 high ended Minor wave 2 as a Flat correction.
Currently, Minor wave 3 remain in progress looking to extend lower 1 more time at least towards $45.57-$45.24 inverse 123.6%-161.8% Fibonacci extension area of lesser degree Minute wave ((iv)). Afterward, OIL is expected to do a bounce in Minor wave 4 in 3, 7 or 11 swings against $53.29 peak before further downside is seen. We expect bounces to get failed against $53.29 peak in 3, 7 or 11 swings for more downside.
OIL 1 Hour Elliott Wave Chart
The Oil Price Dropped Substantially
Market movers today
All eyes will be on the FOMC meeting tonight . It hasn't become less exciting after the recent market rout and US President Donald Trump's frequent expressions of clear dissatisfaction with the rate hikes. Despite the recent decline in US stocks a rate hike is widely expected. Focus will instead be on the Fed's projections (the dot plot) for 2019 and the language in the statement. The market is currently priced for less than one hike next year, and even if the Fed softens the rate path and the language, we believe they will be perceived as hawkish compared to market pricing. See also FOMC Preview - Fed set to hike again but removing more forward guidance , 14 December 2018.
In the UK inflation for November is expected to decline slightly from 2.4% to 2.3% (consensus). On core inflation consensus is a decline to 1.8% y/y from 1.9% y/y in October.
Sweden releases confidence indicators for both consumers and businesses, see page 2.
The Bank of Japan ends its two-day monetary policy meeting early Thursday morning European time. We expect the Bank of Japan to keep its 'QQE with yields curve control' policy unchanged.
Selected market news
US stock markets stabilised yesterday and closed with minor gains after past days' sell-offs. Trading is mixed in Asia this morning as investors await the FOMC tonight.
The oil price dropped substantially yesterday and Brent oil touched USD 56/bbl for the first time since October 2017. The decline in the oil price appears to be driven by a combination of supply and growth concerns. The latter clearly also represents a supporting factor for the rally in global fixed income markets where the 10-year US Treasury yield declined 4bp yesterday to the lowest close since May at 2.807%, while the 10-year Japanese government bond yield has dropped to around 0.01% this morning.
The Italian government has made a deal with the EU Commission on the budget for 2019 . The new budget reduces the deficit to 2.04% and according to Italian officials there has been a technical agreement on the budget. We still need an official statement from the EU Commission, but that should come today. This leaves room for more convergence between Italy and the core-EU markets.
US Treasury Secretary Steven Mnuchin last night said that the US and China are planning to hold trade talks in January in order to try to make an agreement before the current tariff truce runs out on 1 March next year. We continue to look for a deal between the US and China within next 3-6 months. See China Weekly Letter - Improvement in Trade War, deterioration in Tech War (14 December).
Euro Extends Its Gains In The Asian Session
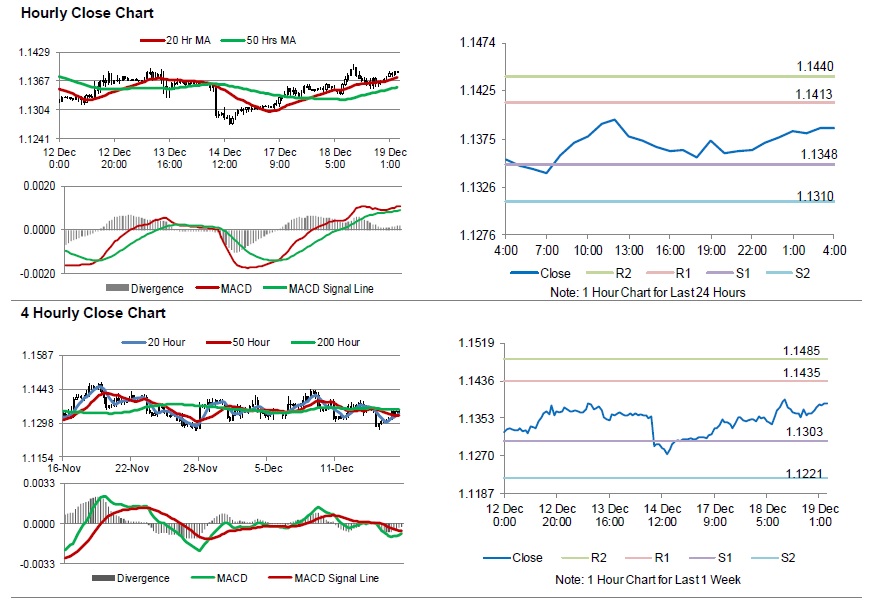
For the 24 hours to 23:00 GMT, the EUR rose 0.19% against the USD and closed at 1.1371.
On the macro front, Germany’s Ifo business expectations index dropped to a level of 97.3 in December, more than market expectations for a fall to a level of 98.3. In the previous month, the index had recorded a level of 98.7. Moreover, the nation’s Ifo business confidence index eased to a level of 101.0 in December, hitting its lowest level in two years and compared to a level of 102.0 in the prior month. Market participants had expected the index to decline to a level of 101.7. Also, the Ifo current assessment index slid to a level of 104.7 in December, compared to market consensus for a fall to a level of 104.9. In the preceding month, the index had recorded a reading of 105.4.
The US dollar declined against a basket of currencies yesterday, amid caution ahead of the Federal Reserve’s monetary policy decision.
In the US, data showed that the US housing starts advanced 3.2% on monthly basis, to an annual rate of 1256.0K in November, amid rise in construction of multi-family homes. Housing starts had registered a revised reading of 1217.0K in the prior month. Moreover, the nation’s building permits unexpectedly rose to a seven-month high level by 5.0% on monthly basis, to an annual rate of 1328.0K in November. In the preceding month, building permits had recorded a revised level of 1265.0K.
In the Asian session, at GMT0400, the pair is trading at 1.1386, with the EUR trading 0.13% higher against the USD from yesterday’s close.
The pair is expected to find support at 1.1348, and a fall through could take it to the next support level of 1.1310. The pair is expected to find its first resistance at 1.1413, and a rise through could take it to the next resistance level of 1.1440.
Looking forward, traders would await the Euro-zone’s construction output for October followed by Germany’s producer price index for November, set to release in a few hours. Later in the day, the US Federal Reserve’s interest rate decision along with the US existing home sales for November, will keep investors on their toes.
The currency pair is trading above its 20 Hr and 50 Hr moving averages
British Pound Extends Its Gains In The Morning Session
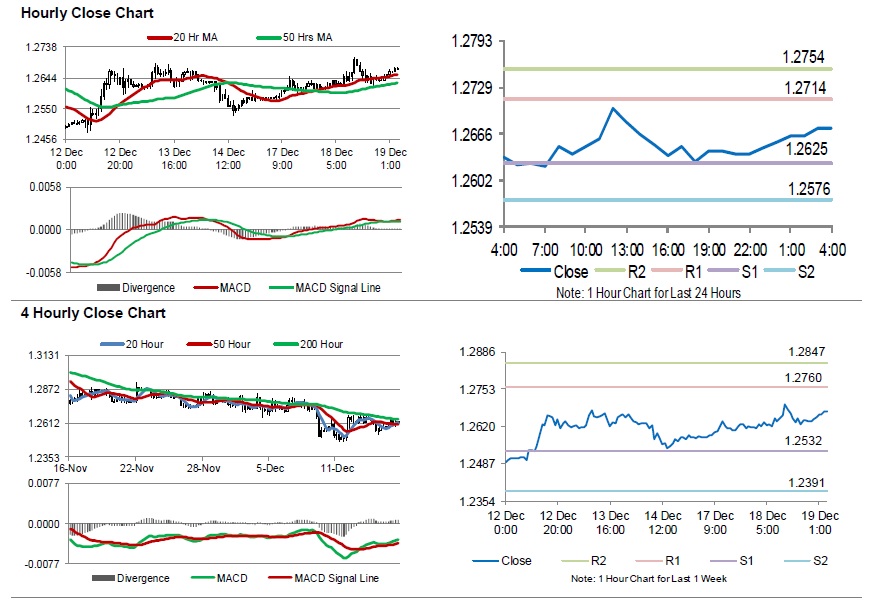
For the 24 hours to 23:00 GMT, the GBP rose 0.24% against the USD and closed at 1.2646.
In the Asian session, at GMT0400, the pair is trading at 1.2673, with the GBP trading 0.21% higher against the USD from yesterday’s close.
The pair is expected to find support at 1.2625, and a fall through could take it to the next support level of 1.2576. The pair is expected to find its first resistance at 1.2714, and a rise through could take it to the next resistance level of 1.2754.
Looking ahead, investors would await the release of UK’s consumer price index, producer price index, retail price index all for November along with the house price index for October, slated to release in a few hours. Moreover, the CBI trends orders for December will be on investors radar.
The currency pair is trading above its 20 Hr and 50 Hr moving averages.
Japan’s Total Trade Deficit Widened More-Than-Estimated In November
For the 24 hours to 23:00 GMT, the USD declined 0.34% against the JPY and closed at 112.44.
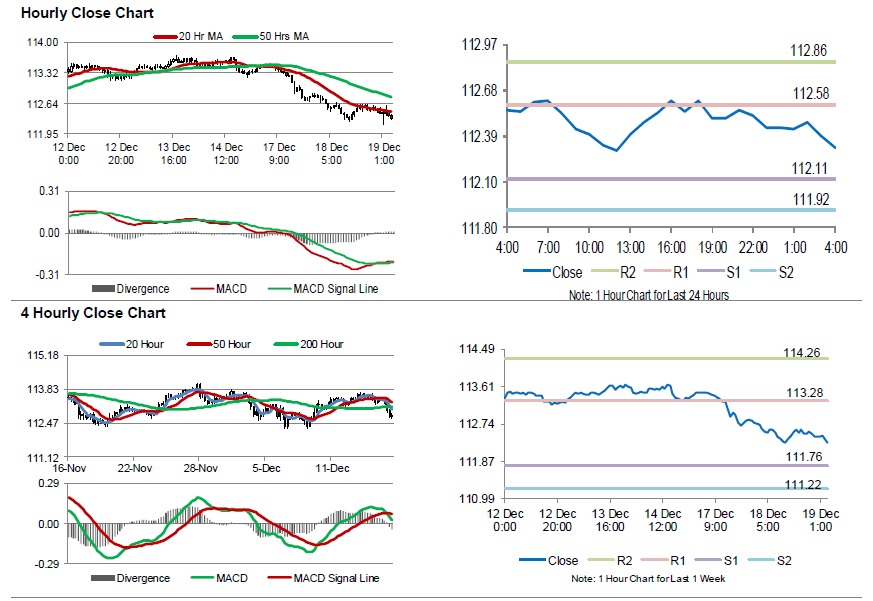
In the Asian session, at GMT0400, the pair is trading at 112.31, with the USD trading 0.12% lower against the JPY from yesterday's close.
Overnight data showed that Japan's total trade deficit widened more-than-expected to ¥737.3 billion in November, following a deficit of ¥449.3 billion in the previous month. Markets had envisaged the trade deficit to expand to ¥630.0 billion.
The pair is expected to find support at 112.11, and a fall through could take it to the next support level of 111.92. The pair is expected to find its first resistance at 112.58, and a rise through could take it to the next resistance level of 112.86.
Amid lack of economic releases in Japan today, traders would focus on global macroeconomic events for further direction.
The currency pair is trading below its 20 Hr and 50 Hr moving averages.