

Sample Category Title
Swiss Franc Trading A Tad Higher In The Morning Session
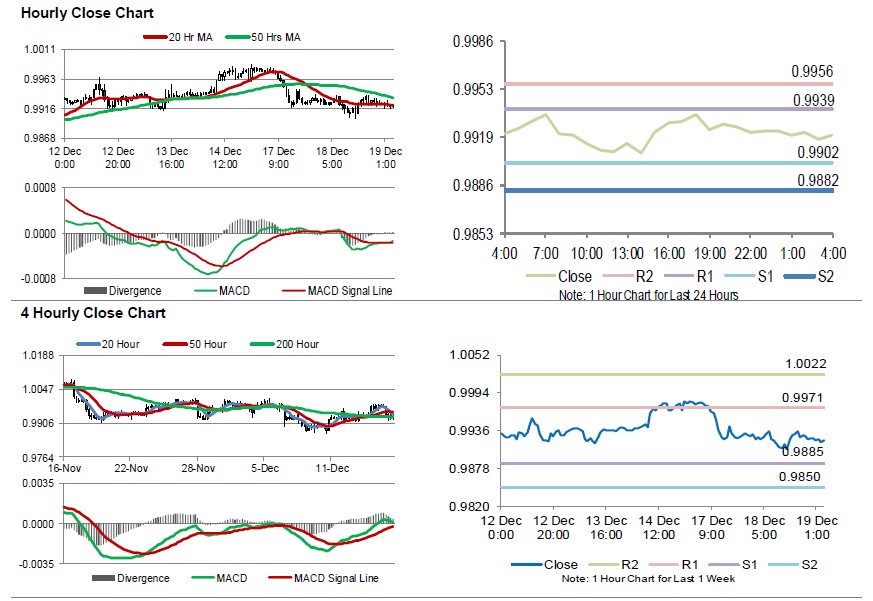
For the 24 hours to 23:00 GMT, the USD declined 0.05% against the CHF and closed at 0.9924.
In the Asian session, at GMT0400, the pair is trading at 0.9921, with the USD trading slightly lower against the CHF from yesterday’s close.
The pair is expected to find support at 0.9902, and a fall through could take it to the next support level of 0.9882. The pair is expected to find its first resistance at 0.9939, and a rise through could take it to the next resistance level of 0.9956.
The currency pair is showing convergence with its 20 Hr moving average and trading below its 50 Hr moving average.
Canada’s Manufacturing Shipments Surprisingly Cased In October
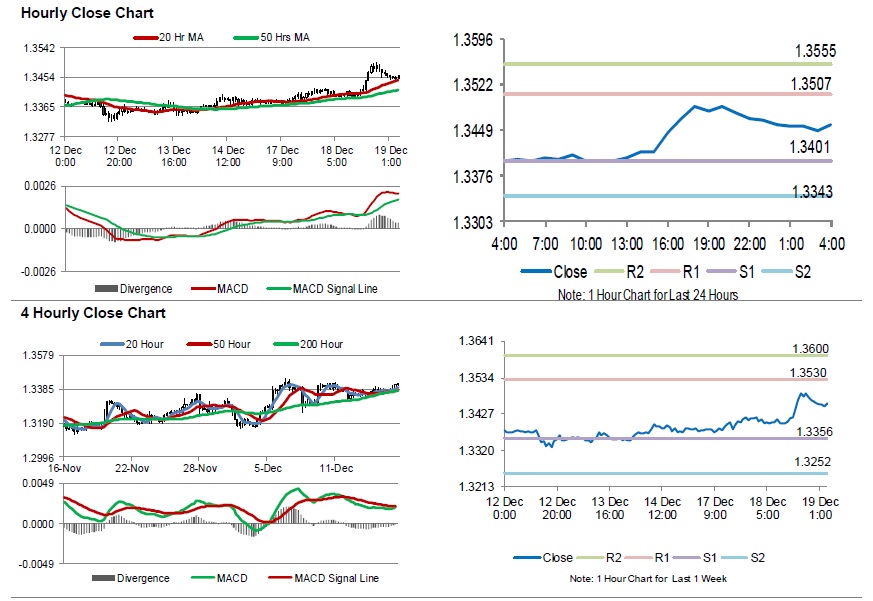
For the 24 hours to 23:00 GMT, the USD rose 0.38% against the CAD and closed at 1.3465.
Data indicated that Canada's manufacturing shipments unexpectedly declined 0.1% on a monthly basis in October, defying market expectations for a rise of 0.4%. In the previous month, manufacturing shipments had advanced 0.2%.
In the Asian session, at GMT0400, the pair is trading at 1.3459, with the USD trading a tad lower against the CAD from yesterday's close.
The pair is expected to find support at 1.3401, and a fall through could take it to the next support level of 1.3343. The pair is expected to find its first resistance at 1.3507, and a rise through could take it to the next resistance level of 1.3555.
Trading trend in the Loonie today is expected to be determined by Canada's consumer price index November, scheduled to release later in the day.
The currency pair is showing convergence with its 20 Hr moving average and trading above its 50 Hr moving average.
Aussie Trading Higher In The Morning Session
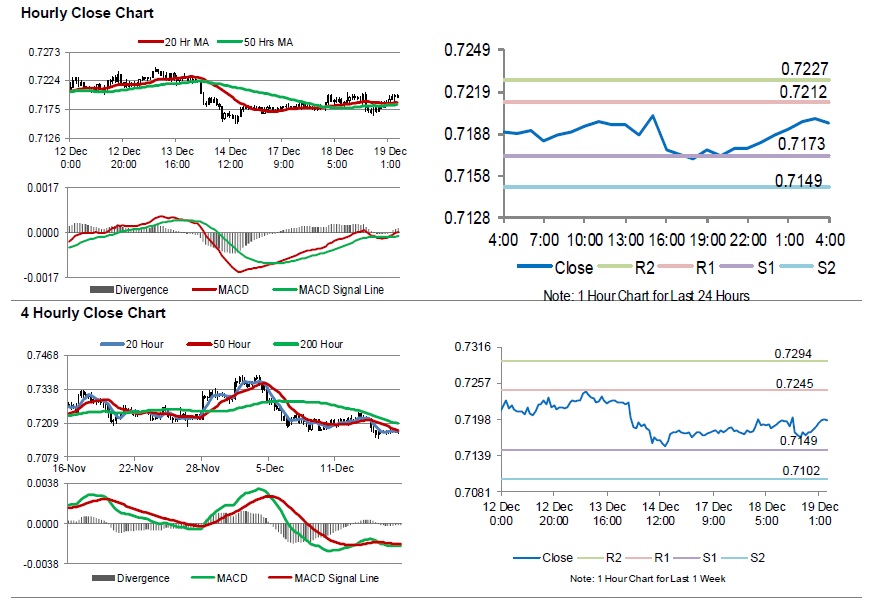
For the 24 hours to 23:00 GMT, the AUD rose 0.07% against the USD and closed at 0.7182.
LME Copper prices declined 0.9% or $52.5/MT to $6043.0/MT. Aluminium prices rose 0.1% or $2.5/MT to $1940.0/MT.
In the Asian session, at GMT0400, the pair is trading at 0.7196, with the AUD trading 0.19% higher against the USD from yesterday’s close.
The pair is expected to find support at 0.7173, and a fall through could take it to the next support level of 0.7149. The pair is expected to find its first resistance at 0.7212, and a rise through could take it to the next resistance level of 0.7227.
Moving ahead, investors would closely monitor Australia’s unemployment rate for November, set to release overnight.
The currency pair is trading above its 20 Hr and 50 Hr moving averages.
Gold: Yellow Metal Extends Its Gains In The Asians Session
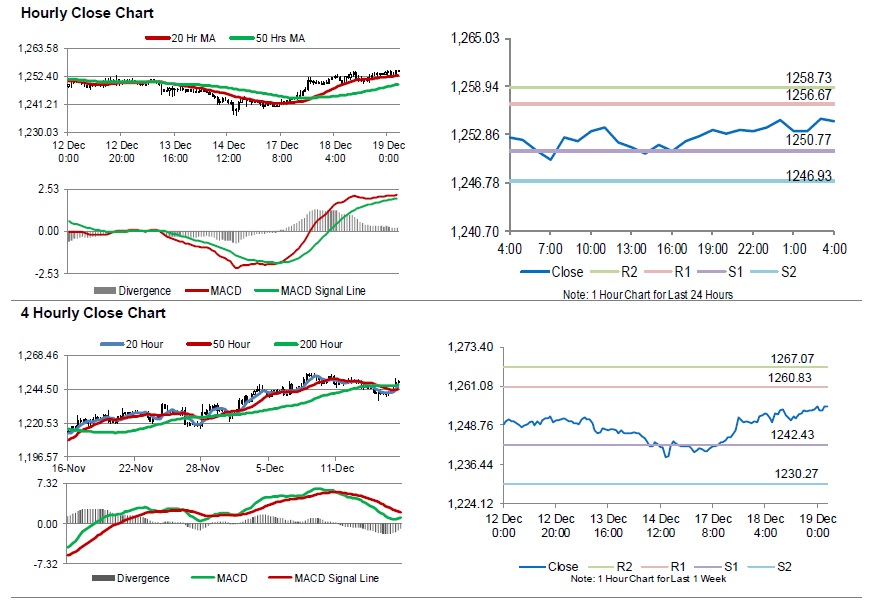
For the 24 hours to 23:00 GMT, Gold rose 0.32% against the USD and closed at USD1253.30 per ounce, amid weakness in the US dollar.
In the Asian session, at GMT0400, the pair is trading at 1254.60, with gold trading 0.10% higher against the USD from yesterday’s close.
The pair is expected to find support at 1250.77, and a fall through could take it to the next support level of 1246.93. The pair is expected to find its first resistance at 1256.67, and a rise through could take it to the next resistance level of 1258.73.
The yellow metal is trading above its 20 Hr and 50 Hr moving averages.
Silver: White Metal Reverses Its Losses In The Morning Session
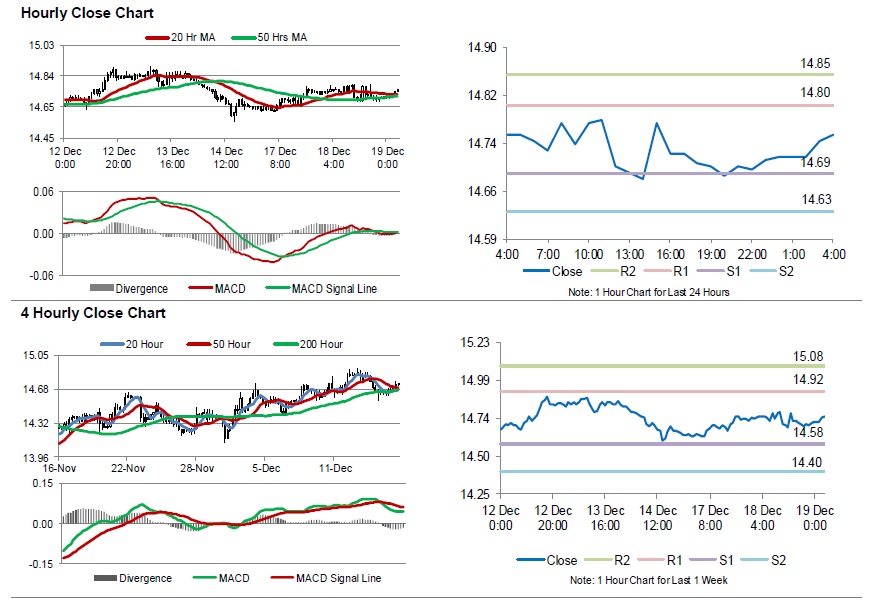
For the 24 hours to 23:00 GMT, Silver declined 0.07% against the USD and closed at USD14.72 per ounce.
In the Asian session, at GMT0400, the pair is trading at 14.76, with silver trading 0.27% higher against the USD from yesterday’s close.
The pair is expected to find support at 14.69, and a fall through could take it to the next support level of 14.63. The pair is expected to find its first resistance at 14.80, and a rise through could take it to the next resistance level of 14.85.
The white metal is trading above its 20 Hr and 50 Hr moving averages.
Crude Oil: Oil Trading Higher, Ahead Of EIA’s Weekly Crude Oil Stockpiles Data
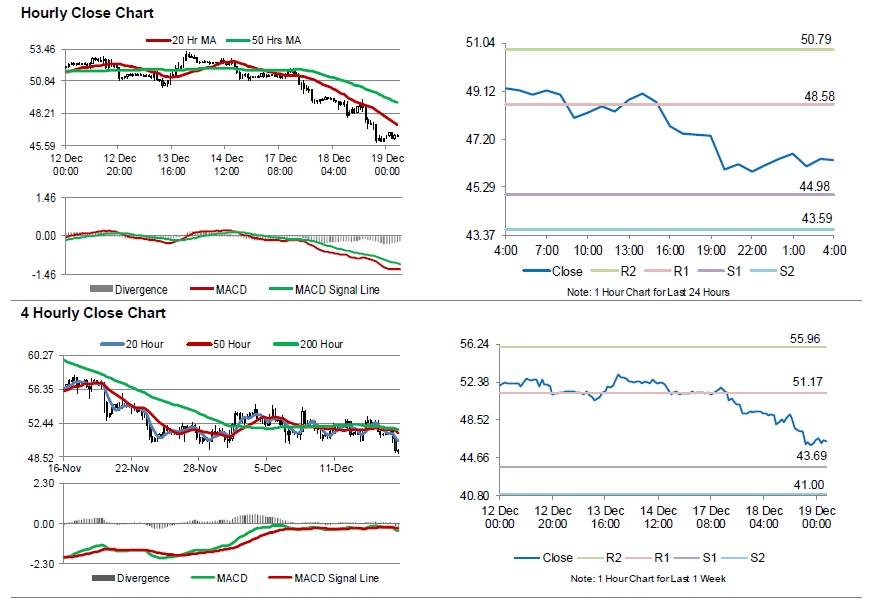
For the 24 hours to 23:00 GMT, Crude Oil declined 6.45% against the USD and closed at USD46.16 per barrel, amid concerns over crude oversupply and after the American Petroleum Institute (API) reported that US crude oil inventories rose by 3.5 million barrels to 441.3 million barrels in the week ended 14 December.
In the Asian session, at GMT0400, the pair is trading at 46.38, with oil trading 0.48% higher against the USD from yesterday's close.
The pair is expected to find support at 44.98, and a fall through could take it to the next support level of 43.59. The pair is expected to find its first resistance at 48.58, and a rise through could take it to the next resistance level of 50.79.
Crude oil is trading below its 20 Hr and 50 Hr moving averages.
EUR/USD Daily Outlook
Daily Pivots: (S1) 1.1334; (P) 1.1368; (R1) 1.1400; More.....
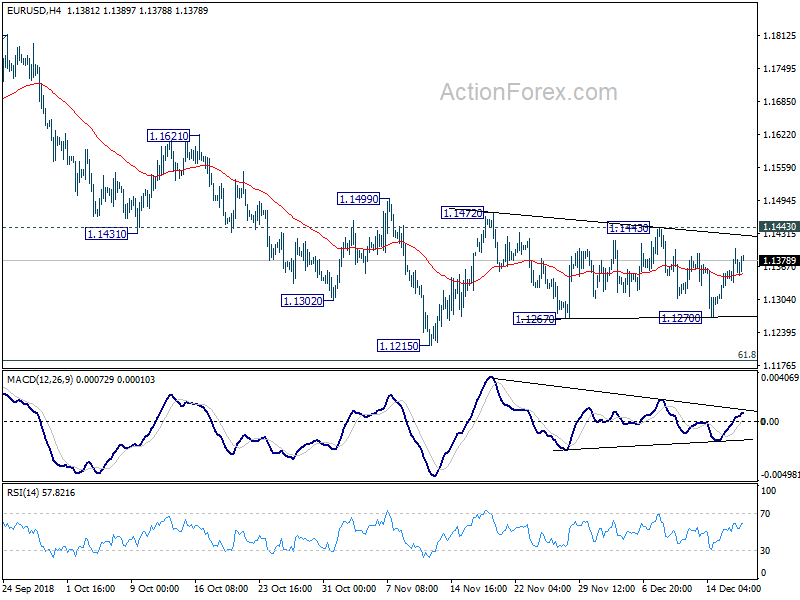
While the rebound from 1.1270 was strong, EUR/USD is still bounded in range of 1.1270/1443. Intraday bias remains neutral at this point. As long as 1.1443 resistance holds, we'd favor a downside breakout. On the downside, break of 1.1270 will argue that larger fall is resumption should target 1.1251 low next. Decisive break there will confirm this bearish case. EUR/USD should drop through 1.1186 fibonacci level to 61.8% projection of 1.2555 to 1.1300 from 1.1814 at 1.1038 next. However, firm break of 1.1443 resistance will indicate near term reversal and turn focus back to 1.1814 resistance.
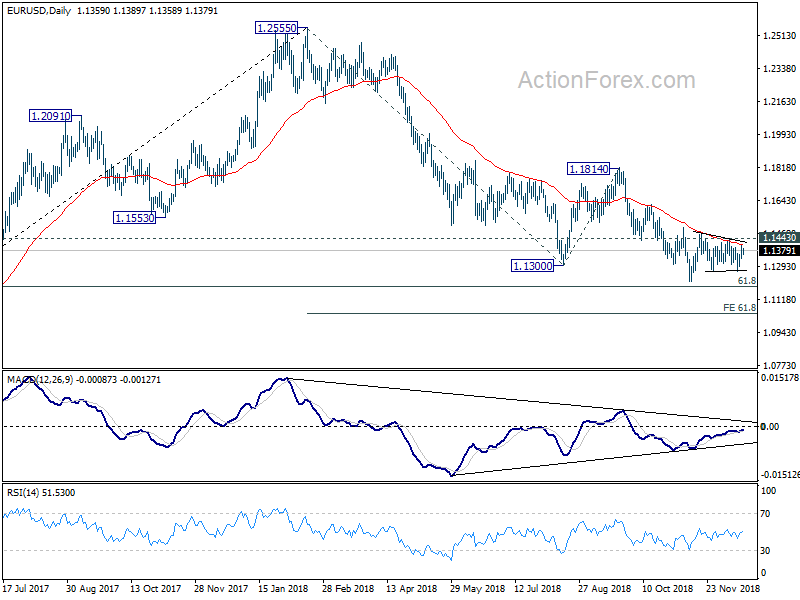
In the bigger picture, as long as 1.1814 resistance holds, down trend down trend from 1.2555 medium term top is still in progress and should target 61.8% retracement of 1.0339 (2017 low) to 1.2555 at 1.1186 next. Sustained break there will pave the way to retest 1.0339. However, break of 1.1814 will confirm completion of such down trend and turn medium term outlook bullish.
Dollar in Range ahead of FOMC, Preparing for Breakout
Dollar is mildly softer in Asian session as traders turn cautious ahead of FOMC rate decision. But it should be noted that, except versus less, and to a lesser extent Swiss Franc, Dollar isn't that weak. EUR/USD, GBP/USD and AUD/USD are bounded in consolidation in familiar range. USD/CAD has indeed extended recent rally, thanks to free fall in oil prices. The wild card in the new FOMC economic projections. Dollar could have a breakout from ranges whether there are changes in the projections or not.
Staying in the currency markets, Canadian Dollar is the weakest one for the week as WTI crude oil dived to as low as 46.07 on down trend resumption. Dollar is the second weakest for the week but is held above last week's against all. Australian Dollar is the third weakest, also staying in prior week's range. On other hand, Yen is notably strong as it's now above last week's high against Euro, Swiss Franc and Canadian.
In other markets, US treasury yields had another day of sharp decline overnight. 5-year yield closed down -0.037 at 2.656. 10-year yield dropped -0.032 to 2.825. 30-yer yield dropped -0.035 to 3.079. Yield curve is now inverted from 1-year (2.651) to 2-year (2.646) and 3-year (2.631). US stocks recovered mildly after Monday's free fall. DOW rose 0.35%, S&P 500 rose 0.01%, NASDAQ rose 0.45%. In Asia, Nikkei is currently down -0.55%, Hong Kong HSI up 0.16%, China Shanghai SSE down -0.25%, Singapore Strait Times up 0.47%.
FOMC previews and recap of September projections
Despite all the political pressure, Fed is widely expected to raise federal funds rate by 25bps to 2.25-2.50% today. The meeting bears much more importance then just the rate hike, as investors would be eager to know Fed's rate path in 2019, which has become pretty unsure recently. The statement, voting, and economic projections could all play a part in shaping market expectations.
In the November statement, Fed concluded by saying that "In determining the timing and size of future adjustments to the target range for the federal funds rate, the Committee will assess realized and expected economic conditions relative to its maximum employment objective and its symmetric 2 percent inflation objective. This assessment will take into account a wide range of information, including measures of labor market conditions, indicators of inflation pressures and inflation expectations, and readings on financial and international developments."
That is, Fed based its decision on a wide range of meaningful data rather than just a few pieces of them. While Chair Jerome Powell might put more emphasis on data dependency, the statement itself is clear and comprehensive enough that doesn't warrant a change.
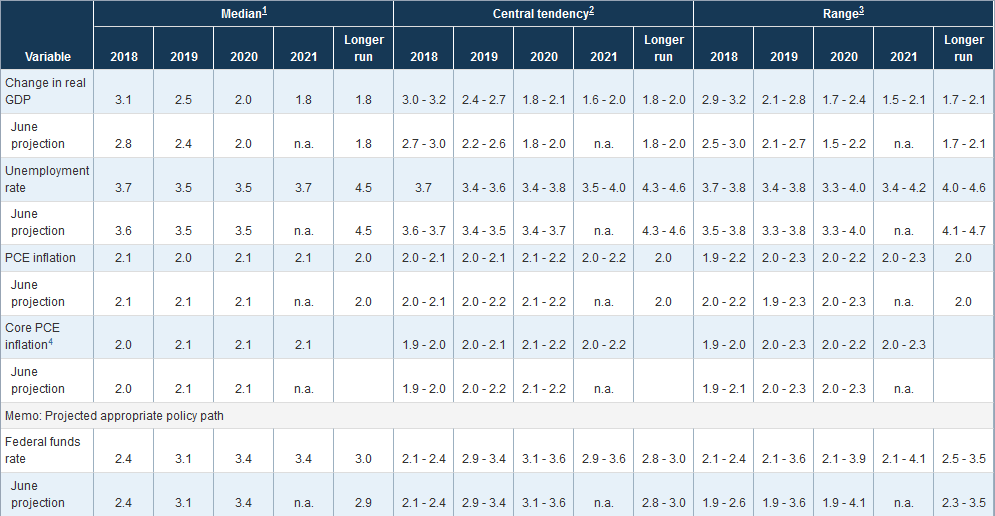
On economic projections, the most important part is federal funds rate projections. As a recap, back in September, the longer run federal funds rate was estimated to be at 3.0%, with central tendency at 2.8-3.0% and 2.5-3.5%. Despite financial market volatility and signs of peaking growth momentum, it still a consensus among fed policies to lift rate to neutral. And if we take the central tendency as consensus, there should be at least one to two more rate hikes onwards.
But timing is the question. For 2019, the median federal funds rate projection was at 3.1%, with central tendency at 2.9-3.4%. That means, members leaned towards two to three more hikes in 2019, if economic conditions favored. At the same time, that would mean interest rate would go pass neutral a little.
While we won't expect many changes to the projections, we won't be surprised to see some. And changes or not, Dollar would be volatile on the figures.
Suggested readings on FOMC:
- Fed Likely Hikes Rate in December, Future Path More Dovish
- USD/JPY: Will The Fed Deliver A Present Or A Lump Of Coal For Buck Bulls?
- Will the Fed be Less Dovish than Markets Expect?
- FOMC Preview: What Do We Expect?
- What To Expect From The Last Fed Meeting In 2018?
UK to start no-deal Brexit preparation in full
UK Prime Minister Theresa May's spokesman said yesterday that the Cabinet agreed that the government should start no-deal Brexit preparation "in full". He noted "we have now reached the point where we need to ramp up these preparations". And, "we will now set in motion the remaining elements of our no-deal plans".
Additionally, "Cabinet also agreed to recommend businesses now also ensure they are similarly prepared, enacting their own no-deal plans as they judge necessary".
Asian business sentiment stays low on trade war concerns
The Thomson Reuters/INSEAD Asian Business Sentiment Index rose to 63 in Q4, up from 58 in Q3 which was a near three year low. While readings above 50 still indicates a positive outlook, the result is still one of the lowest readings in years.
Antonio Fatas from INSEAD noted in the release that "this confirms the reading of the previous quarter: there is more uncertainty, there are increasing concerns about growth," And, "this doesn't mean there is going to be a crisis over the next quarters, but if there is one, this is an indication that it wouldn't be a large surprise to some."
Global trade war is, by some distance, the biggest perceived risks to business outlook. China slowdown and higher interest rates followed and then Brexit. The report also noted that, "the dispute between the world's two biggest economies, threatens businesses throughout the region due to global value chains."
On the data front
Australia Westpac leading index dropped -0.1% mom in November. Japan trade deficit widened to JPY -0.49% in November.
UK inflation data will be the main focus in European session, with CPI, RPI, PPI and house price index featured. Germany will also release PPI.
Canadian CPI will be a focus in US session too. US will release existing home sales, crude oil inventories and the highly anticipated FOMC rate decision and press conference.
EUR/USD Daily Outlook
Daily Pivots: (S1) 1.1334; (P) 1.1368; (R1) 1.1400; More.....
While the rebound from 1.1270 was strong, EUR/USD is still bounded in range of 1.1270/1443. Intraday bias remains neutral at this point. As long as 1.1443 resistance holds, we'd favor a downside breakout. On the downside, break of 1.1270 will argue that larger fall is resumption should target 1.1251 low next. Decisive break there will confirm this bearish case. EUR/USD should drop through 1.1186 fibonacci level to 61.8% projection of 1.2555 to 1.1300 from 1.1814 at 1.1038 next. However, firm break of 1.1443 resistance will indicate near term reversal and turn focus back to 1.1814 resistance.
In the bigger picture, as long as 1.1814 resistance holds, down trend down trend from 1.2555 medium term top is still in progress and should target 61.8% retracement of 1.0339 (2017 low) to 1.2555 at 1.1186 next. Sustained break there will pave the way to retest 1.0339. However, break of 1.1814 will confirm completion of such down trend and turn medium term outlook bullish.
Economic Indicators Update
| GMT | Ccy | Events | Actual | Forecast | Previous | Revised |
|---|---|---|---|---|---|---|
| 23:30 | AUD | Westpac Leading Index M/M Nov | -0.10% | 0.10% | ||
| 23:50 | JPY | Trade Balance (JPY) Nov | -0.49T | -0.31T | -0.30T | -0.29T |
| 7:00 | EUR | German PPI M/M Nov | -0.10% | 0.30% | ||
| 7:00 | EUR | German PPI Y/Y Nov | 3.20% | 3.30% | ||
| 9:30 | GBP | CPI M/M Nov | 0.20% | 0.10% | ||
| 9:30 | GBP | CPI Y/Y Nov | 2.30% | 2.40% | ||
| 9:30 | GBP | Core CPI Y/Y Nov | 1.90% | 1.90% | ||
| 9:30 | GBP | RPI M/M Nov | 0.10% | 0.10% | ||
| 9:30 | GBP | RPI Y/Y Nov | 3.30% | 3.30% | ||
| 9:30 | GBP | PPI Input M/M Nov | 0.60% | 0.80% | ||
| 9:30 | GBP | PPI Input Y/Y Nov | 9.60% | 10.00% | ||
| 9:30 | GBP | PPI Output M/M Nov | -0.10% | 0.30% | ||
| 9:30 | GBP | PPI Output Y/Y Nov | 3.10% | 3.30% | ||
| 9:30 | GBP | PPI Output Core M/M Nov | 0.30% | |||
| 9:30 | GBP | PPI Output Core Y/Y Nov | 2.40% | |||
| 9:30 | GBP | House Price Index Y/Y Oct | 3.30% | 3.50% | ||
| 13:30 | USD | Current Account Balance (CAD) Q3 | -125B | -101B | ||
| 13:30 | CAD | CPI M/M Nov | -0.10% | 0.30% | ||
| 13:30 | CAD | CPI Y/Y Nov | 2.20% | 2.40% | ||
| 13:30 | CAD | CPI Core - Common Y/Y Nov | 1.90% | 1.90% | ||
| 13:30 | CAD | CPI Core - Median Y/Y Nov | 2.00% | 2.00% | ||
| 13:30 | CAD | CPI Core - Trim Y/Y Nov | 2.10% | 2.10% | ||
| 15:00 | USD | Existing Home Sales Nov | 5.20M | 5.22M | ||
| 15:30 | USD | Crude Oil Inventories | -1.2M | |||
| 19:00 | USD | FOMC Rate Decision (Lower Bound) | 2.25% | 2.25% | ||
| 19:00 | USD | FOMC Rate Decision (Upper Bound) | 2.50% | 2.50% | ||
| 19:30 | USD | FOMC Press Conference |
FOMC previews and recap of September projections
Despite all the political pressure, Fed is widely expected to raise federal funds rate by 25bps to 2.25-2.50% today. The meeting bears much more importance then just the rate hike, as investors would be eager to know Fed's rate path in 2019, which has become pretty unsure recently. The statement, voting, and economic projections could all play a part in shaping market expectations.
In the November statement, Fed concluded by saying that "In determining the timing and size of future adjustments to the target range for the federal funds rate, the Committee will assess realized and expected economic conditions relative to its maximum employment objective and its symmetric 2 percent inflation objective. This assessment will take into account a wide range of information, including measures of labor market conditions, indicators of inflation pressures and inflation expectations, and readings on financial and international developments."
That is, Fed based its decision on a wide range of meaningful data rather than just a few pieces of them. While Chair Jerome Powell might put more emphasis on data dependency, the statement itself is clear and comprehensive enough that doesn't warrant a change.
Fed's Septemebr projections.
On economic projections, the most important part is federal funds rate projections. As a recap, back in September, the longer run federal funds rate was estimated to be at 3.0%, with central tendency at 2.8-3.0% and 2.5-3.5%. Despite financial market volatility and signs of peaking growth momentum, it still a consensus among fed policies to lift rate to neutral. And if we take the central tendency as consensus, there should be at least one to two more rate hikes onwards.
But timing is the question. For 2019, the median federal funds rate projection was at 3.1%, with central tendency at 2.9-3.4%. That means, members leaned towards two to three more hikes in 2019, if economic conditions favored. At the same time, that would mean interest rate would go pass neutral a little.
While we won't expect many changes to the projections, we won't be surprised to see some. And changes or not, Dollar would be volatile on the figures.
Suggested readings on FOMC:
Market Morning Briefing: Aussie Has Risen Slightly
STOCKS
The Bulls are on the rope, maybe even on the mat, in most Equity markets. India has beeen a very good outperformer, but needs a solid recovery in global markets in order to push higher.
Will the FOMC tonight cause the Dow (23675.64, +82.66, +0.35%) break below the super-crucial Support at 23500? We are unable to assess how Short the market is, going into the FOMC. On the charts, 23500 is the "Last of the Mohicans" Support. If it breaks, we would have to give up on the bullish possibility. Let us see.
The Nikkei (21105) is trading below 21200, the support mentioned yesterday, and is beginning to look bearish towards 20000, unless it manages to rise past 21200 soon. But, with Dollar-Yen (112.40) looking potentially bearish, recovery in the Nikkei might be an uphill task.
The Shanghai (2571.30, -0.17%) is bearish, as expected, as it has been unable to break above 2650 and is now trading below 2600. A near-term test of 2550-25 seems likely. Follow-through selling from there (if seen, chances 60-40) could open up 2500-2450 etc.
Economic data from Germany yesterday (IFO) and Europe on Monday (CPI) has been soft, suggesting growth/ recovery could be topping out. The DAX (10740.89, -31.31, -0.29%) looks bearish, as expected towards 10500-400.
India has done spectacularly over the last few days, rising in a bearish global environment. But, the Nifty (10908.70, +20.35, +0.19%) has a super-crucial Resistance at 10925, the 21-week Moving Average. If the global environment does not improve after the FOMC today, there could be a danger of the Nifty succumbing to bearishness as well.
COMMODITIES
Commodities are all mixed. While the crude prices trade lower, Gold and silver are stable with resistances above current levels. Copper has fallen sharply and indicates bearishness for the near term. Overall medium term trend for the commodities look weak.
Brent (56.44) and Nymex WTI (46.62) fell sharply breaking below our mentioned supports at 56.50 and 48 respectively. While the crude prices trade lower, we may now look for a fall towards 54-52 on Brent. WTI has support at 46 on the weekly candle chart which if holds could produce a bounce else could lead to a fall towards 44-42 on the downside.
Brent-WTI spread (9.82) is near resistance at 10 and while that holds, the spread could come off towards 9.0-8.5 levels in the coming sessions.
Gold (1254.40) is headed towards 1260-1265 in the near term and looks bullish just now while Silver (14.74) could trade in the 14.50-15.00 region for some time. While Silver trades below 15, medium term is bearish. An expected fall in Silver could probably indicate bearishness in Gold going forward from levels near 1265.
Copper (2.6785) is down sharply and could test 2.64-2.60 on the downside while below 2.70. the overall broad 2.90-2.60 range is intact just now. Need to see if price drops below 2.60 in the coming sessions.
FOREX
Currency pairs are all mixed. Pound and Aussie look bullish for the near term while Euro and Dollar Yen could fall. Strength in Rupee towards 70 looks possible today.
Dollar index (96.86) has support near 96.75 which if holds, could push the index back to higher levels of 97.50.
Euro (1.1386) is rising for the past couple of sessions but could face some restriction near 1.1450. FOMC today would be important and a possible fall in Euro is possible from levels near 1.14-1.1450 if tested during the day.
Dollar Yen (112.38) has broken below support at 112.5 and while it moves lower, a fall to 111.5 could be seen in the near term. View is bearish.
Euro-Yen (127.87) has fallen below our mentioned support at 128. While below 128, the pair could test 126 on the downside before reversing from there. Near term is bearish while below 128. If the FOMC triggers a rise in Dollar Index today, Euro could be pulled down as the Euro-Yen indicates further fall from here.
Pound (1.2670) has broken above the immediate channel resistance on the daily candles but has upper resistance at 1.28 on the 3-day and weekly charts. Near term is bullish towards 1.28 while the long term downtrend remains intact.
Aussie (0.7192) has risen slightly. While support at 0.7150 holds, near term could be stable to bullish towards 0.725.
Dollar Rupee (70.44) is likely to test 70.20-70.00 on the downside on weakness in crude prices overnight. Note that 70 is a crucial support coming from Jan’18 and could produce a decent bounce once tested. We do not look at a fall below 70 just now.
INTEREST RATES
Will the Fed listen to the market and relent on its "dot plot" for 2019? Will it recognise the sharp decline in Crude prices? If it does, we would hope to see the Near-end of the Curve drop while the Far-end might remain stable, or even rise. In effect, the Curve might steepen.
On the charts, the 30Yr (3.06%) and 10Yr (2.81%) are trading just below long-term support trendlines coming up from the July 2016 lows. This means they have already fallen a lot. On the other hand, the 2Yr (2.65%) and 5Yr (2.65%) have comparitivley much more room to fall on the downside. So, if the FOMC relents tonight, maybe it is the Near-end that will react more and fall more. Let us see.
As mentioned in the Equity section, economic data from Germany yesterday (IFO) and Europe on Monday (CPI) has been soft, suggesting growth/ recovery could be topping out. However, the German 5Yr (-0.30%) and German 2Yr (-0.61%) may have Support near current levels. At the same time, the 10Yr (0.24%) and 30Yr (0.85%) are falling. So, there is Curve flattening happening in Germany.
The German-US 2Yr Spread (-3.26%) has been rising well since -3.55% in mid-Nov, but might have near-term Resistance at -3.25% now. But the rally since -3.55% can continue in the longer term, while above -3.35%.
In India, the RBI is to infuse liquidity of Rs 50,000 Cr in January. The 10Yr GOI (7.3452%) may dip a bit more to 7.25%, but might move up from there, given good Support near 4.49% on Indo-US 10yr Spread, compared to the current level of 4.53%.