Sample Category Title
Dollar Index Struggles In Narrow Range, Upside Tendency In Long Term
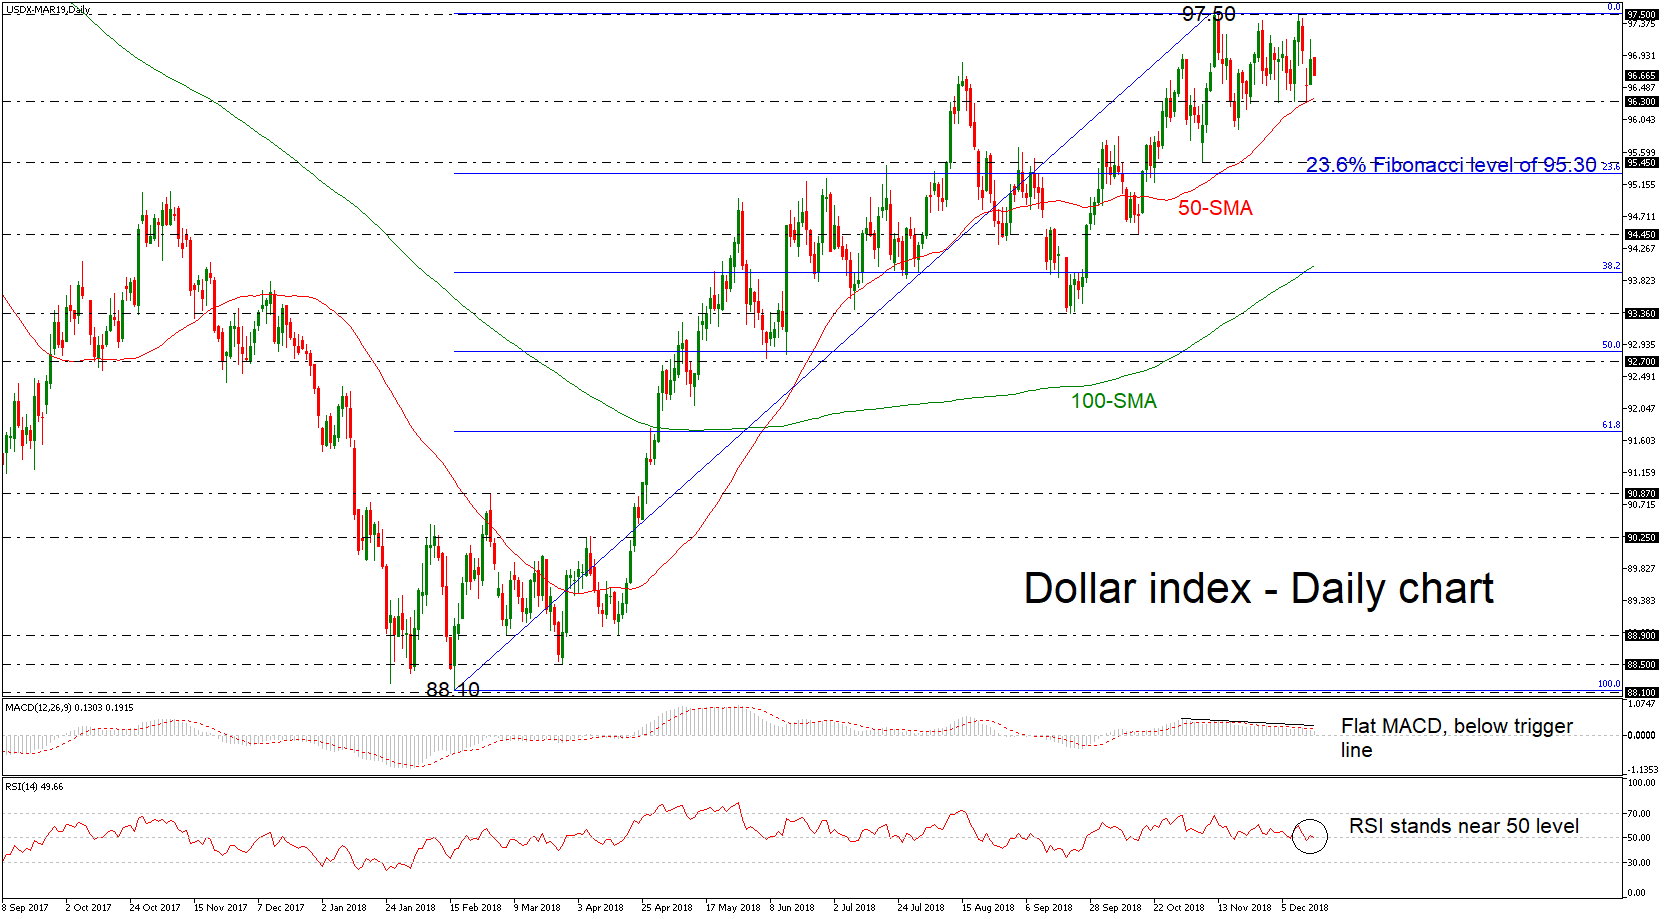
The dollar index has been consolidating after flirting with the one-and-a-half-year peaks at 97.50 in the previous week. In the short-term, sideways movement will likely continue as the technical indicators are flattening. The MACD stands below the trigger line with weak momentum, while the Relative Strength Index (RSI) hovers near the 50 level.
On the upside, the index could retest the previous highs of 97.50. A decisive close above this region could bring further buying interest into the market, pushing the price towards the 98.70 resistance level, taken from the inside swing bottom on March 26.
In case the index edges lower, the 96.30 barrier could offer nearby support, which overlaps with the 50-day simple moving average (SMA). An extension below that line and therefore out of the channel, would probably trigger further declines towards the 95.45 level and the 95.30 barrier, which is the 23.6% Fibonacci retracement level of the upleg from 88.10 to 97.50.
Summarizing, in the long-term view, the price is trending upwards, painting a positive picture.
Dollar To Weaken In 2019
Dollar to weaken in 2019
Next year will see global deceleration and decline of the USD. To weaken the current strength of the greenback, there will be two critical inputs: the US Federal Reserve Bank will hike rates this week and again in 2019; the European Central Bank will shift bias further towards normalization. Markets are seeing evidence of both, but the Brexit chaos is clouding the picture. Should the UK-EU relationship improve, watch for an overvalued USD to quickly fall.
US inflation was soft in November, because of lower energy prices that fell by 4.1% in a month. Non-energy components showed steady rises as food prices and core CPI both rose by 0.2% monthly. Consumers are still spending, as highlighted by solid retail numbers, but households’ decision to buy used cars and to rent housing rather than buy suggests uncertainty. The broad economy is running white hot, which indicates inflation pressure and three 0.25% hikes in 2019. The Fed is likely to head toward normalization. Wednesday’s press conference offers Fed Chairman Powell a chance to clarify views on market volatility and further rate moves.
Markets higher ahead of China announcements
Asian shares rose on Monday ahead of the US Federal Reserve Bank and Bank of England monetary policy meetings and China’s Central Economic Work Conference, where 2019 growth targets and policy goals will be mentioned. The Chinese government last week said it will support economic growth with reforms and risk reduction while reinforcing investment, jobs and trade. Japanese Nikkei 225 closed the day at +0.62%, while Chinese markets closed slightly lower, with the Hong Kong Hang Seng -0.03% and CSI 300 -0.15%.
Globally, stocks tumbled on Friday following poor economic data from China and Europe. And the trend is expected to continue today, as investors watch Eurozone inflation, expected to have slowed in November by 0.20% monthly, while the trade balance is expected to have risen slightly to EUR 14 billion. Business sentiment is declining and a dovish statement from the European Central Bank has pushed the euro lower (EUR/USD -5.70% year-to-date). EUR/USD is trading at 1.1330, expected to bounce back following last week’s ECB meeting, bouncing from 1.1306 (14 December low) and heading along 1.1340. We expect a sharp drop following the Fed’s meeting from Wednesday, which is expected to raise rates by 0.25%.
ETH/USD 4H Chart: Decline Likely To Continue
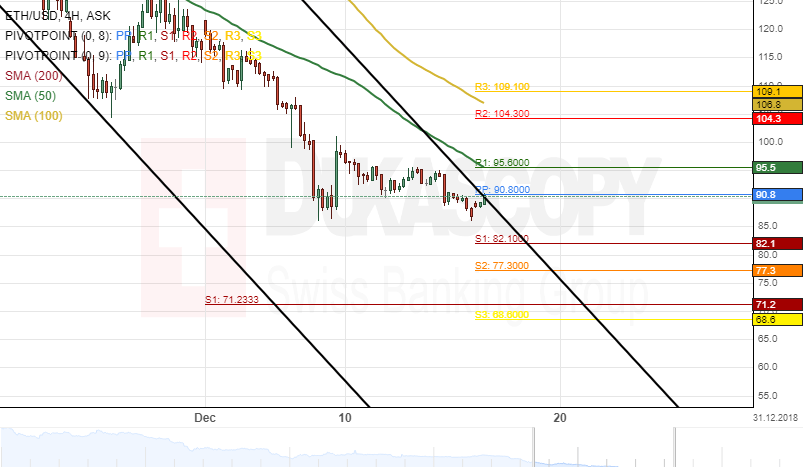
The ETH/USD pair has been trading in a medium-term descending channel pattern since the beginning of November.
The Ethereum cryptocurrency was trading near the upper boundary of the medium-term channel at 90.80 during the morning hours of Monday's session and could be set for a breakout.
If this breakout occurs, the blockchain will aim at a resistance level formed by the 100-hour simple moving average at 108.8.
However, technical indicators demonstrate that the surge might not be immediate.
BTC/USD 4H Chart: Possible Breakout
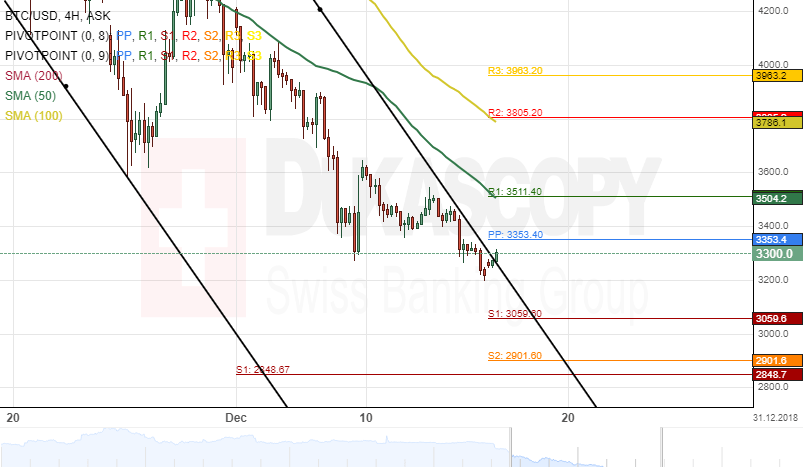
Bitcoin cryptocurrency continued to edge lower against the US Dollar since last week. The pair has breached the $3500 mark during the previous week's trading session.
From a technical point of view, the cryptocurrency is likely to continue its downside risk. The potential target for the BTC/USD pair will be at the $2500 mark during the following trading sessions.
However, given that the blockchain is near a resistance level formed by the upper boundary of a descending channel pattern, a breakout could be expected within this session.
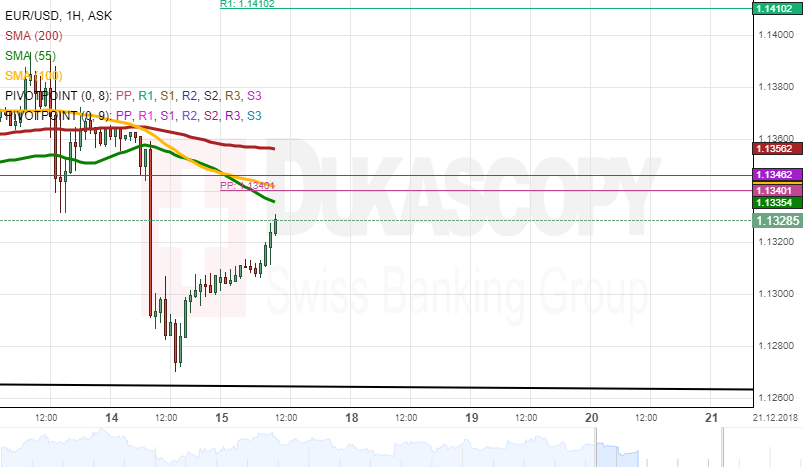
EUR/USD Analysis: Trades At Dominant Pattern Line 14 14
During Friday's trading session, the European Single Currency passed through the monthly pivot point at the 1.1346 mark to depreciate by 56 pips or 0.49%. On Monday morning, the rate was recovering itself to trade upwards at the 1.1308 mark.
Most likely, the European Single Currency will be trading near the bottom boundary of the dominant pattern at the 1.2600 level. The 55-hour simple moving average will try to catch up the rate to give an additional resistance for the currency pair.
On the other side, the European Single Currency could recover itself to appreciate against the US Dollar to trade near the weekly PP at the 1.1340 mark.
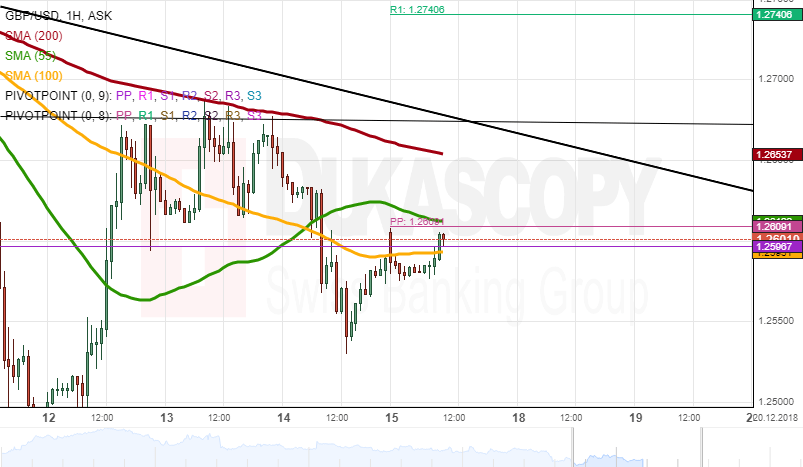
GBP/USD Analysis: Continues Depreciating
During Friday's trading session, the currency exchange rate passed through the support of the monthly S1 at 1.2596 to end the trading session at the 1.2575 mark. During Monday's morning hours, the British Pound was resisted by the 100-hour SMA to trade at the 1.2577 mark.
It is expected that the British Pound will depreciate against the US Dollar to continue trading downwards the weekly S1 at the 1.2457 mark. The 100-hour SMA will resist the rate to push the rate to depreciate during the day.
However, the currency exchange rate could break the resistance levels of the technical indicators to trade near the descending medium pattern line at the 1.2650 mark.
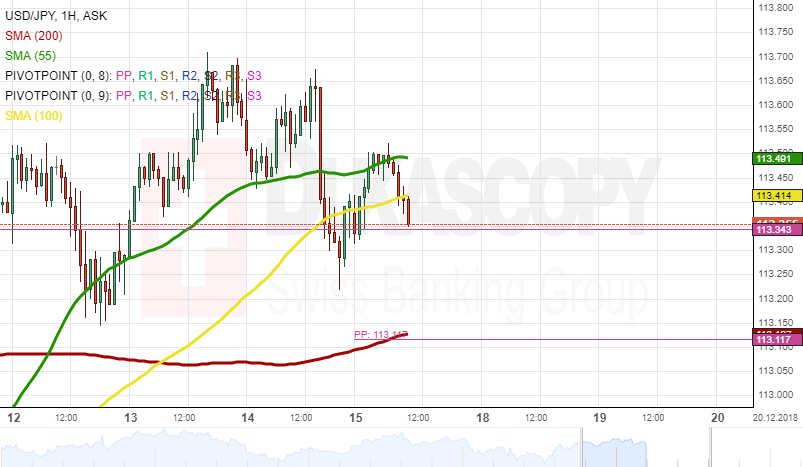
USD/JPY Analysis: Might Trade At 113.00 Level
During Friday's trading session, the US Dollar broke the support levels of the 55-hour and the 100-hour simple moving averages to end the trading day at the 113.34 mark. During Friday's morning hours, the rate was located between the 55-hour and the 100-hour SMAs to trade at the 113.46 mark.
The US Dollar will depreciate against the Japanese Yen to trade sideways near the weekly pivot point at the 113.11 mark. Moreover, the 200-hour SMA should support the rate during the trading session on Monday.
However, the currency exchange rate could be supported by the 100-hour SMA to push the rate to trade up towards the weekly R1 at the 114.00 level.
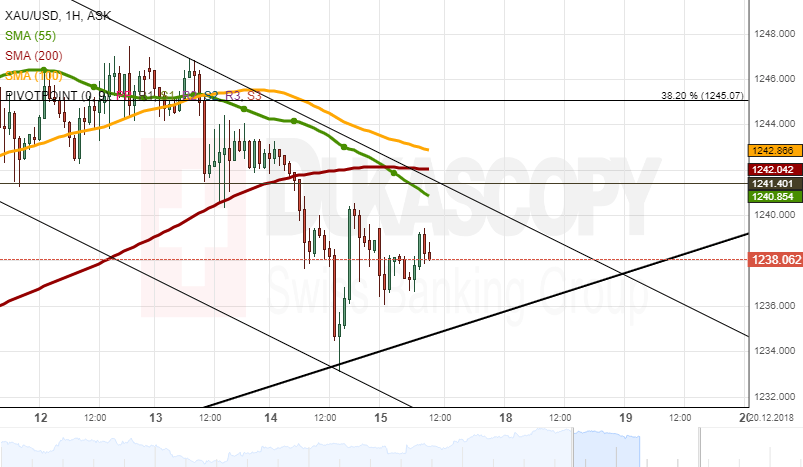
XAU/USD Analysis: Waits For A Break-Out
During Friday's trading session, the yellow metal depreciated against the US Dollar to end the trading session at the 1,236.05 mark. On Monday morning, the gold was trading sideways to stay at the 1,237.77 mark.
It is expected that the yellow metal will trade sideways to get resisted by the upper boundary of the freshly drawn pattern at the 1,238.50 mark. The 55-hour simple moving average will help to resist the rate during the day.
However, the gold could appreciate against the US Dollar to break most of the technical indicators to trade near the 38.20% Fibo at the 1,245.07 mark.
Strong Data Against Fed’s Softness
World markets were under pressure at the start of the week, due to concerns around world growth. In our view, there are more reasons to worry that the positive US statistics will not allow the Fed to soften its policy as markets expect.
The November's Retail Sales, published on Friday, were marked by 0.2% increase (versus the forecast – 0.1%). At the same time, the October's data were revised from 0.8% to 1.1%.
Industrial production jumped to 0.6% in November. Consumer activity displays growth as well: Lending gaining momentum and Consumer sentiment are near record highs now.
In addition, the United States Federal Reserve Chair Powell noted the strength of the national economy in his last speech. It may also be regarded as a signal to the markets not to expect any softening of the Fed's tone.
Earlier, FOMC has predicted to raise the rates thrice next year, but the markets, for some reason, put in the quotes one increase only. Moreover, at certain moments, chances of this step were even less than 50%.
According to PMI estimates, in contrast to strong US statistics, Friday data from Europe showed a slowdown to 4-year lows. Earlier, China reported about a sharp decrease in both, retail sales and production.
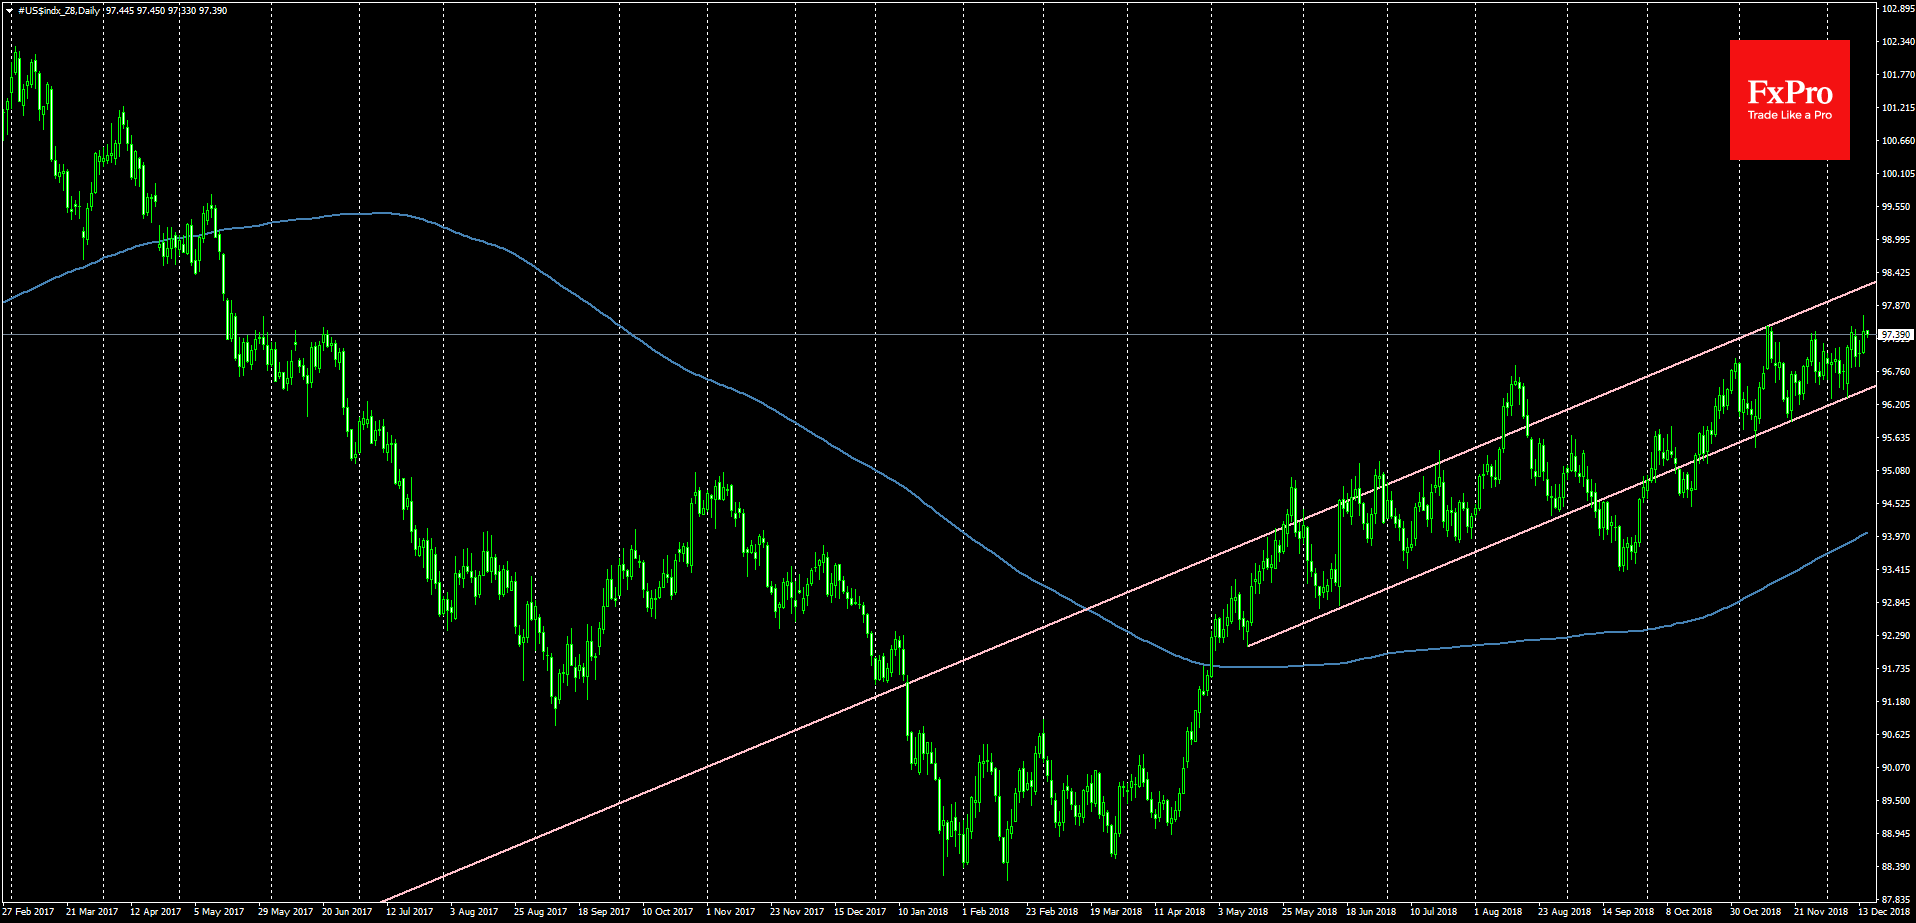
The strength of the American economy is supporting the dollar demand now and put pressure on the stock indices. On Friday, the USD updated the 19-month highs to a 6-largest-world-currencies basket, developing its growth trend.
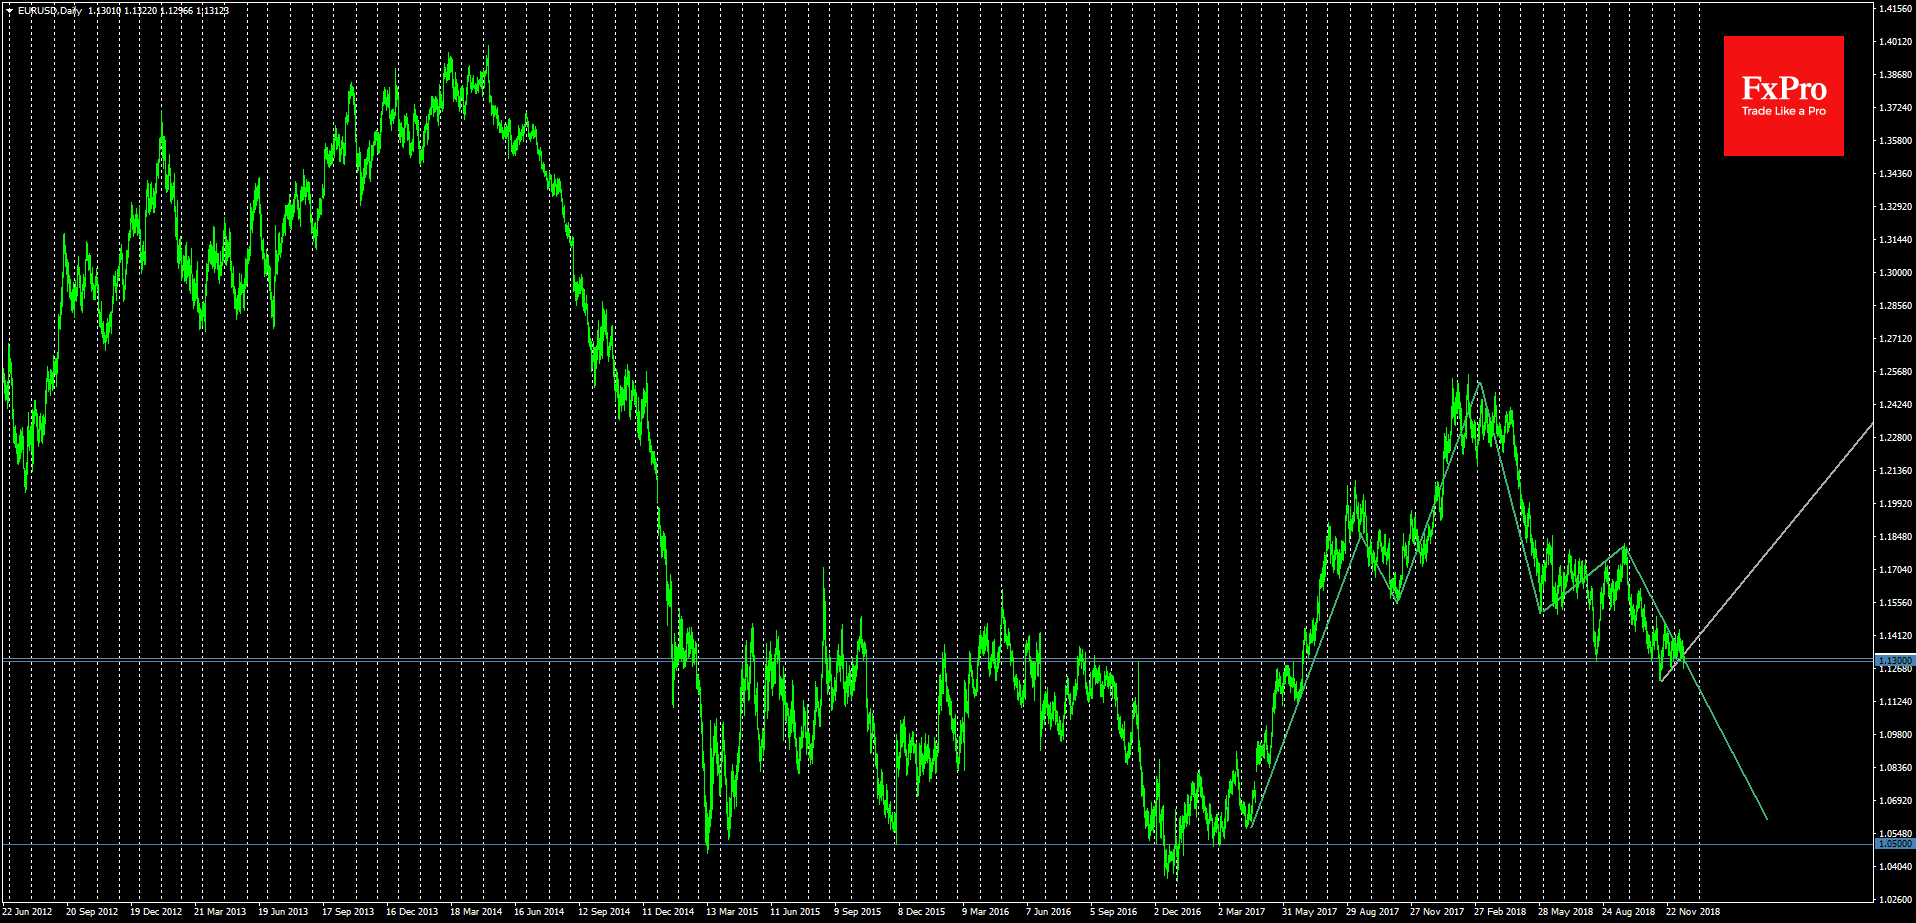
EURUSD is now trading near 1.13, an important support level of the recent months. Falling under this mark may be the beginning of a new pair decline. Over the past three years, such failures have ended with falls to 1.05.
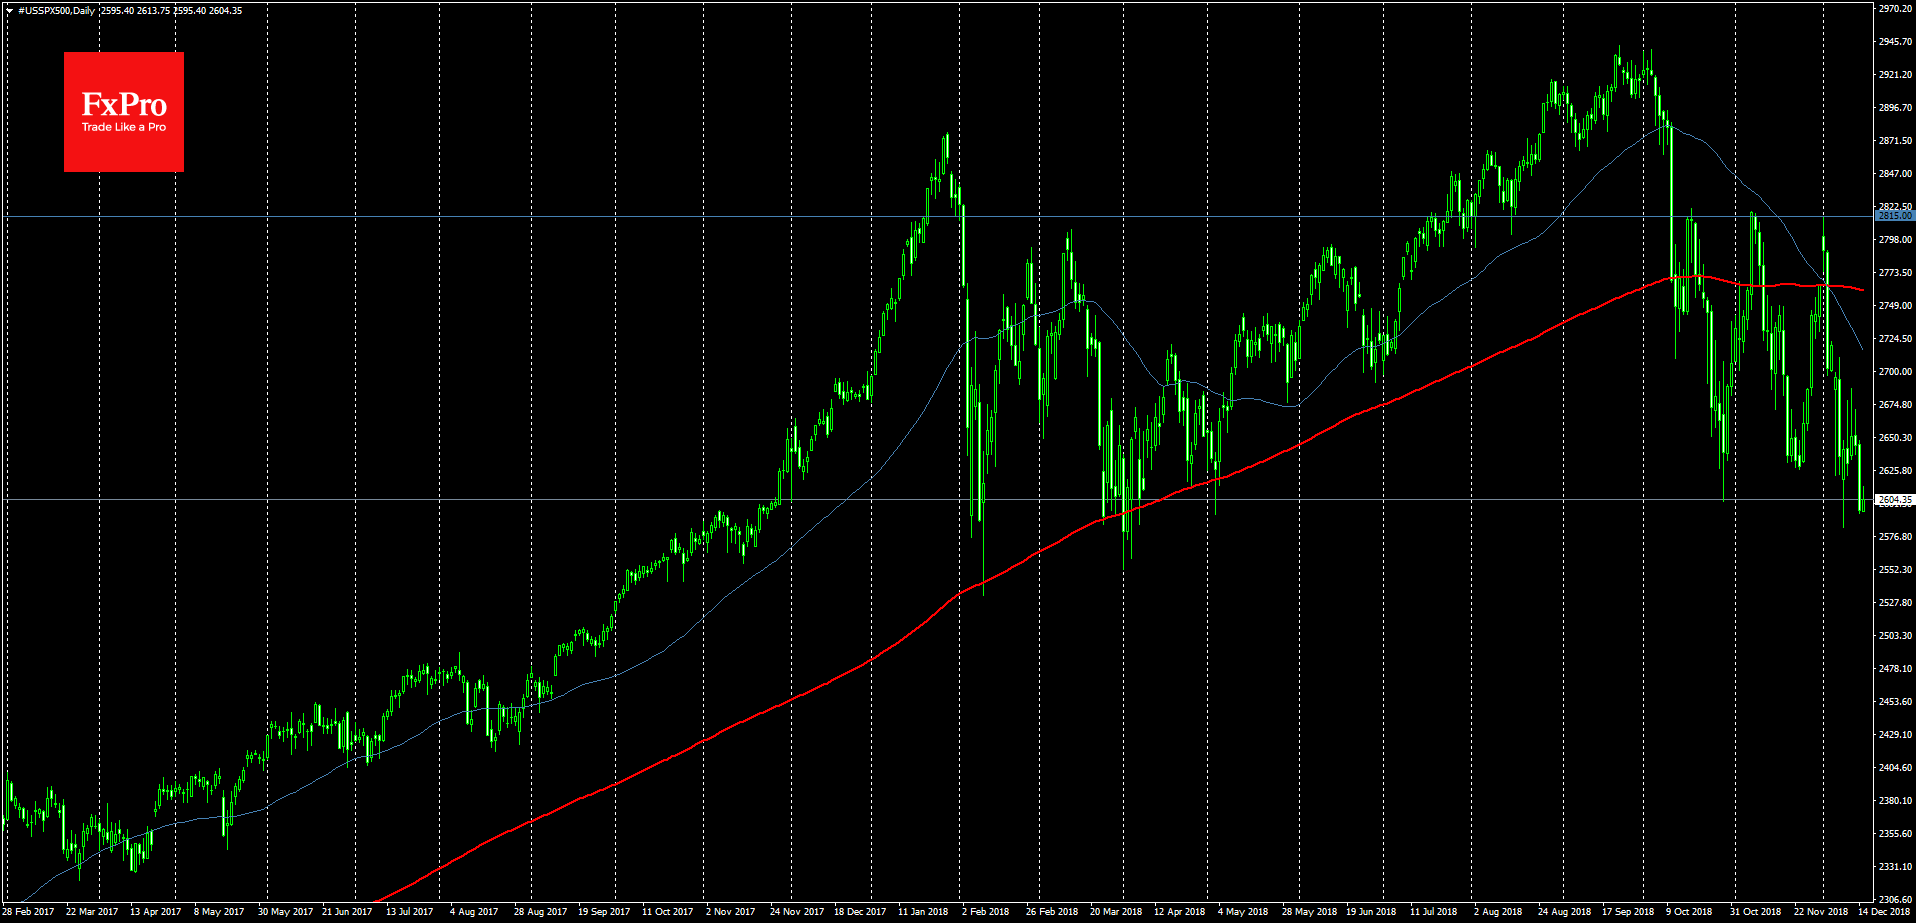
S&P500 closed last week at the lowest levels of the year. If the Fed's attitude turns out to be tougher than the markets' expectation, stock indices decline and a dollar rise will have an impulse to the further extension.
Gold Creates Bearish Retracement, Stays Bullish In Medium Term
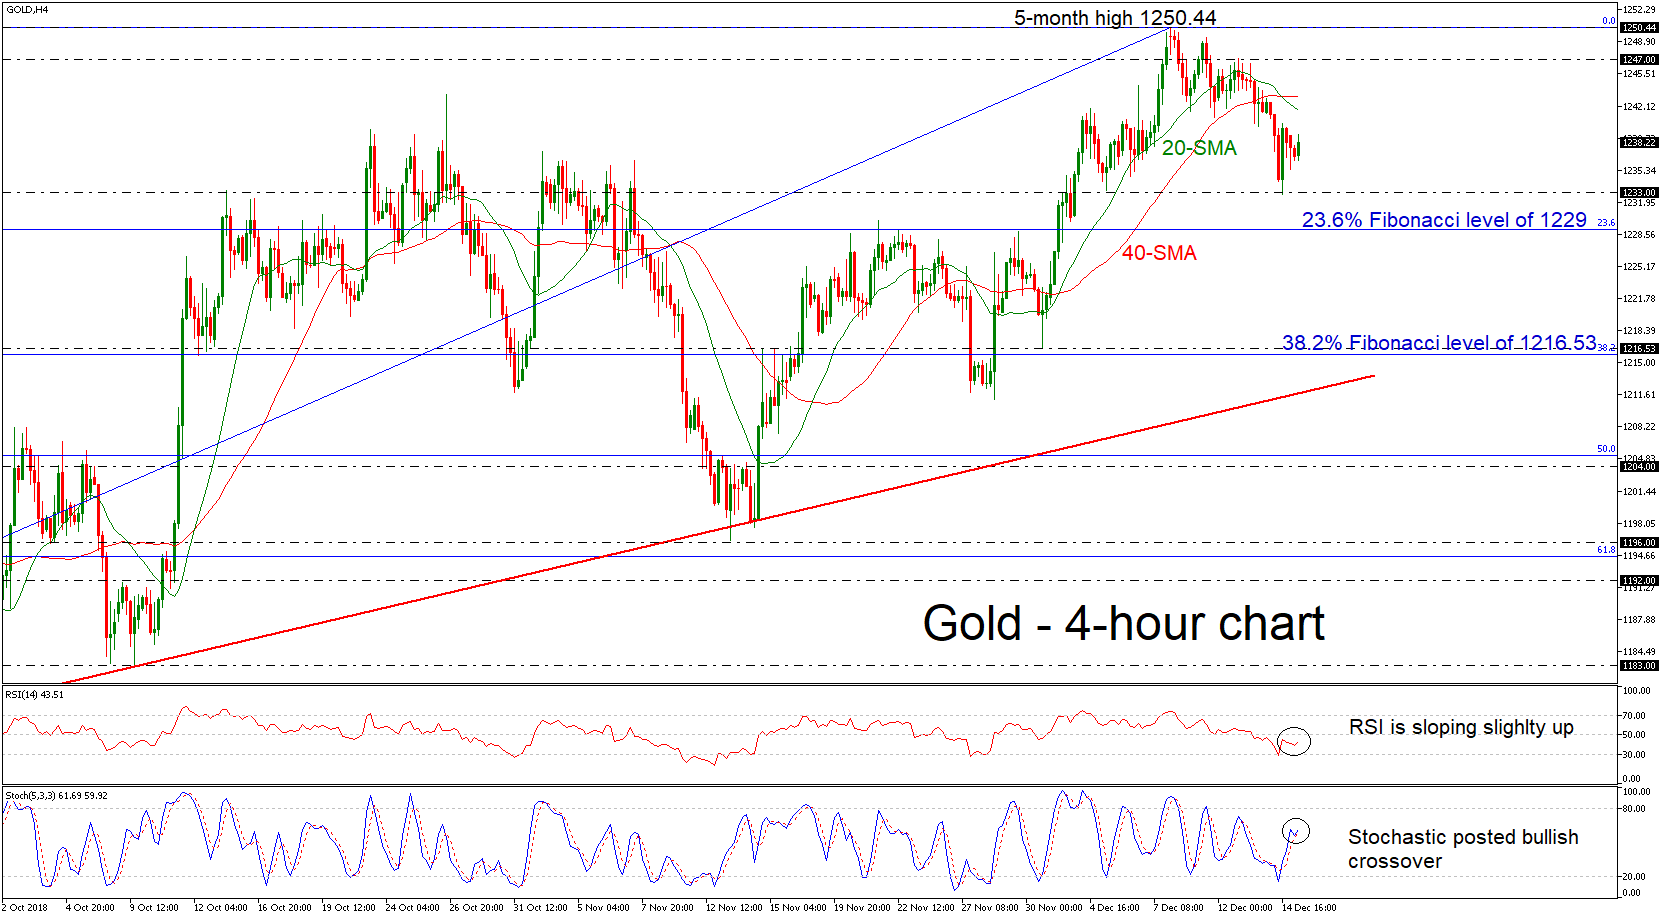
Gold prices completed two consecutive bearish days in the preceding week and retained a negative correction mode, following the pullback on the five-month high of 1250.44.
The yellow metal holds beneath the 20- and 40-simple moving averages (SMAs) in the 4-hour chart, however, the momentum indicators are turning slightly higher. The RSI indicator is pointing up in the bearish zone, while the %K line of the stochastic oscillator posted a bullish crossover with the %D line before entering the overbought zone.
The bearish movement could push prices until the immediate 1233 support barrier. Then the metal could challenge the 23.6% Fibonacci retracement level of the upward movement from 1160 to 1250.44, around 1229. If the price fails to hold above this region, it could meet support at the 38.2% Fibonacci, which holds near the 1216.53 obstacle.
On the flipside, upside movements could send prices towards the 20-SMA near 1241.61 and then at the flat 40-SMA around 1243. A break higher, could reach the five-month high of 1250.44, taken from the peak on December 10.
Concluding, gold prices remain above the rising trend line, which has been holding since August 16 but is in progress to post a negative retracement.