

Sample Category Title
Silver: White Metal Extends Its Losses In The Asian Session
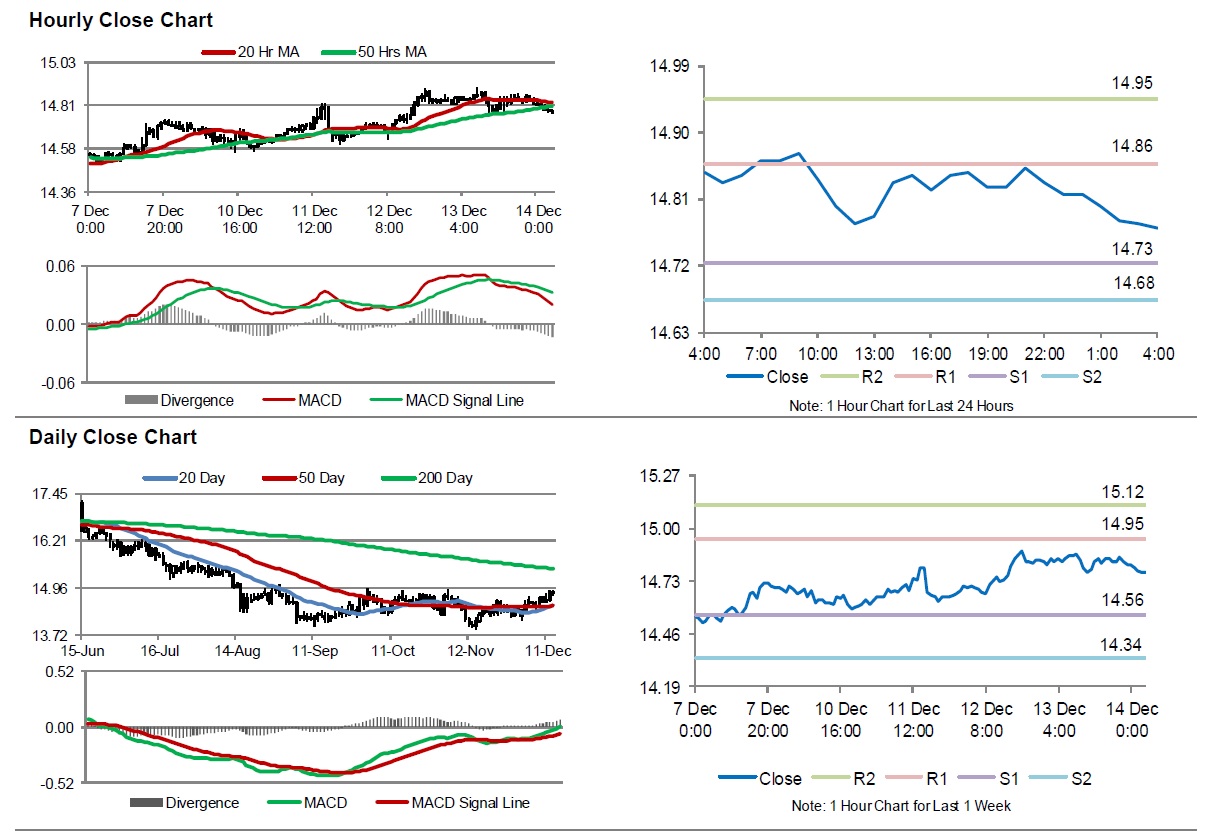
For the 24 hours to 23:00 GMT, Silver declined 0.13% against the USD and closed at USD14.82 per ounce, tracking losses in gold prices.
In the Asian session, at GMT0400, the pair is trading at 14.78, with silver trading 0.30% lower against the USD from yesterday’s close.
The pair is expected to find support at 14.73, and a fall through could take it to the next support level of 14.68. The pair is expected to find its first resistance at 14.86, and a rise through could take it to the next resistance level of 14.94.
The white metal is trading below its 20 Hr and 50 Hr moving averages.
Crude Oil: Oil Reverses Previous Session’s Gains, Baker Hughes Weekly Rig Count Data Eyed
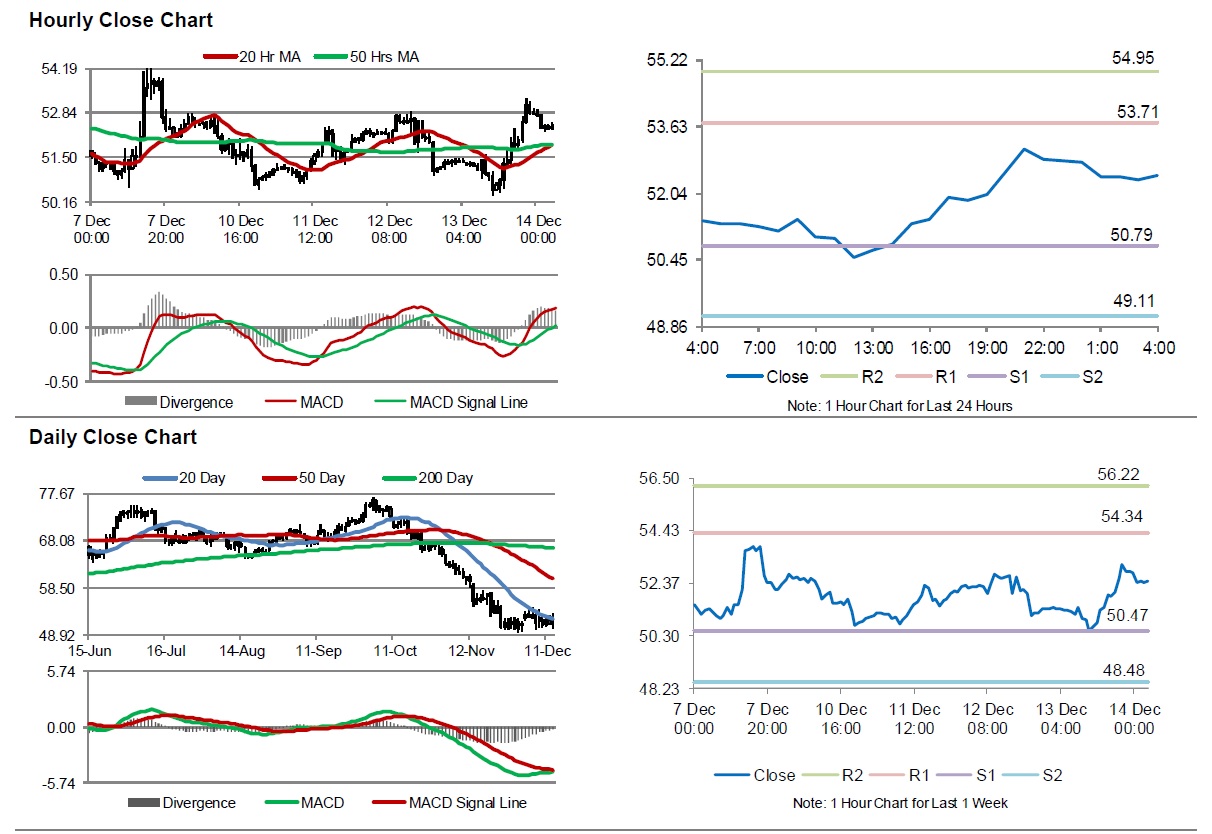
For the 24 hours to 23:00 GMT, Crude Oil rose 2.82% against the USD and closed at USD52.81 per barrel, amid news reports that Saudi Arabia is planning to reduce shipments to the US refiners to avoid an expansion of the US crude stockpiles. Meanwhile, the International Energy Agency indicated that crude output in the Organisation of the Petroleum Exporting Countries rose by 100,000 barrels per day in November.
In the Asian session, at GMT0400, the pair is trading at 52.47, with oil trading 0.64% lower against the USD from yesterday's close.
The pair is expected to find support at 50.79, and a fall through could take it to the next support level of 49.11. The pair is expected to find its first resistance at 53.71, and a rise through could take it to the next resistance level of 54.95.
Crude oil is trading above its 20 Hr and 50 Hr moving averages.
UK got vague assurances from EU over Irish backstop
The assurances that UK Prime Minister Theresa May got from the EU were rather vague and they unlikely to appease the MPs. But at the time same, it's reported that May has been vague in her requests too. It caused some griefs from European Commission President Jean-Claude Juncker. He said at a press conference that "I do find it uncomfortable that there is an impression perhaps in the UK that it is for the EU to propose solutions". And, "It is the UK leaving the EU. And I would have thought it was rather more up to the British Government to tell us exactly what they want."
After yesterday's EU summit, EU27 leaders concluded their positions on Brexit in a five point statement. Firstly, it's "not open for renegotiation". Secondly EU wishes to "establish as close as possible a partnership" with the UK in the future. Thirdly, the backstop is intended as an "insurance policy" to prevent hard Irish border. And EU has "firm determination to work speedily on a subsequent agreement" so that "the backstop will not need to be triggered". Fourthly, if the backstop were triggered, "it would apply temporarily, unless and until it is superseded by a subsequent agreement that ensures that a hard border is avoided." Fifthly, EU calls for preparedness for all possible Brexit outcome.
ECB’s Reinvestment of QE Proceeds Would Well- Pass First Rate Hike. Growth Outlook Downgraded
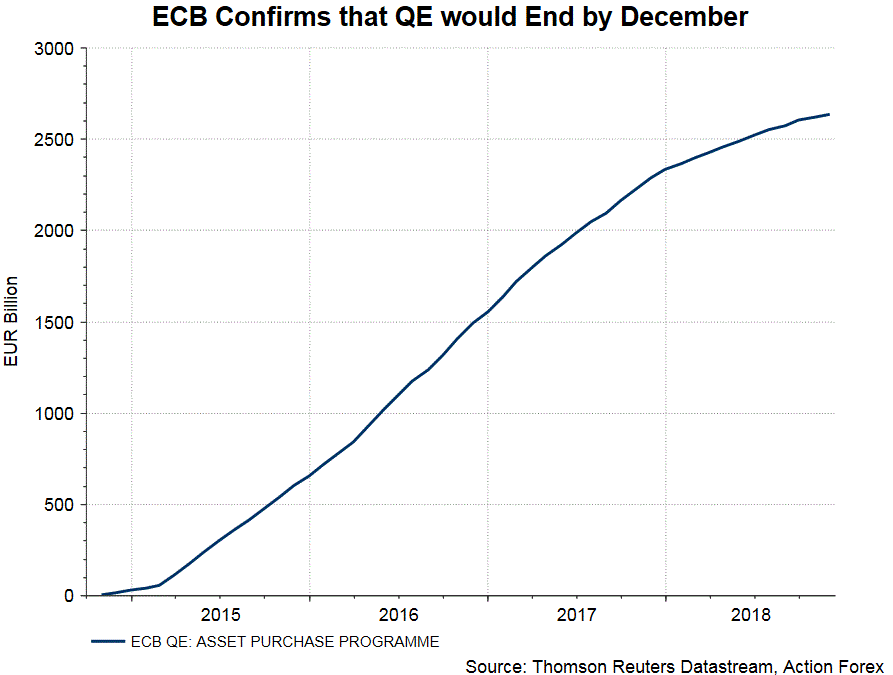
At the December meeting, ECB formally announced that the asset purchase program (QE) would end by this month. In order to maintain the size of the balance sheet at the current 2.6 trillion euro, the central bank would reinvest the proceeds for “an extended period of time” which should well past that of the first rate hike. the forward guidance on interest rate stayed unchanged. The members remained confident, but more cautious, about the economic outlook. The staff economic projections showed downgrades of both GDP growth and inflation for the coming years. Since ECB made no mention on a new round of targeted long-term refinancing operations (TLTROs), we expect it would announce this early next year. The ECB released a separate statement regarding the change in capital key.
Forward Guidance
The focus of the meeting was on the life after QE. At the accompanying statement, ECB updated the reference on the reinvestment plan, suggesting that it would “continue reinvesting… for an extended period of time past the date when it starts raising the key ECB interest rates, and in any case for as long as necessary”. President Mario Draghi noted that the change was an unanimous decision. The forward guidance on interest rate stayed the same – no rate hike “at least through the summer 2019”. While giving no definite timing for the end of reinvestment, i.e., the beginning of balance sheet reduction, we anticipate it would continue at least through end-2020.
Economic Projections
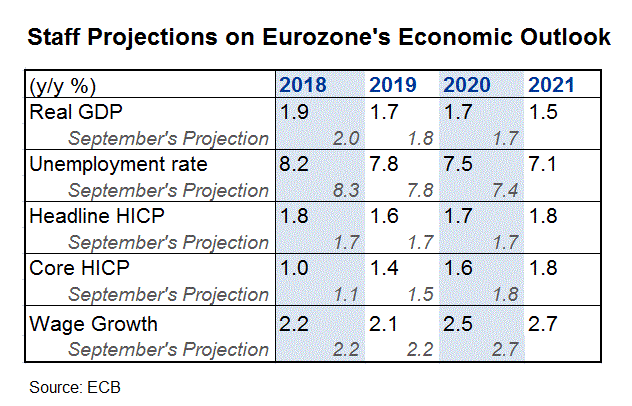
The members remained confident about the economic outlook, reiterating that the risks surrounding Eurozone’s growth outlook are “broadly balanced”. Yet, it added that “the balance of risk is moving to the downside”, due to “persistent uncertainties relating to geopolitical factors, the threat of protectionism, vulnerabilities in emerging markets and financial market volatility”. ECB’s view to economic outlook can thus be categorized as cautiously optimistic. As such, the staff downgraded the economic projections. GDP growth for this year is revised lower to +1.9%, from +2% projected in September. Growth would moderate further to +1.7% in 2019 (Sep: +1.8%) and stabilize at this level in 2020. On inflation, headline CPI is revised higher, by +0.1 percentage point, to +1.8% for this year. This is mainly driven by the rally in energy prices in the third quarter of the year. Headline CPI would ease to +1.6% (Sep: +1.7%) in 2019 and improve slightly to +1.7% in 2020. ECB downgraded core inflation through to 2020, signaling that sluggish wage growth has prohibiting improvement in the underlying price levels.
TLTROs
ECB did not mention any plan of new TLTROs. As mentioned in our preview article, we expect the central bank would eventually launch a new round of these operations. The announcement of which could be made in December or early 2019. Such operations should help reduce the impact of liquidity tightening as driven by the end of QE. ECB's downgrades of economic forecasts reinforced our view that stimulus are still needed in the bloc. In order to maintain growth and achieve the inflation target of "below, but close to, +2%", ECB would find it necessary to keep some other non-standard monetary policy tools after QE is ended. TLTROs suit this need as they provide long-term loans to banks, incentivizing them to increase their lending to businesses and consumers in the Eurozone.
GOLD Remains Sell And Oil Buy On Dips
Gold price faced a solid resistance near $1,250 and recently declined. Crude oil price is placed nicely above the $52.00 support area and it could move higher in the short term.
Important Takeaways for Gold and Oil
- Gold price topped near the $1,250 level recently and started a downside correction against the US Dollar.
- There is a major bearish trend line formed with resistance at $1,245 on the hourly chart of gold.
- Crude oil price settled above the key $52 support area with positive signs.
- There is a major bearish trend line formed with resistance at $53.80 on the hourly chart of XTI/USD.
Gold Price Technical Analysis
Gold price gained bullish momentum this past week and traded above the $1,235 and $1,240 resistance levels against the US Dollar. The price even broke the $1,248 resistance and tested the $1,250 barrier.
Sellers appeared near the $1,250 level and protected further gains. A high was formed close to the $1,251 level and later the price started a downside move. The price declined below the $1,246 level and settled below the 50 hourly simple moving average.
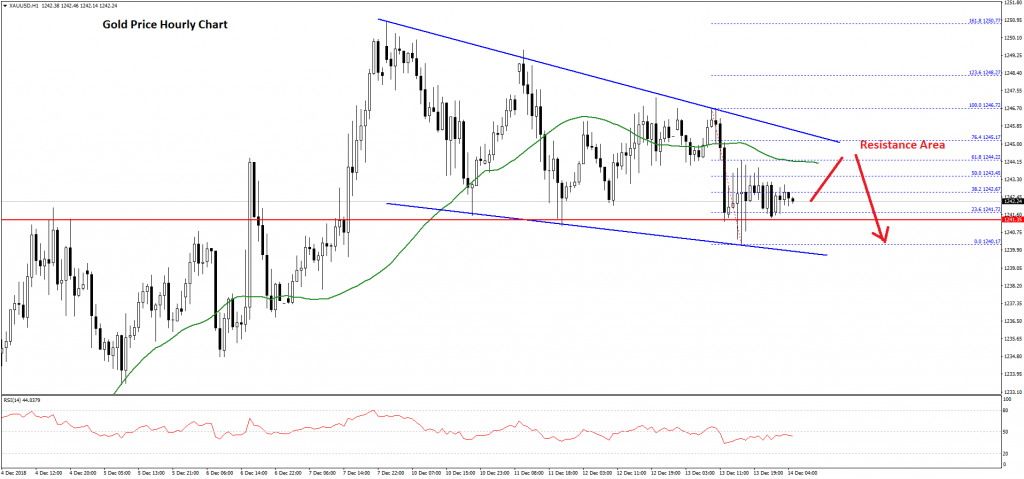
A low was formed near $1,240 on FXOpen before the price started an upside correction. It moved above the 23.6% Fib retracement level of the last decline from the $1,246 low to $1,240 high.
However, the upside move was capped by the $1,244 level and the 50 SMA. Moreover, the 50% Fib retracement level of the last decline from the $1,246 low to $1,240 high also acted as a resistance.
More importantly, there is a major bearish trend line formed with resistance at $1,245 on the hourly chart of gold. Therefore, if the price corrects higher, it is likely to face a lot of sellers near the $1,244 and $1,245 resistance levels.
On the downside, the $1,240 level is an initial support, below which the price may perhaps test the $1,236 support area in the near term.
Oil Price Technical Analysis
Crude oil price formed a solid support base near the $50.50 level and later started an upward move against the US Dollar. The price traded higher and broke the $51.00 and $51.50 resistance levels.
The upside move was positive as there was a close above the $52.00 resistance and the 50 hourly simple moving average. It opened the doors for more gains and the price recently traded towards the $53.50 level and formed a high at $53.42.
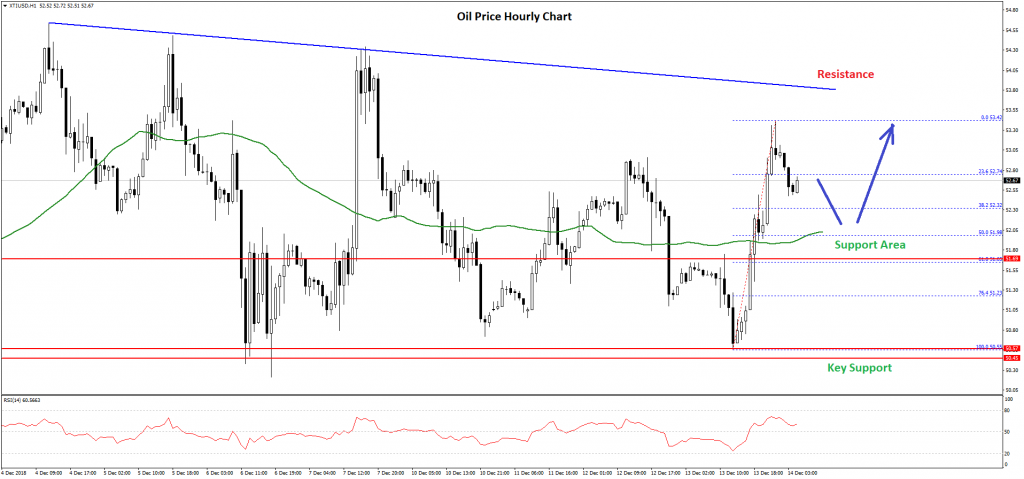
Later, there was a downside correction and the price moved below the 23.6% Fib retracement level of the recent wave from the $50.55 low to $53.42 high. However, there is a strong support formed near the $52.00 level and the 50 hourly SMA.
Moreover, the 50% Fib retracement level of the recent wave from the $50.55 low to $53.42 high is also near $52.00 to act as a support. Therefore, if the price corrects lower from the current levels, buyers are likely to protect losses below the $52.00 support.
On the upside, the $53.50 level is an initial resistance. The main resistance is near $54.00 and a major bearish trend line formed with resistance at $53.80 on the hourly chart of XTI/USD. Therefore, it won’t be easy for buyers to clear the $54.00 resistance in the near term.
Elliott Wave View: NZD/USD Pullback In Progress
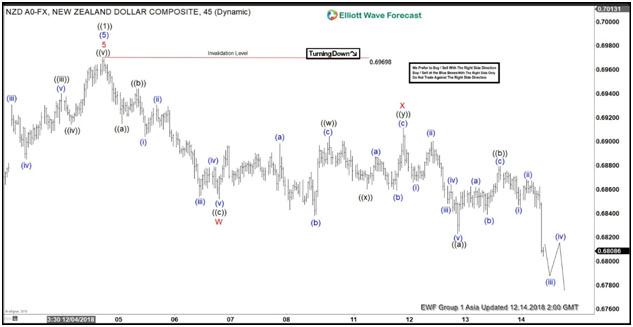
Short Term Elliott Wave view suggests that cycle from Oct 8 low (0.642) has ended at 0.697 high as Primary wave ((1)). Pair is now in the process of correcting the rally from Oct 8 low in 3, 7, or 11 swing within Primary wave ((2)). Decline from 0.6968 is unfolding as a double three Elliott Wave structure where Minor wave W ended at 0.6852 and Minor wave X ended at 0.6911.
Internal of Minor wave W unfolded as a zigzag Elliott Wave structure where Minute wave ((a)) of W ended at 0.6915, Minute wave ((b)) of W ended at 0.6944, and Minute wave ((c)) of W ended at 0.6852. Up from there, Minor wave X of ((2)) ended at 0.691 as a double three Elliott Wave structure where Minute wave ((w)) of X ended at 0.6904, Minute wave ((x)) of X ended at 0.686, and Minute wave ((y)) of X ended at 0.6911. Minor wave Y is now in progress lower as a zigzag Elliott Wave structure where Minute wave ((a)) ended at 0.6822 and Minute wave ((b)) ended at 0.6879. Short term, while rally fails below 0.6968, expect pair to extend lower
NZDUSD 1 Hour Elliott Wave Chart
ECB Review: Hopeful – Not Confident
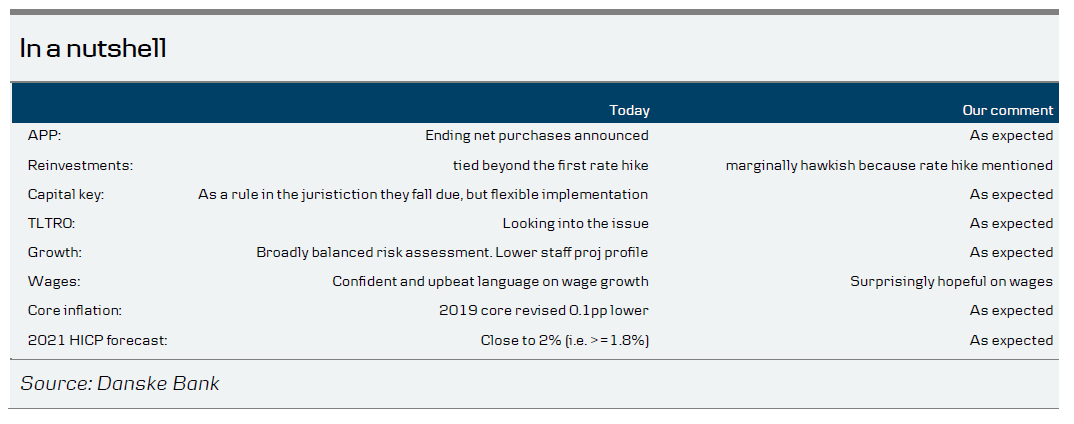
- Today, the ECB formally announced an end to the asset purchase programme by the end of the year. The decision was widely expected, but we find great interest in the fact that the ECB now ties the reinvestment period up to the first rate hike – and that the notion of the next step is a hike from the ECB, which would be a hawkish signal.
- Somewhat downbeat and hopeful message on growth, inflation and wages.
- Markets generally traded within a narrow band, and today’s meeting does not alter our expectation of the ECB hiking rates in December 2019.
Surprisingly soft Draghi
As expected the ECB announced a formal end to its programme, but otherwise sounded relatively dovish. The important growth risk assessment is broadly balanced, though with the significant change of risks moving to the downside. That mirrors the 2011 narrative where ECB changed its risk assessment to be on the downside. Draghi added a risk factor (geopolitics) to the existing risks of protectionism, vulnerabilities in emerging markets andfinancial market volatility.
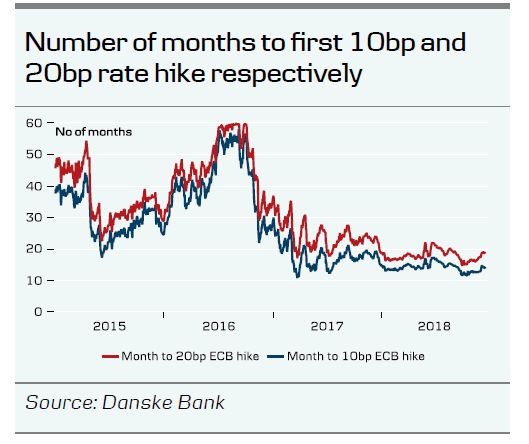
Naturally the focus on reinvestments was high, however, and the ECB did indicate that the redemptions will ‘as a rule’ be reinvested in the jurisdiction in which they fall due, but also allowing for flexible implementation to reflect the new capital key. Furthermore, reinvestment will be placed over 1 year (and not 3-month as now) which will try to avoid steep mispricing in the government bond market. Finally, the ECB will also reinvest below the deposit rate. Regarding the reinvestment period, we got probably the only comment that we consider on the hawkish side as the reinvestments are now tied past the first rate hike. However, it is only hawkish because it confirms that the next move from the ECB is a hike. On TLTRO, there was as expected no new information on this. The ECB reiterated that it is aware of the situation and is looking into this. We have previously argued for TLTROs and expect this to be announced in March next year and implemented in June 2019. Finally, Draghi also said that markets had understood the forward guidance on rates. That comment is somewhat surprising to us as markets currently only point to a 20bp hike inJune 2020.
Slower growth, more gradual core inflation path
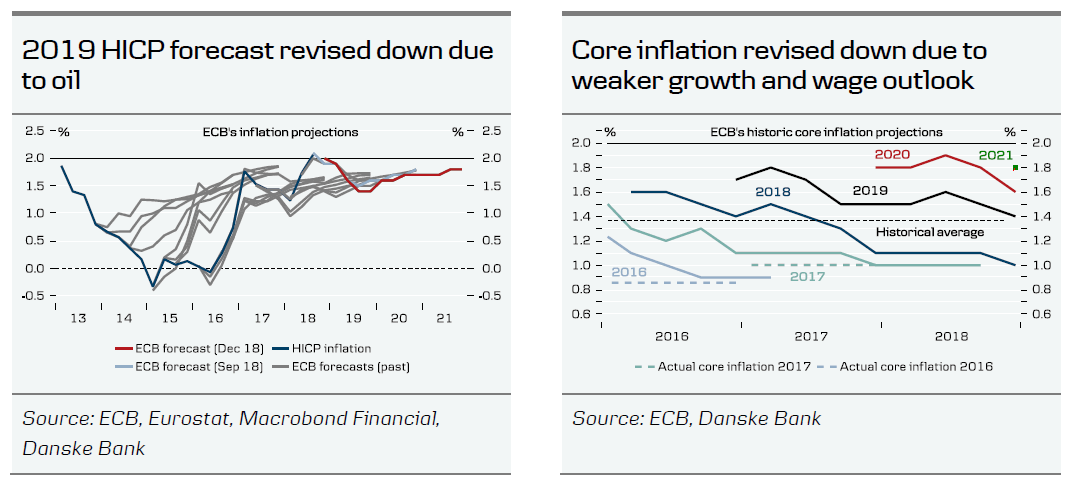
The ECB also released new economic forecasts at the meeting, which - as we expected - saw downward revisions both in the near-term growth and inflation outlooks but unchangedconfidence in the long-term build-up of underlying inflation pressures:
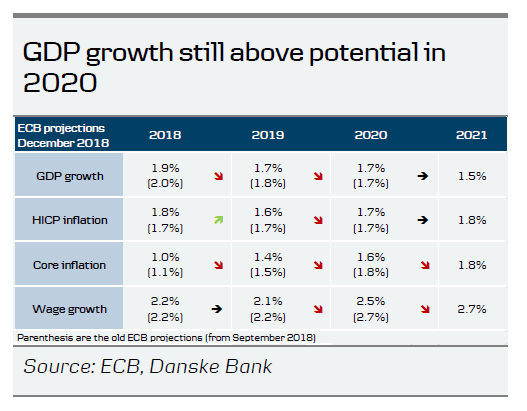
1. Euro area landing on a path closer to potential. Draghi acknowledged that the latest incoming data was weaker than expected, which all else equal suggests slower growth momentum ahead. But domestic demand continues to underpin growth and the key drivers of the recovery are still in place. In light of this, ECB revised down its GDP forecasts for 2018 and 2019 to 1.9% and 1.7%, respectively, but maintained the 2020 forecast at 1.7% (i.e. still growth above potential). In a slight dovish tilt, the balance of risks was now seen moving to the downside (without quite being there!) due to geopolitical factors, protectionism, vulnerabilities in emerging markets and financialmarket volatility.
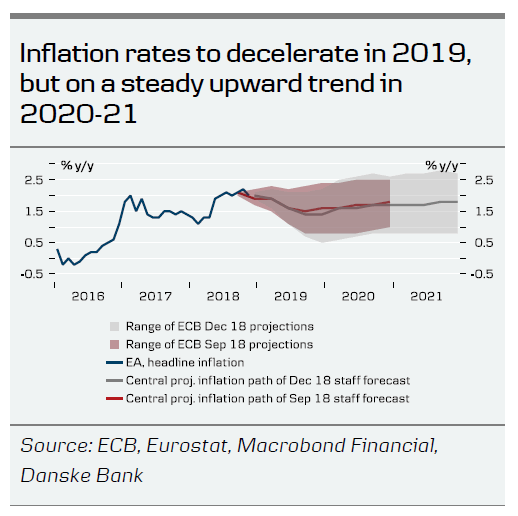
2. Wages will be an uneven inflation force, but core uptick will come. While the ECB expects headline inflation to decrease in the coming months, underlying inflation is expected to increase over the medium term, also due to broad-based wage growth (2.5% y/y in Q3 18 – highest since 2008). Draghi acknowledged that the pass-through from higher wages to core inflation has yet to materialise and cautioned that it might not be uniform across the region, reflecting the different economic conditions in the euro area. Although core inflation forecasts for 2019 and 2020 were revised down, the ECB’s long-term inflation confidence is clearly alive, with core inflation projected at 1.8% by2021.
FX: getting closer to the EUR rebound – but not there just yet
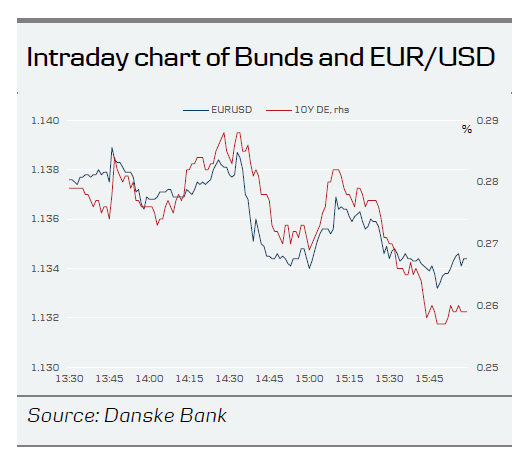
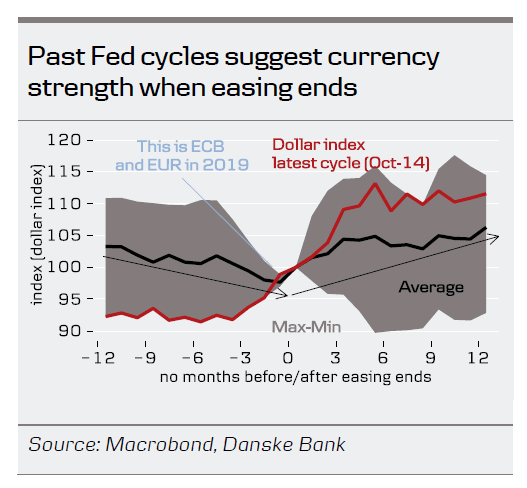
The FX market saw little reaction on the confirmation to end the APP and the introduction of the so-called ‘enhanced’ forward guidance. However, EUR slid initially during the press conference on soft comments from Draghi on the balance of risks. Crucial for the EUR is the fact that forward guidance on rates remained time-dependent which means that rate hikes are not imminent; this, on the one hand, puts a lid on EUR strength near term. However, the fact that reinvestments were linked to the first rate hike is a key hint that the next move from the ECB is higher policy rates which is in itself a hawkish signal and a key cue to the FX market that we are now exiting ‘crisis mode’ in the eurozone; this, on the other hand, puts a floor under EUR. On the whole, today’s ECB messages do not change our view that EUR/USD is a range around 1.13 on 0-3M horizon with potential for a clear rebound mid 2019 into the 1.20s. We are long USD carry at present but positioned for a EUR/USD rebound beyond Q1 via options in our FX Top Trades 2019 - our guide on howto position for the coming year, 4 December 2018.
A ‘balanced’ view
The ECB December meeting has previously been bearish for rates. In 2016, 10Y German government bond yields rose some 20bp at the start of December. In 2017, 10Y German government yields rose some 50bp. However, today the ECB struck a much more balanced tone and given the comments on the reinvestments, there will still be a strong bias towards buying German government bonds in 2019 by the ECB. We expect that the ECB will have to reinvest some EUR40bn in German government bonds in 2019. Thus, it is difficult tosee the same negative reaction in the Bunds as we saw in 2017.
Looking forward then the range-trading we have seen in Bunds between 0.25% to 0.75% since mid-2016 is likely to continue well into 2019.
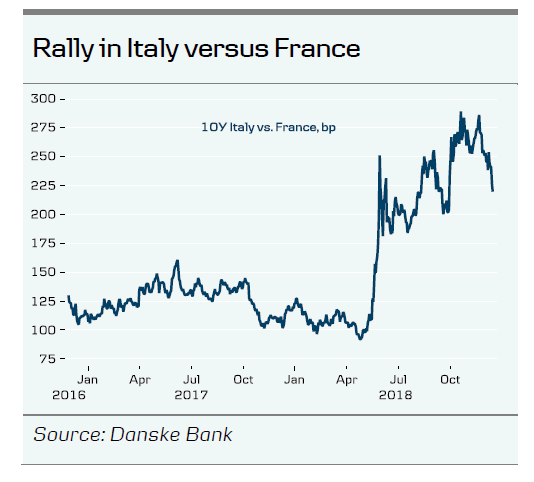
Given that the ECB is moving very slowly, there is also plenty of support for the peripheral markets going into 2019 even though there was limited discussion on TLTROs. Hence, the rally we have seen recently in e.g. Italy is likely to continue into next year especially as the Italian government has been much more ‘constructive’ on the budget deficit for 2019. However, there is still a significant supply as well as overinvestment in Italian government bonds, and over time the ECB should reinvest less in Italy. Thus, we still need to have a high risk premium on the Italian government bonds relative to core-EU bonds and it is difficult to see the 10Y spread between Italy and Germany moving much below 250bp inthe short term.
Market Morning Briefing: Euro Is Trading Near Resistance At 1.14
STOCKS
No huge movements yesterday (understandable), but a hardworking day for the Bulls nevertheless. They still have an uphill task in the face of growing concern of a global slowdown. Big question is, how much of that is already priced into the markets?
A small positive close on the Dow (24597.38, +0.29%) after a relatively indecisive, less volatile, but possibly bullish day.
The Nikkei (21816, +0.99%) saw a recent rise yesterday. It night slowly try to break above 22000-22500 while it remains above 21000.
Good, respectable rise in the Shanghai (2634) also yesterday, testing crucial Resistance at 2650 and raising chances of a good upmove towards 2700 also, if it manages to remain above 2600 through next week.
It will be interesting to see what the Nifty (10791.55) does today, as it has tested but closed below super-crucial Resistance at 10850. We are allowing for a dip towards 10300, but a break above 10850 will be a strong bullish statement.
The DAX (10925, -0.04%) closed largely unchanged yesterday. It still remains the most vulnerable to bearishness while below 11200.
COMMODITIES
News states fall in stockpiles at a delivery hub in Oklahoma while the supply deficit is projected for the second quarter of 2019 by the IEA.
Brent (60.98) is almost stable while WTI (52.36) has risen slightly. Some rise in the crude prices look likely in the medium term as technically there is not much room on the downside below 58 and 56 respectively for Brent and WTI.
Gold (1246.30) and Silver (14.78) are stable just now. Copper (2.7515) is headed towards 2.85/88 in the near term from where a fall could be expected.
FOREX
Currencies continue to trade in the narrow range. Some contraction is likely to be seen next week before sharp movements come in.
Dollar Index (97.17) could see 2-3 sessions of contraction within 97.30-96.75 before breaking sharply on either side.
Euro (1.1358) is trading near resistance at 1.14 and the currency is likely to come off in the near term towards 1.13-1.12. As mentioned earlier, 1.15-1.12 is the range for the next 1-2 weeks.
Dollar Yen (113.48) rose towards 113.71 yesterday but has dipped a bit from there. 21-Day MA is seen near 113.10 and while that holds, a rise towards resistance at 114 is possible before coming off from there back towards 113.0-112.5 levels.
Euro-Yen (128.90) came off from 129.25 yesterday. While Dollar Yen and Euro are trading in a narrow sideways zone, Euro-Yen is also likely to remain ranged within the 128.0-129.6 region. 129.50/60 is an immediate resistance and while the pair trades lower, a test of 128 is possible pulling down Euro also towards 1.13-1.12.
Pound (1.2625) has dipped slightly as expected. While below 1.27, a fall towards 1.25-1.24 is on the cards.
Aussie (0.7185) has come off sharply and could head towards 0.71-0.70 in the near term if it breaks below 0.7150.
Dollar Rupee (71.69) could see a test of 71.45 today from where a decent bounce back towards 71.80 is possible. The NDF quotes lower at 71.53 just now.
INTEREST RATES
US 10-2 spread steepened a little more to +14bp, as the 2Yr dipping a bit to 2.76% while the 10Yr remained stable at 2.90%. However, the 5-2 spread inverted again to -2bp (from 0% a day ago) as the 5Yr dipped to 2.74%. Seems Curve Steepening is an uphill task as the global slowdown theme is still very strong.
Both the ECB and PBOC also talked about slower growth.
The ECB left rates unchanged, said bond purchases will come to an end this year, maturity proceeds will continue to be invested back and interest rate increases are still a long way off.
In a welcome development, the Italian bond yields dropped a decent bit as Italy came up with a smaller than expected budget deficit.
The 10Yr GOI (7.4082%) has dipped as expected. A break below 7.40% if seen would take the yield lower towards 7.20% in the near term. Else some ranged movement in the 7.40-7.60% region is possible.
USD/JPY Approaching Significant Resistance Near 114.00
Key Highlights
- The US Dollar climbed higher recently and traded above the 113.00 resistance against the Japanese Yen.
- There was a break above a major bearish trend line with resistance at 113.24 on the 4-hours chart of USD/JPY.
- The US Initial Jobless Claims for the week ending Dec 08, 2018 declined from 233K (revised) to 206K.
- Today, the US Retail Sales figure for Nov 2018 will be released, which is forecasted to rise 0.2% (MoM).
USDJPY Technical Analysis
The US Dollar recovered nicely during the past few days and traded above 112.50 and 113.00 resistances against the Japanese Yen. The USD/JPY pair is now approaching a crucial hurdle near 114.00-114.20.
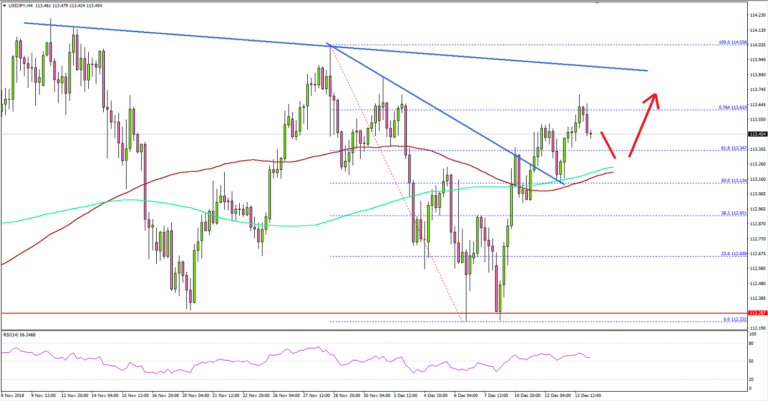
Looking at the 4-hours chart, the pair started a solid recovery after trading as low as 112.32. The pair bounced back above 113.00 and the 61.8% Fib retracement level of the last drop from the 114.03 high to 112.23 low.
Moreover, there was a close above the 113.00 level and the 100 simple moving average (red, 4-hours). The pair is now placed nicely above 113.00 and it seems like it could retest the 114.00 resistance area, which acted as a hurdle for buyers on many previous occasions.
If there is a proper break above 114.00 and 114.20, the pair may climb towards 115.00. If not, the pair could decline once again below 113.00 and the 100 SMA.
Fundamentally, the US Initial Jobless Claims figure for the week ending Dec 08, 2018 was released by the US Department of Labor. The market was looking for a decline from the last reading of 231K to 225K.
However, the result was positive as there was a decline in jobless claims to 206K. However, the last reading was revised up from 231K to 233K. The report added that:
The 4-week moving average was 224,750, a decrease of 3,750 from the previous week’s revised average. The previous week’s average was revised up by 500 from 228,000 to 228,500.
Overall, the US Dollar remained in a positive zone and increased selling pressure on pairs like EUR/USD, GBP/USD and AUD/USD.
Economic Releases to Watch Today
- Germany’s Manufacturing PMI for Dec 2018 (Preliminary) – Forecast 52.0, versus 51.8 previous.
- Euro Zone Manufacturing PMI Dec 2018 (Preliminary) – Forecast 52.0, versus 51.8 previous.
- Euro Zone Services PMI for Dec 2018 (Preliminary) – Forecast 53.5, versus 53.4 previous.
- US Manufacturing PMI for Dec 2018 (Preliminary) – Forecast 55.4, versus 55.3 previous.
- US Services PMI for Dec 2018 (Preliminary) – Forecast 54.7, versus 54.7 previous.
- US Retail Sales Nov 2018 (MoM) – Forecast +0.2%, versus +0.8% previous.
- US Industrial Production Nov 2018 (MoM) – Forecast +0.3%, versus +0.1% previous.
Daily Markets Broadcast
Wall Street ends mixed, trades sideways
US indices closed mixed yesterday, giving back some early gains, as uncertainties surrounding trade wars and global growth remain. ECB downgrades growth forecasts, while Theresa May continues to work on Brexit.
US30USD Weekly Chart
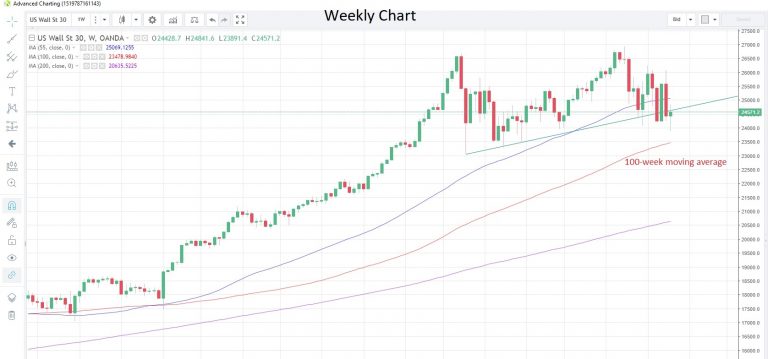
The US30 index rallied for a second day yesterday and has started positively today
The 100-week moving average at 23,479 remains untested since November 2016
Growth in retail sales is expected to slow to +0.2% m/m in November, sharply lower than the +0.8% seen in October. The December Markit manufacturing PMI is expected to tick higher to 55.4 from 55.3
DE30EUR Daily Chart
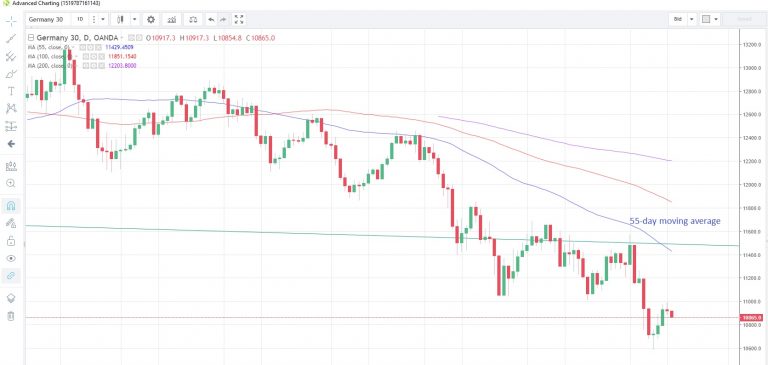
The Germany30 index snapped a three-day rising streak yesterday, closing marginally in the red as ECB’s Draghi announced a downgrade to EU growth prospects
The 55-day moving average is at 11,430. This average has capped prices on a closing basis since August 29
Euro-zone December Markit manufacturing PMI is expected to edge higher to 52.0 from 51.8 the previous month. A bigger jump could help to stall the index’s slide.
UK100GBP Daily Chart
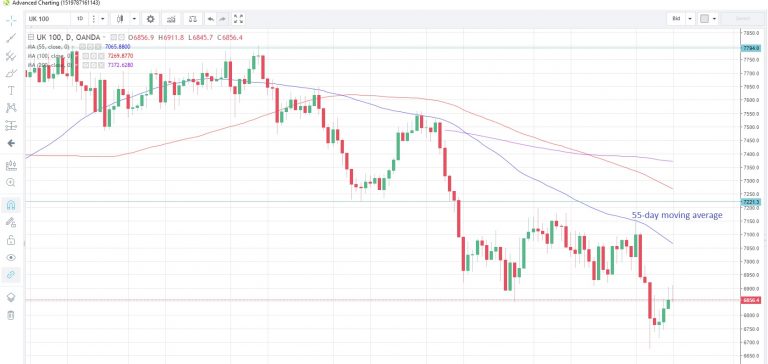
UK shares fell for the first time in four days yesterday, closing almost flat on the day, as PM May was in Brussels seeking assurances at the EU Brexit summit regarding the Irish border
The 55-day moving average at 7,066 continues to cap the index, as it has done on a closing basis since August 10
UK press is reporting that certain senior Conservative lawmakers are attempting to persuade PM May to resign next Spring.