Sample Category Title
BoJ opinions: Sees tariff risks but maintains flexible rate-hike stance
BoJ’s Summary of Opinions from its April 30–May 1 meeting revealed a generally cautious view on the impact of US tariffs, with board members acknowledging the potential economic damage but not seeing it as enough to derail the pursuit of the 2% inflation target.
One member noted that BoJ may enter a "temporary pause" in rate hikes due to weaker US growth. But it's emphasized that "it shouldn't be too pessimistic".
The member emphasized that rate hikes could resume if conditions improve or US policy shifts.
Other opinions highlighted the high level of uncertainty facing Japan’s economic and price outlook, driven largely by global trade tensions. One board member noted the policy path “may change at any time.”
Another reaffirmed that there has been "no change to the BoJ's rate-hike stance", as projections continue to show inflation reaching the 2% target and real interest rates remain deeply negative.
Fed’s Goolsbee warns tariff truce still carries stagflation risk
Chicago Fed President Austan Goolsbee welcomed the weekend’s US-China tariff agreement as a step in the right direction but cautioned that its limited scope offers only modest relief.
In an interview with the New York Times, he said the temporary 90-day reduction in tariffs would be “less impactful stagflationarily than the path they were on.”
But that still represents a significant burden on the economy. With tariffs remaining three to five times higher than pre-trade war levels, Goolsbee warned the deal would still "make growth slower and make prices rise", hallmarks of a stagflationary environment.
Given the persistent uncertainty surrounding US trade policy, Goolsbee reiterated his support for a wait-and-see approach on interest rates. He noted that the Trump administration’s statements acknowledge the temporary nature of the current truce. "It’s going to be revisited in the near future,” he said.
ECB officials signal cautious path to June cut
Latvian ECB Governing Council member Martins Kazaks indicated overnight that a rate cut in June remains a “pretty possible step,” aligning with market expectations, provided upcoming data confirms progress toward anchoring inflation around the 2% target.
Kazaks added that "gradual cautious cuts could come upon the anchoring of inflation to around the 2% target."
Meanwhile, German and Spanish ECB members Joachim Nagel and Jose Luis Escriva added a note of caution in a joint interview, warning that US President Donald Trump’s aggressive tariff policies have clouded the economic outlook.
“Regarding monetary-policy decisions, it is important to be cautious and not to overreact by overemphasizing specific announcements that could change shortly afterwards,” Nagel emphasized
BoE’s Taylor defends 50bps cut, cites perilous trade climate and weak demand
BoE MPC member Alan Taylor explained his decision to vote for a 50bps rate cut last week, warning that both global and domestic conditions have deteriorated significantly.
He pointed to a “quite perilous” international trade environment, driven in large part by broader-than-expected US tariffs. Also, "the erosion of confidence that we saw has continued", he added, with low readings in business surveys like the PMI and REC, along with signs of increased precautionary saving and delayed investment.
Taylor also called the recent UK-US trade deal “quite slender,” noting that most British exports will still face a 10% tariff, offering little near-term relief for exporters.
Taylor warned that waiting for complete confirmation that all inflation pressures had eased before easing policy further could leave BoE behind the curve.
Rising After The Thaw: China’s Economy Post-Trade Truce
Summary
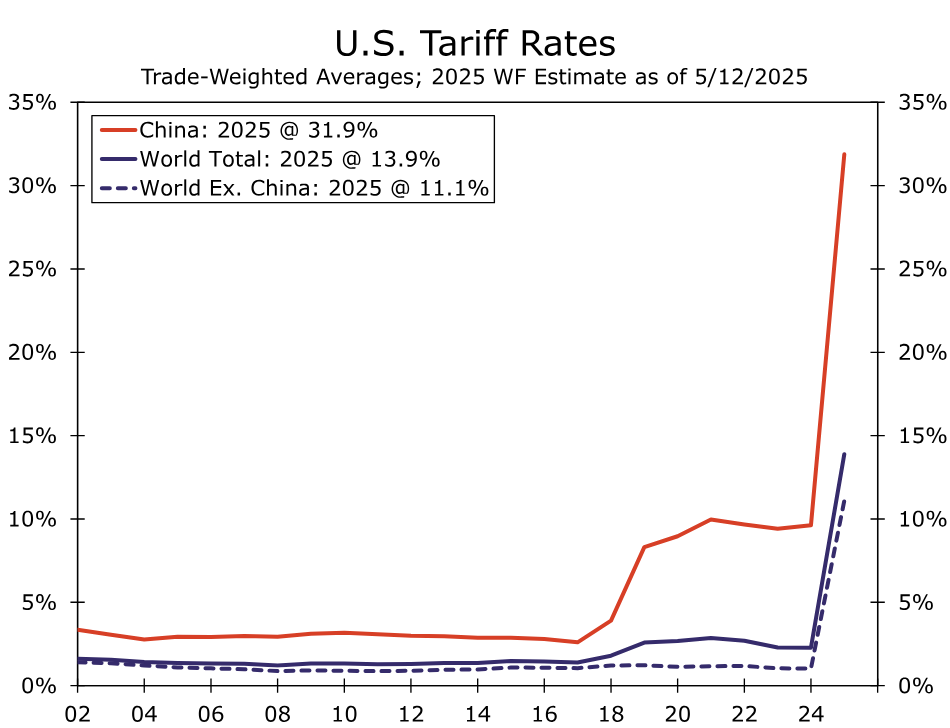
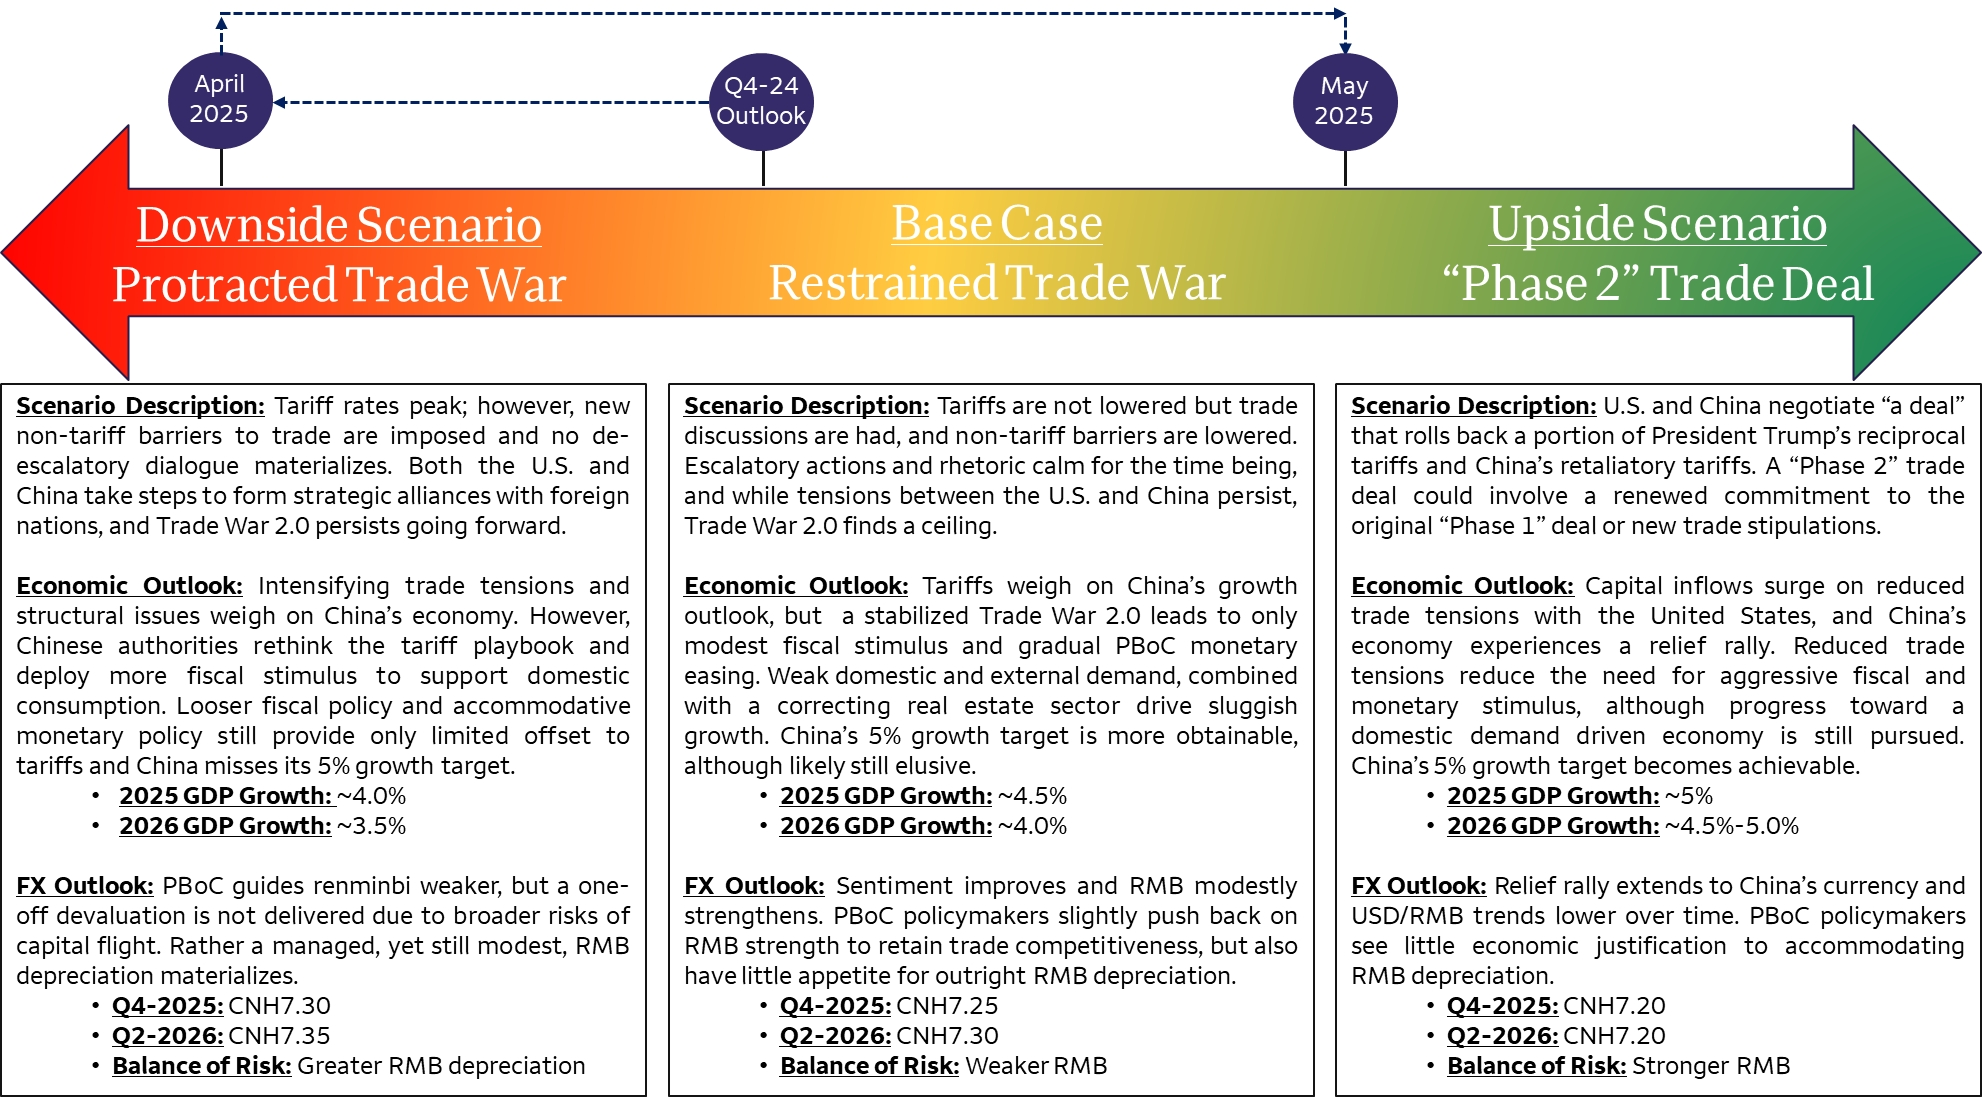
The U.S. and China agreed to temporarily roll back tariff rates on each other this past weekend. “Temporary” defined as a trade truce for the next 90 days, which despite being provisional, is significant given the harsh escalation in tensions just a month ago. Trade developments between the U.S. and China have once again moved quickly, and while the thawing of tensions is far from permanent at this time, developments have now shifted U.S.-China relations under the Trump administration into our upside scenario. Should developments continue along this new trajectory we now believe China's economy may be able to achieve the government's 5% growth target and the renminbi may stabilize at a stronger level.
Crude Oil: Trade Optimism Fuels Price Gains, What Comes Next?
- Brent Oil surges 4% on US-China tariff reductions, boosting market optimism.
- Saudi Aramco and Russia's Central Bank express confidence in oil market stability.
- Technical analysis suggests potential resistance at 66.44 and 68.71 for Brent Crude.
- Client sentiment data shows a strong long position on WTI, signaling a possible price decline.
Oil prices surged 4% on Monday after the U.S. and China announced plans to ease some tariffs, sparking optimism about ending their trade war as the top two crude oil consumers.
Markets seem more at ease following the announcement and this was echoed by Saudi Aramco and Russia's Central Bank. Aramco stated in an earnings conference call that Oil fundamentals remain sound despite recent volatility with the Oil giant touting growth for Q2.
Similar sentiment has emerged from Russia Central Bank who said they expect Oil prices to stabilize above $60/barrel as trade tensions ease. This could be seen as a sign that sentiment has undoubtedly improved.
US-China trade developments
Markets are taking their cues from US-China developments, but what were the key takeaways from this weekend's meeting.
The US and China have agreed to lower tariffs on each other’s goods for 90 days to ease trade tensions. US tariffs on Chinese imports dropped from 145% to 30%, while Chinese tariffs on US goods were reduced from 125% to 10%.
President Trump has been commenting on the deal, stating that the agreement doesn't cover tariffs on cars, steel, aluminum or pharmaceuticals. The President will speak to China’s President Xi at the end of the week.
The President is hoping that China will open up markets to US businesses.
Looking below at the Fear and Greed chart and you can see that sentiment has turned positive and is now in greed territory. Another sign that markets are optimistic about the future after the weekend.
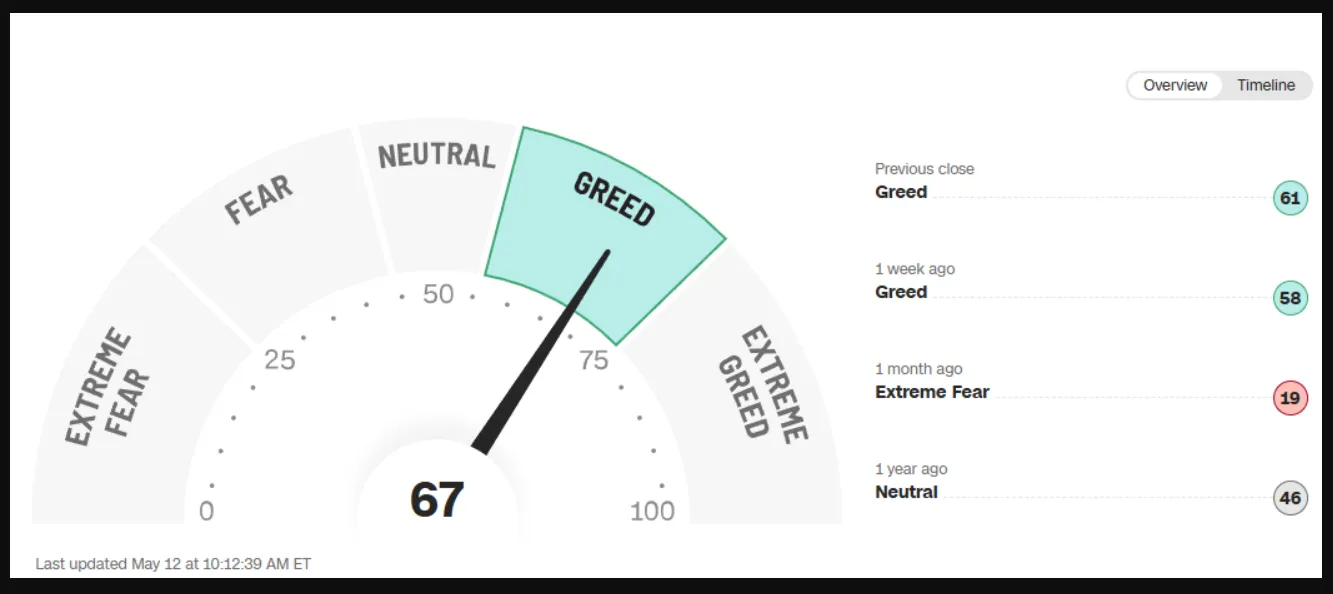
Source: FinalcialJuice
Technical Analysis - Brent Crude
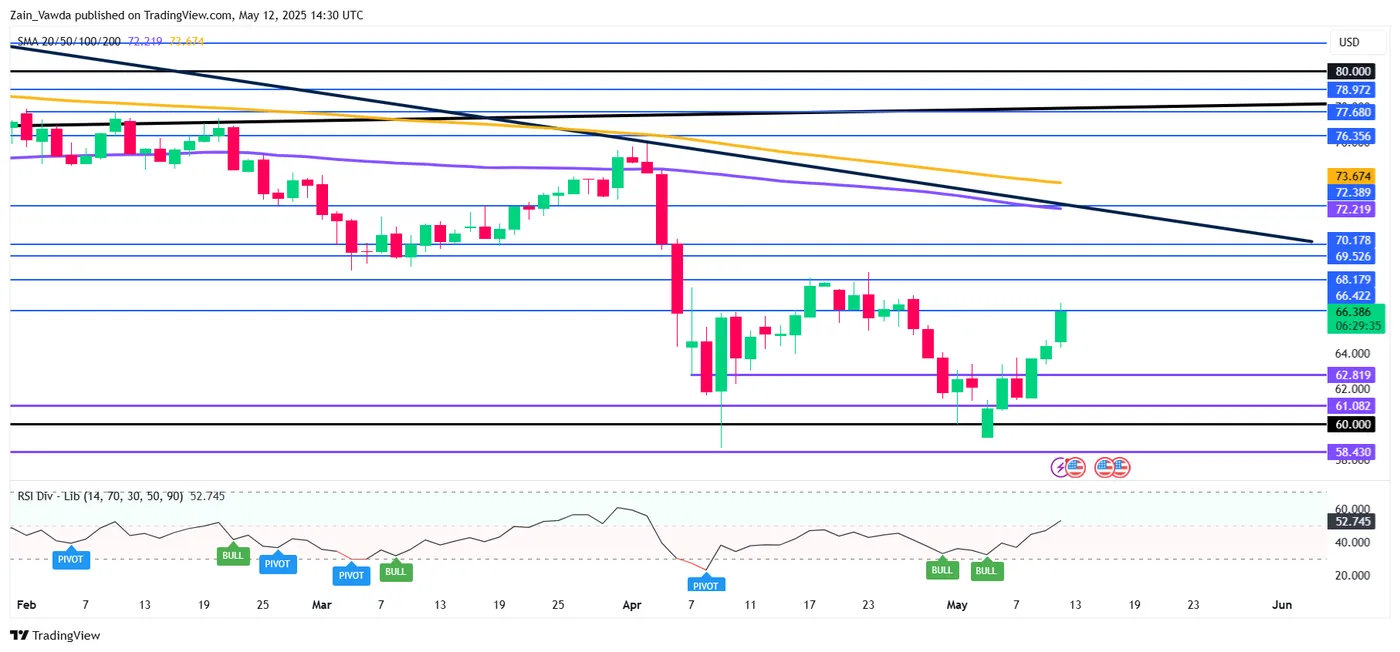
From a technical analysis standpoint, Brent has pushed higher since bottoming out on May 5.
Looking at price action and market dynamics, the RSI period-14 has crossed above the 50 neutral handle. This is usually a sign of a shift in momentum from bears to bulls.
A bullish move from here may find resistance at 66.44 and 68.71 respectively.
A move lower high may find support at 64.00 and 62.81 may come into focus.
Brent Crude Oil Daily Chart, May 12, 2025
Source: TradingView (click to enlarge)
Client Sentiment Data
Looking at OANDA client sentiment data and market participants are net-long on WTI with 75% of traders holding long positions. I prefer to take a contrarian view toward crowd sentiment and thus the fact that so many traders are long means WTI prices could decline further.
Dow Jones Surges as Trade Deal Boosts Risk Appetite
Dow is trading at the highest in nearly six weeks at the start of the US session on Monday, after it opened with a gap-higher in Asia and advanced around 1.3% since then.
The latest trade deal between US and China provided strong relief to the markets and boosted risk sentiment, after highly volatile conditions in past few weeks, driven by fears of global trade war and all negative consequences it may cause.
The sentiment started to improve after the US made agreements with a number of countries, including Japan, South Korea, India and United Kingdom) with deal with the biggest trading partner and the second largest world economy – China, boosting prospects for stronger economic growth.
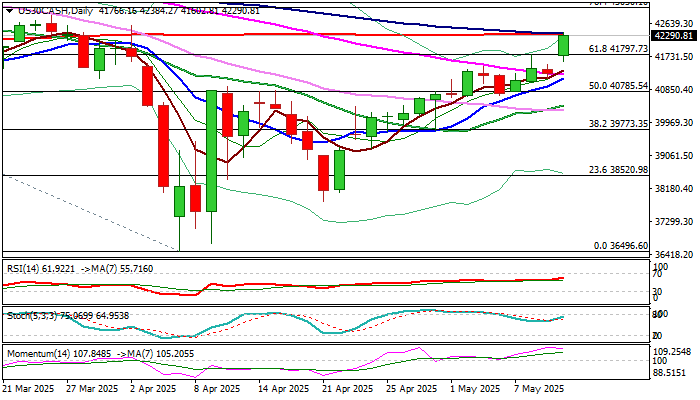
The Dow Jones entered the fourth consecutive week of gains and emerged above weekly cloud top (42096), with the action on daily chart testing converged 100/200DMA’s (42356).
Bulls may show hesitation at this point as fading bullish momentum indicates, though strong positive sentiment is expected to keep bulls firmly in play, with shallow dips rather to mark positioning for fresh push higher than to signal correction.
Broken Fibo 61.8% of 45024/36496 (41797) and session low (41600) offer good supports where dips should find firm ground, guarding supports at 41257 (55DMA) and 41141 (10DMA).
Res: 42356; 42570; 42834; 43050
Sup: 41960; 41600; 41257; 41141
USDJPY Wave Analysis
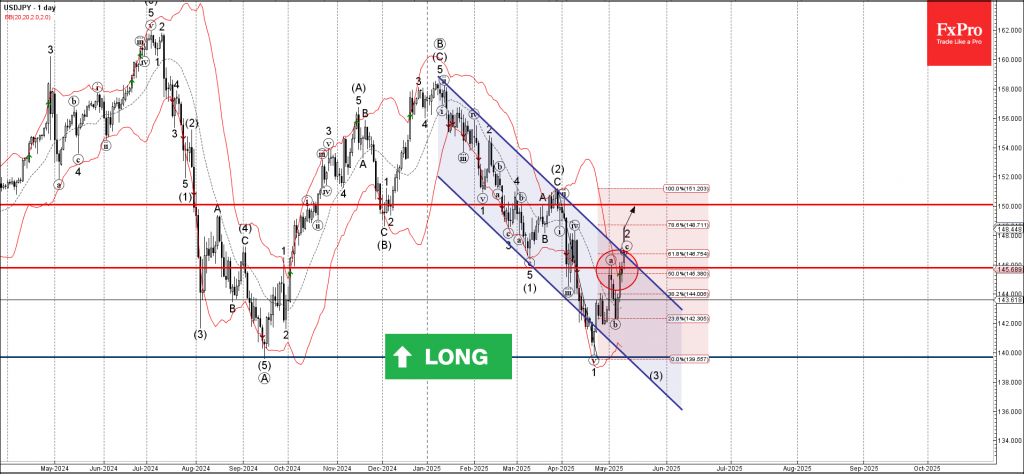
USDJPY: ⬆️ Buy
- USDJPY broke the resistance area
- Likely to rise to resistance level 150.00
USDJPY currency pair continues to rise strongly inside the c-wave, which recently broke the resistance area between the resistance level 146.00 (top of the previous wave a), 50% Fibonacci correction of the downward impulse from March and the resistance trendline of the daily down channel from January.
The breakout of this resistance area accelerated the minor c-wave of the active ABC correction (2) from the end of April.
USDJPY currency pair can be expected to rise to the next resistance level 150.00 (target price for the completion of the active c-wave).
USDCHF Wave Analysis
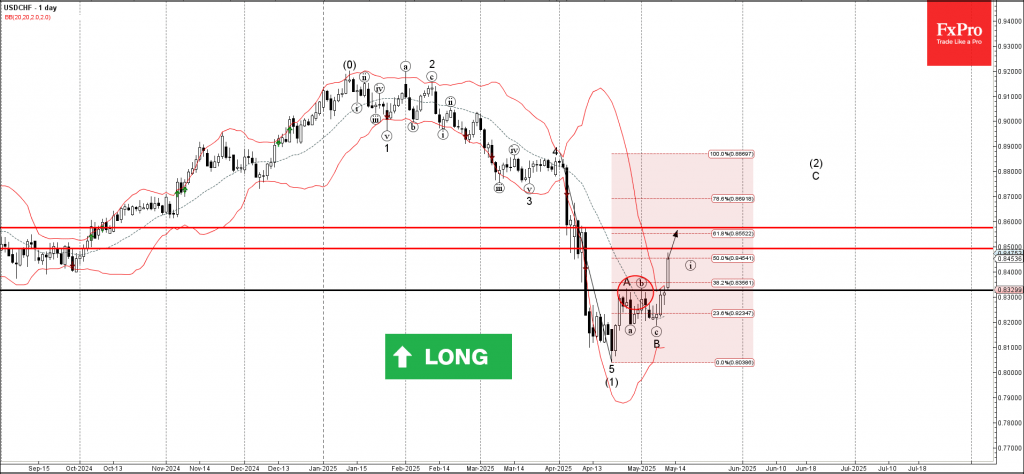
USDCHF: ⬆️ Buy
- USDCHF broke resistance area
- Likely to rise to resistance levels 0.8500 and 0.8600
USDCHF currency pair recently broke the resistance area between the resistance level 0.8325 (which stopped the previous waves A and (b)) and the 38.2% Fibonacci correction of the downward impulse 5 from April.
The breakout of this resistance area accelerated the C-wave of the active ABC correction (2) from the middle of last month.
Given the strongly bullish US dollar sentiment seen today, USDCHF currency pair can be expected to rise to the next resistance levels 0.8500 and 0.8600.
Dow Jones Wave Analysis
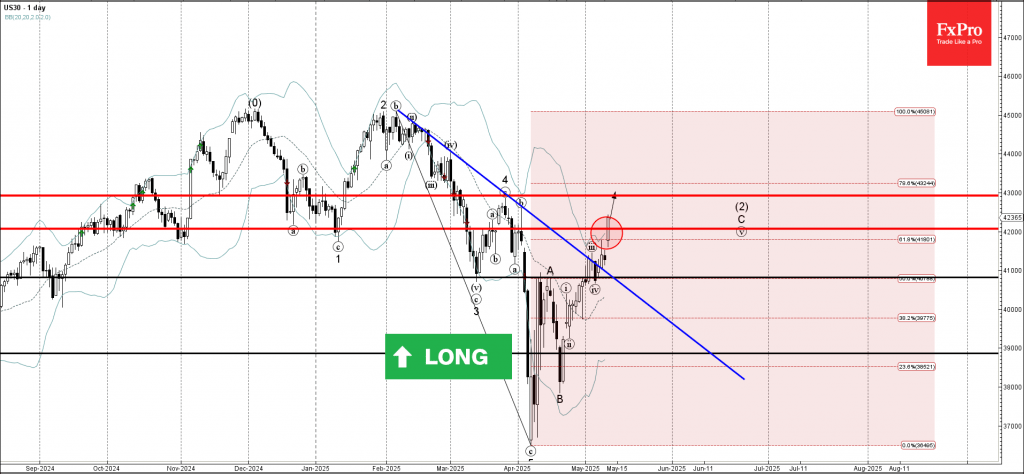
Dow Jones: ⬆️ Buy
- Dow Jones broke the resistance area
- Likely to rise to resistance level 43000.00
Dow Jones index recently broke the resistance area between the resistance level 42000.00, 61.8% Fibonacci correction of the downward impulse from February and the resistance trendline from the same month.
The breakout of this resistance area accelerated the C-wave of the active ABC correction (2) from the start of April.
Dow Jones index can be expected to rise to the next resistance level 43000.00 (former top of wave 4 from March).