

Sample Category Title
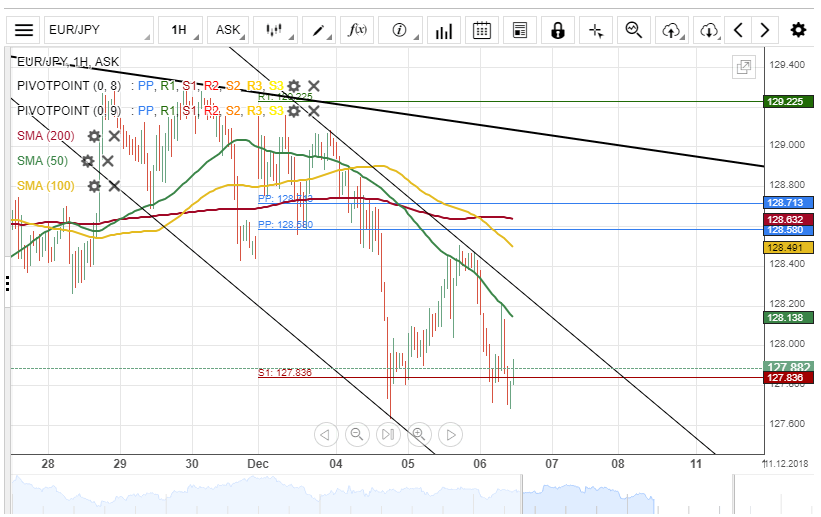
EUR/JPY Bears Market Today
The common European currency appreciated about 70 base points against the Japanese Yen on Wednesday. The surged was stopped by a resistance level formed by the 50-hour simple moving average at 128.40.
Thursday's trading session began with a strong bearish momentum, and by the middle of the session, the EUR/JPY currency pair has plunged by about 74 base points.
Everything being equal, it is likely that the 50-hour SMA could pressure the currency exchange rate down towards a support cluster formed by the weekly and the monthly PPs at 127.27 today.
AUD/USD Decline Likely To Continue
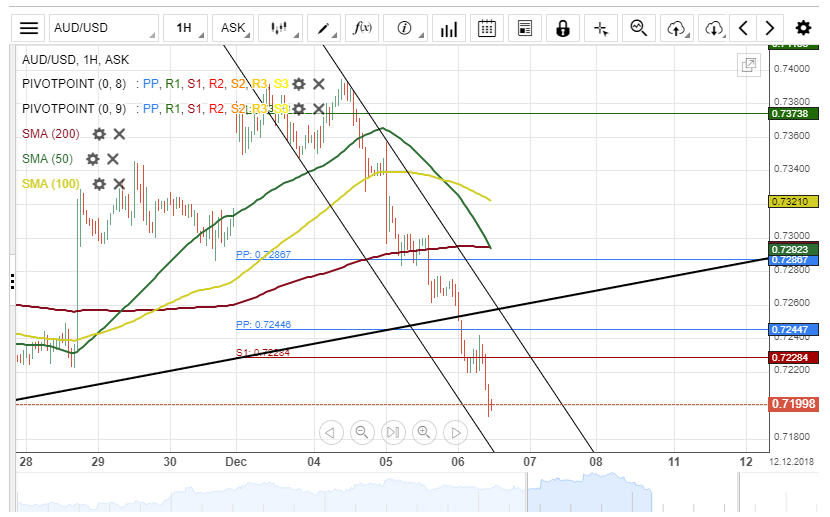
The Australian Dollar declined on Wednesday against the US Dollar until it reached the bottom border of a dominant ascending channel at 0.7260. Meanwhile, the currency pair passed the support level during the Asian session on Thursday.
Regarding the near future, traders need to watch whether the weekly S1 at 0.7228 is broken or not. If the exchange rate passes the support level, it will aim at a cluster set by the combination of the weekly and the monthly PPs near the 0.7144 area.
On the other hand, if the support level holds, the currency exchange rate will target a resistance line formed by the 200-hour simple moving average at 0.7294 during the following trading session.
USD/CAD Awaits Macroeconomic Data Releases
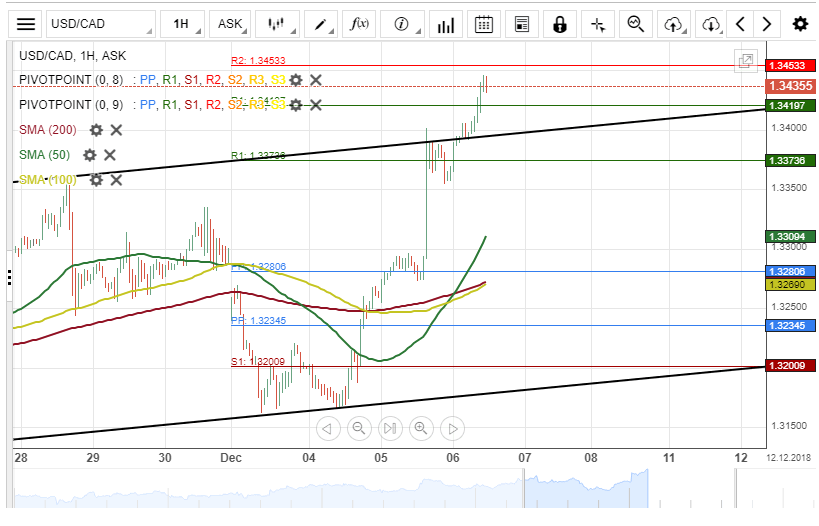
The surge of the US Dollar against the Canadian Dollar has extended on Thursday, as the currency pair had reached about the 1.3400 mark during the first part of today's trading session.
However, it is expected that the USD/CAD currency pair makes a brief retracement towards a support level formed by the 50-hour simple moving average and the weekly PP at 1.3280 within this session.
Meanwhile, it is important to note that the Canadian Macroeconomic Data releases scheduled at 13:30 GMT could play a significant roll in the positioning of the currency exchange rate today.
NZD/USD Awaits US Data Releases
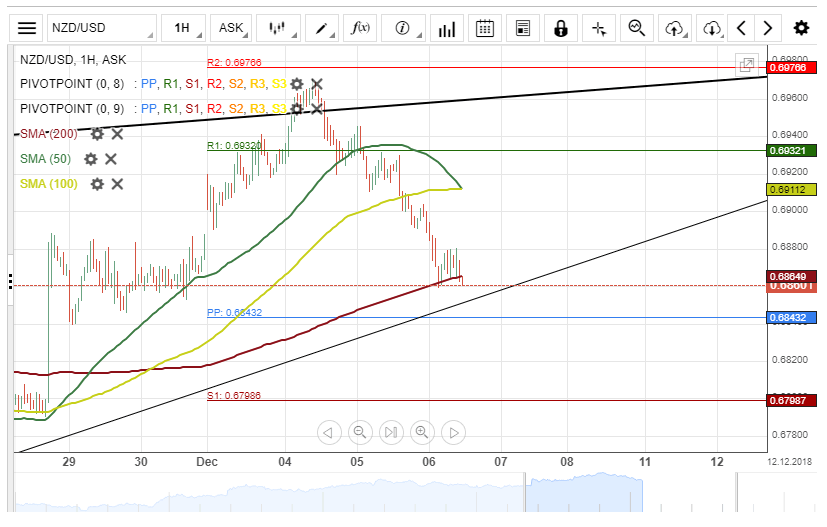
Bears continue their dominance in the market for the NZD/USD currency pair. During the first part of Thursday's session, the exchange rate tested the 200-hour simple moving average at 0.6863.
If this support level formed by the 200-hour SMA holds, the pair could aim for a re-tests of the weekly R1 at 0.6932.
However, if the pair passes the support line, a potential breakout through the lower boundary of an ascending channel at 0.6843 is likely to occur.
Meanwhile, the US macroeconomic data releases schedule at 15:00GMT could change the overall positioning of the currency exchange rate.
WTI OIL Outlook: Oil Price Falls Back Towards $50 Support After Recovery Was Repeatedly Rejected, OPEC Meeting In Focus
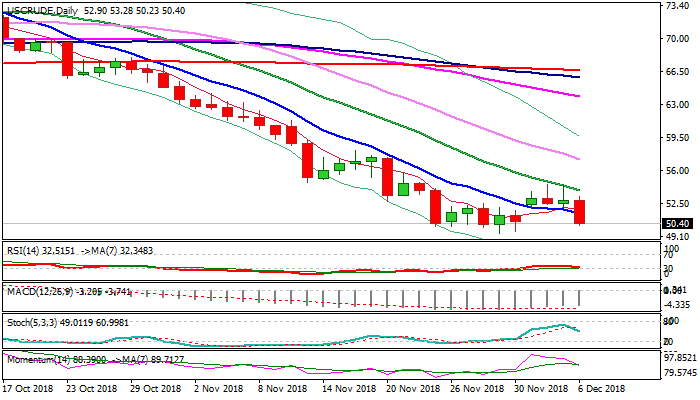
WTI oil fell on Thursday, reversing so far the largest part of recent $49.40/$54.54 recovery rally, driven lower by slide in stock market and uncertainty about the outcome of OPEC meeting.
The cartel announced the readiness to cut the output (between 1 and 1.4 mln bpd, but awaiting decision from Russia.
Optimistic tone prevails on expectations for Russian decision on Friday, as the amount of reduction would also depend on Russian contribution and decision about how the cut will be distributed would signal the size of total reduction (1 – 1.4 mln bpd).
On the other side, the decision for reduced output faces strong opposition from the US President Trump, who favors lower oil prices and has already put pressure on Saudi Arabia.
Today’s fall was signaled by double upside rejection at $54.50 zone (Tue/Wed) and helped by strong negative momentum.
Immediate risk is seen for retest of psychological $50 support, dented on spikes to $49.64/40 last week, but without close below, which keeps the support valid.
Sustained break below $50 pivot would signal continuation of larger downtrend (oil price was down 34% since early Oct) which could extend towards Fibo support at $45.46 (61.8% of $26.04/$76.88 ascend).
Conversely, bullish scenario requires sustained break above falling 20SMA ($53.91) to signal recovery.
Res: 51.52, 52.14, 53.28, 53.91
Sup: 52.23, 50.00, 49.40, 49.00
USDJPY Moving Towards Key Support
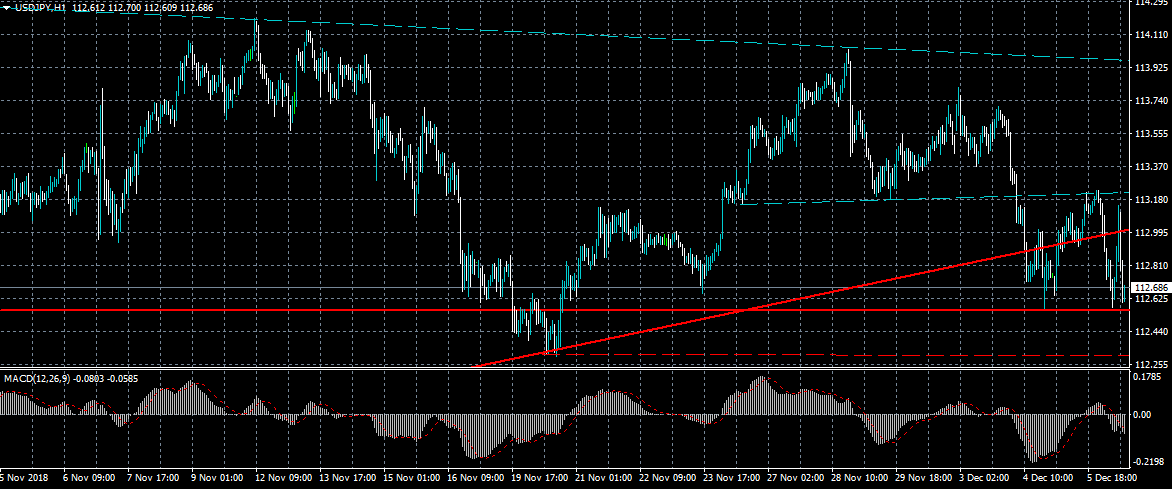
The US dollar continues to move lower against the Japanese yen, with the risk-sensitive pair increasingly volatile during the European trading session. A breach of the 112.50 support level is likely to trigger the next down move in the USDJPY pair, with sellers then targeting the November trading low. Traders now await the US ADP private sector jobs report and a scheduled speech from FED Chair Jerome Powell.
The USDJPY pair is strongly bearish while trading below the 112.50 level, key support remains at the 112.30 and 111.50 levels.
If the USDJPY pair moves above the 113.15 level, key resistance is then found at the 113.50 and 113.90 levels.
EURUSD Trading In Narrow Range
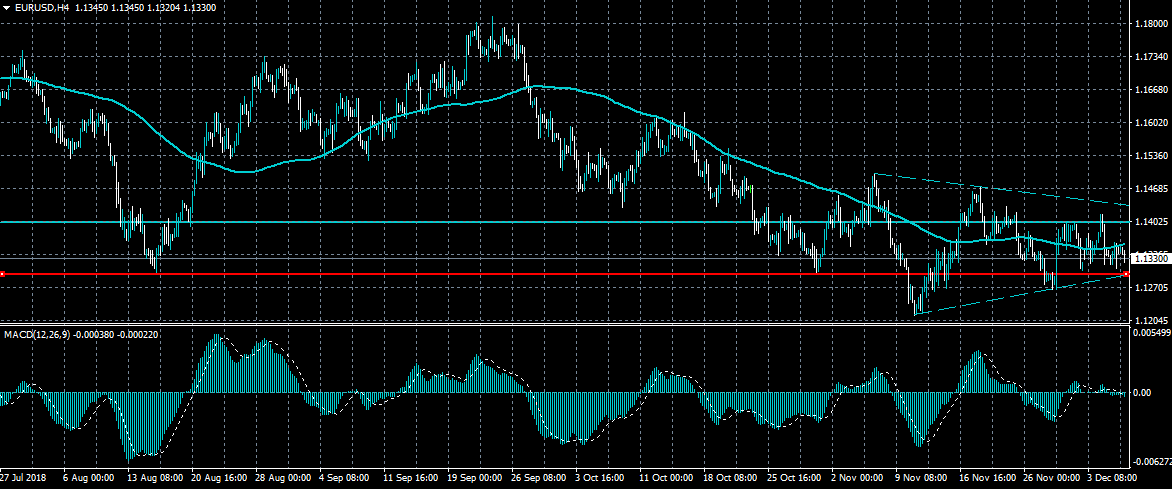
The euro continues to trade in a narrow range against the US dollar, with price remaining trapped in a symmetrical triangle pattern. The EURUSD pair is likely to remain cautious ahead of a speech from FED Chair Jerome Powell later today, and the release of the US monthly jobs report. Technical indicator remains neutral, although price-action on the EURUSD pair is currently bearish.
The EURUSD pair is bearish while trading below the 1.1300 level, key technical support is found at the 1.1270 and 1.1216 levels.
If the EURUSD pair trades above the 1.1360 level, buyers may test the 1.1400 and 1.1425 levels.
The Analytical Overview Of The Main Currency Pairs
The EUR/USD currency pair
Technical indicators of the currency pair:
Prev Open: 1.13413
Open: 1.13473
% chg. over the last day: +0.04
Day's range: 1.13209 – 1.13324
52 wk range: 1.1299 – 1.2557
The currency pair is showing an ambyhous technical picture. The quotes are trading in flat. Yesterday the stock markets were closed in honor of George H.W. Bush. The local support and resistance levels are 1.13200 and 1.13450. Positions should be opened from these levels. The investors are waiting for the reports from the US.
The Economic News Feed for 06.12.2018:
ADP Nonfarm Employment Change (US) – 15:15 (GMT+2)
ISM Non-Manufacturing PMI (US) – 17:00 (GMT+2)
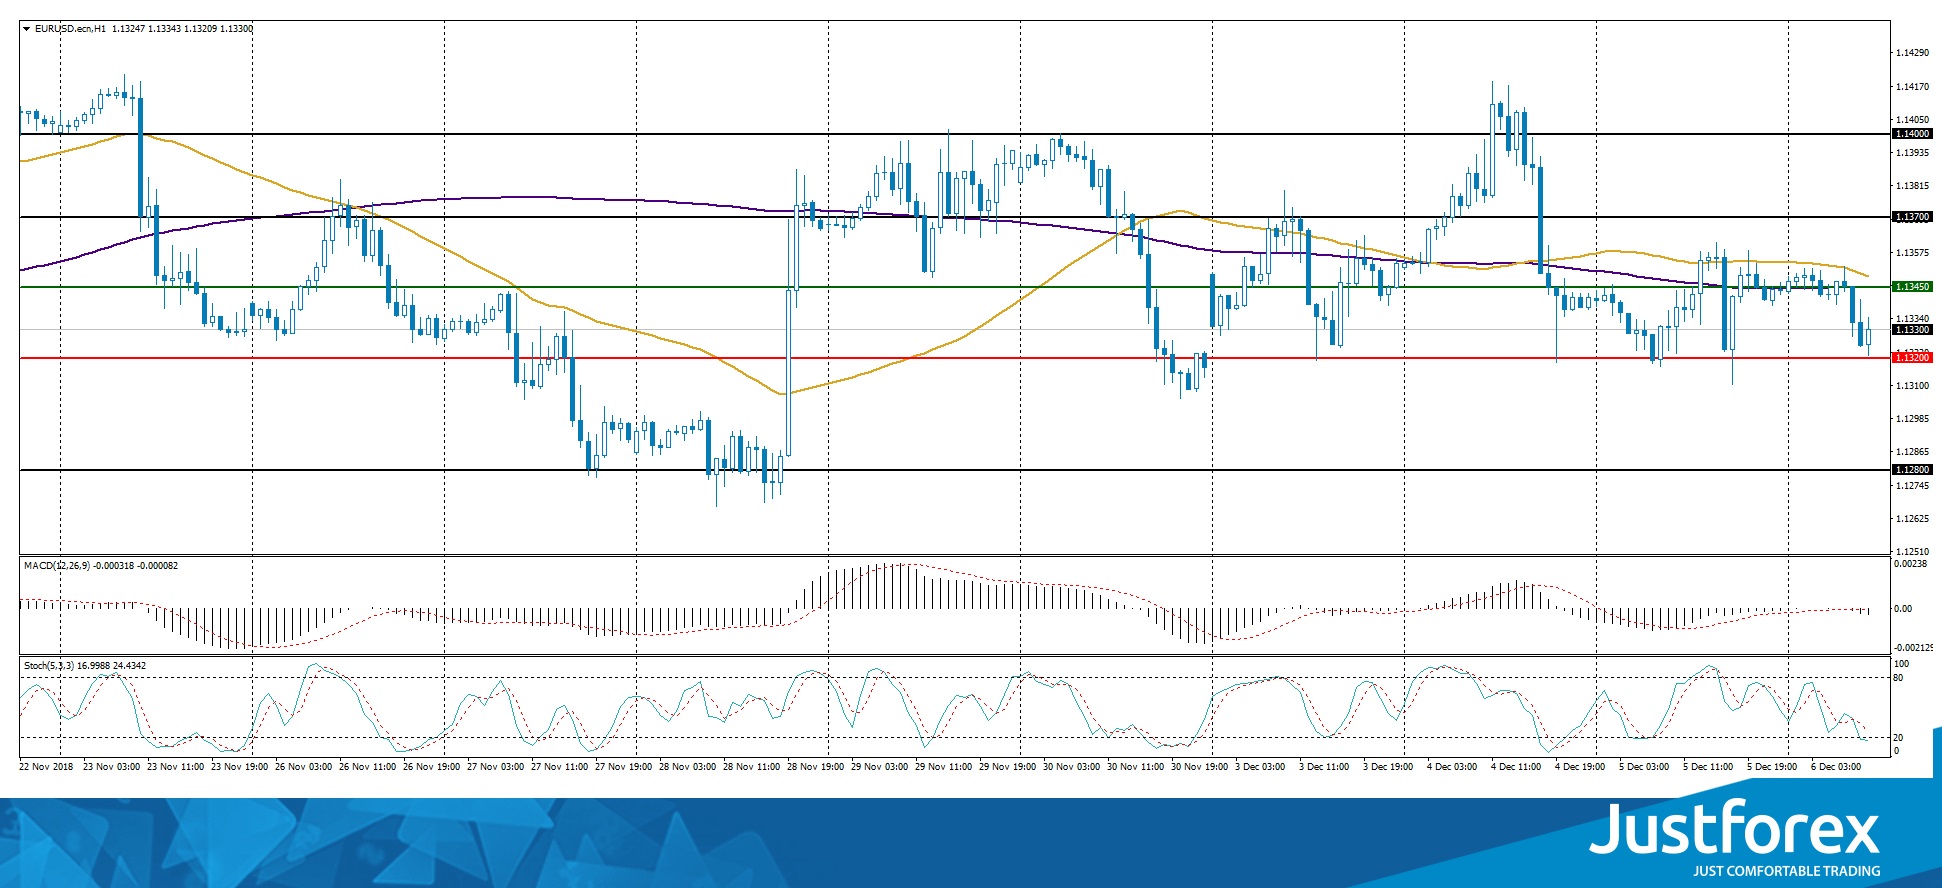
Indicators do not send accurate signals: 50 MA has crossed 200 MA.
The MACD histogram started to descend, indicating the development of the bearish sentiment.
Stochastic Oscillator is close to the oversold zone, the %K line is below the %D line, which gives a signal to sell EUR/USD.
Trading recommendations
Support levels: 1.13200, 1.12800
Resistance levels: 1.13450, 1.13700, 1.14000
If the price fixes below the support level of 1.13200, it is necessary to consider selling EUR/USD. The movement is tending to 1.12800-1.12600.
An alternative could be the recovery of the EUR/USD quotes to the level of 1.13700-1.14000.
The GBP/USD currency pair
Technical indicators of the currency pair:
Prev Open: 1.27080
Open: 1.27321
% chg. over the last day: -0.04
Day's range: 1.26994 – 1.27328
52 wk range: 1.2662 – 1.4378
The technical pattern on the GBP/USD currency pair is still ambiguous. Yesterday the Service Sector PMI was published in the UK, which reached 50.4 instead of the expected 52.5. The quotes are testing the key support and resistance levels: 1.27000 and 1.27400. Investors keep evaluating the recent developments regarding Brexit. You should open positions from the key levels.
The Economic News Field for 06.12.2018 is calm.
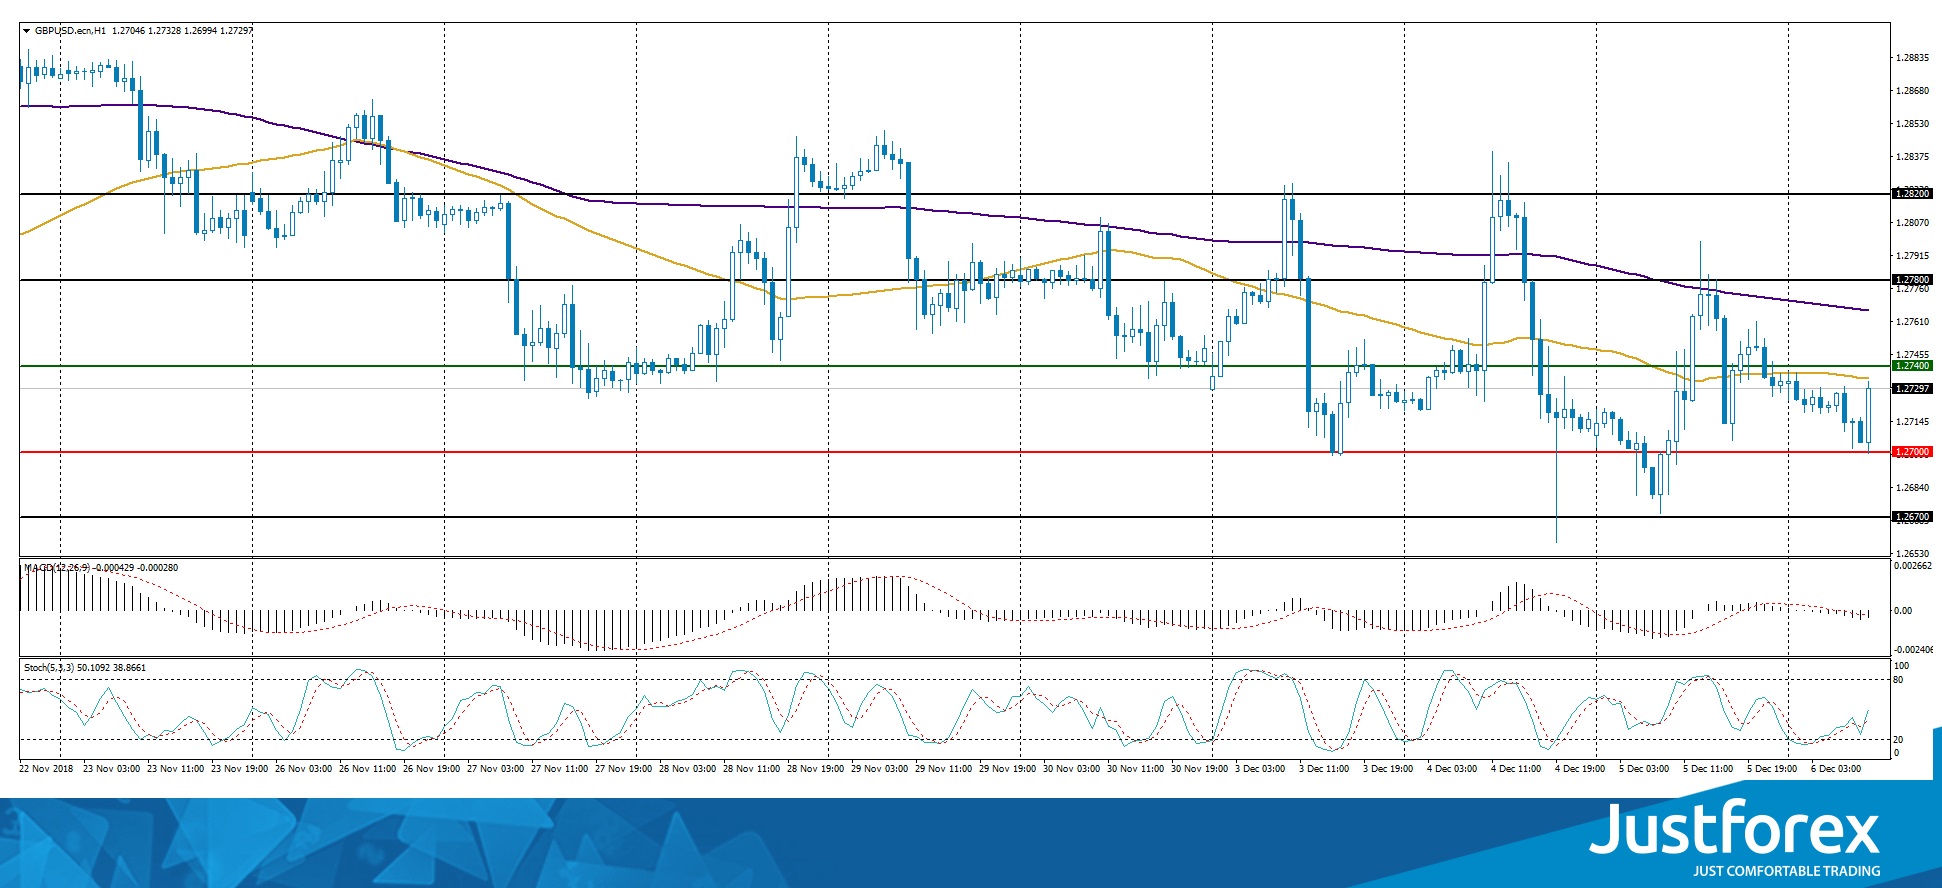
Indicator signals are ambiguous. The price has approached 50 MA, which is a strong dynamic resistance.
The MACD histogram is in the negative zone, which indicates a bearish sentiment.
Stochastic Oscillator is in the neutral zone, the %K line is crossing the %D line. There are no signals at the moment.
Trading recommendations
Support levels: 1.27000, 1.26700
Resistance levels: 1.27400, 1.27800, 1.28200
If the price fixes above the resistance level of 1.27400, the GBP/USD quotes are expected to grow. The movement is tending to 1.27800-1.28200.
An alternative could be a decrease in the GBP/USD currency pair to 1.26700-1.26500.
The USD/CAD currency pair
Technical indicators of the currency pair:
Prev Open: 1.32578
Open: 1.33528
% chg. over the last day: +0.77
Day's range: 1.34123 – 1.32187
52 wk range: 1.2248 – 1.3387
The USD/CAD is showing aggressive purchases. During yesterday's and today`s trading, the quotes gre by more than 150 points. The Bank of Canada left the key interest rate at 1.75% and worsened the inflation expectations forecast, which caused an aggressive sell-off of the CAD. The key support and resistance levels are 1.33900 and 1.34350. Positions should be opened from these levels. The quotes have a tendency to grow futher.
At 17:00 (GMT+2:00), Ivey will publish the PMI report.
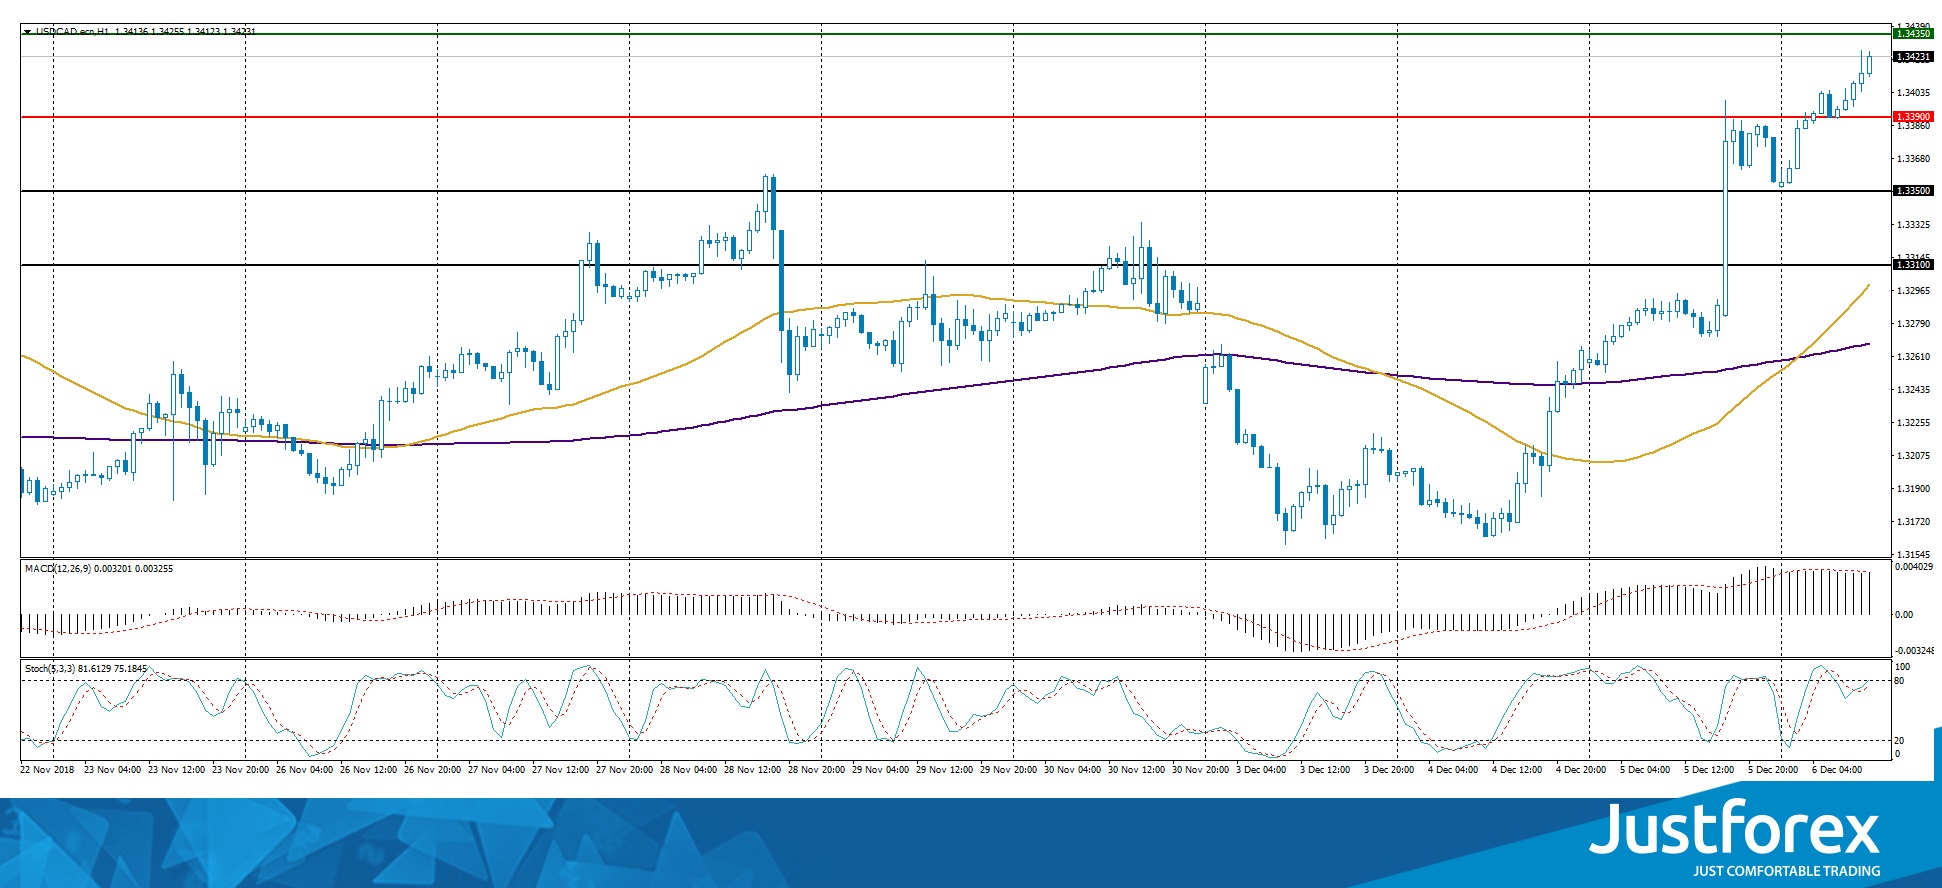
The price has fixed above 50 MA and 200 MA, which indicates the power of buyers.
The MACD histogram is in the positive zone and above the signal line, which gives a strong signal to buy USD/CAD.
The Stochastic Oscillator is in the neutral zone, the %K line is above the %D line, which indicates a drop in the USD/CAD quotes.
Trading recommendations
Support levels: 1.33900, 1.33500, 1.33100
Resistance levels: 1.34350, 1.34600
If the price fixes above the local resistance of 1.34350, further growth of the USD/CAD quotes is expected. The movement is tending to 1.34600-1.34800.
Alternative option. If the price fixes below 1.33900, we recommend looking for market entry points to open short positions. The movement is tending to 1.33600-1.33400.
The USD/JPY currency pair
Technical indicators of the currency pair:
Prev Open: 112.753
Open: 113.183
% chg. over the last day: +0.24
Day's range: 112.687 – 112.844
52 wk range: 104.56 – 114.74
The USD/JPY is showing a variety of trends. The technical picture is ambigous. The local support and resistance levels are 112.600 and 112.850. Positions should be opened from these levels. You should keep an eye on the yield of the US Treasury bonds. The USD/JPY quotes have a downward tendency.
The news feed on the Japanese economy is calm.
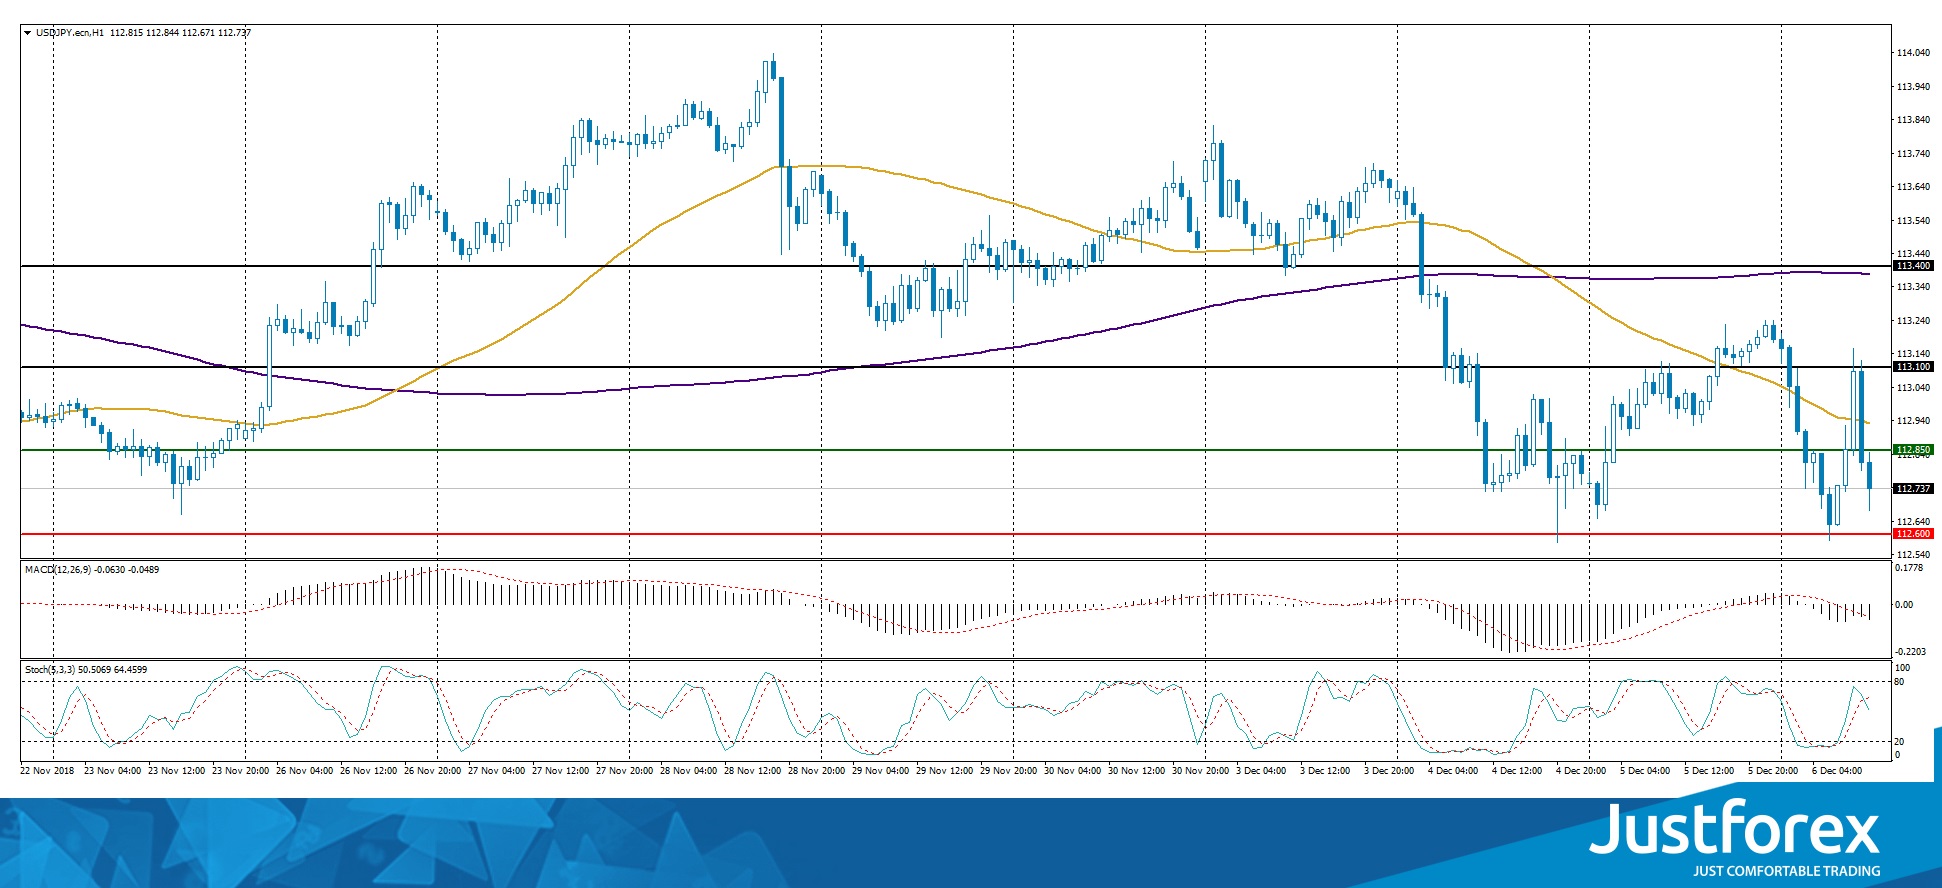
The price has fixed below 50 MA and 200 MA, which indicates the power of sellers.
The MACD histogram is in the negative zone, which indicates a bearish sentiment.
The Stochastic Oscillator is in the neutral zone, the %K line crosses the %D line. There are no signals.
Trading recommendations
Support levels: 112.600, 112.300
Resistance levels: 112.850, 113.100, 113.400
If the price fixes below the support level of 112.600, it is necessary to consider selling USD/JPY. The movement is tending to 112.300-112.000.
An alternative could be the growth of the USD/JPY quotes to 113.100-113.300.
Bitcoin (BTC) Is Likely To Drop To $ 1,500
On the back of a grueling quarter, the bitcoin price could still see tougher times ahead. One analyst over at Bloomberg sees the flagship cryptocurrency possibly heading toward $1,500. Indeed, bitcoin had a dismal November, as part of a difficult year overall for the crypto market, though the past few days have seen slightly more stability from crypto's largest asset. However, today it seems that the selling has resumed. Bitcoin has dropped nearly $200 already today, from just over $3,900 down to $3,850 as of the time of writing.
In a report released today, Bloomberg technical analyst Mike McGlone explained that bitcoin is currently stuck in stiff downward momentum. According to a chart indicator called the Average Directional Index (ADI for short), BTC is at a peak not seen since July. If the indicator is high, it shows high levels of downward trend vigor. McGlone said that he sees a possible price target of $1,500 for bitcoin. Hitting that price would mean another 60 percent fall from its current rate, which is already down 81 percent from last year's all-time high.
'There's little to prevent fading bitcoin prices from reaching the continuous mean of $1,500 […] A rush to the exits among investors seems to be in place,” said McGlone, who fingered the Bitcoin Cash hard fork and tax-based selling as catalysts for the downward momentum. The Bloomberg report also mentions the recent SEC crackdown on ICOs and the commission's hesitancy to approve a bitcoin ETF. November, as CCN reported, saw bitcoin dive over 40 percent, racking up the largest monthly price drop for the asset in the past seven years.
Other crypto experts see bitcoin dropping further as well, but some see a bottom possibly higher than $1,500. Last month CCN reported on Anthony Pompliano's thoughts on a bottom for bitcoin. '85 percent from the all-time high is about where we'll end up. Puts it around $3,000. Came close over the weekend but probably a little bit more to fall,” Pomliano stated. On the flip side, there is still the $15,000 end of year forecast from Tom Lee, though that target appears less likely by the day.
Huawei CFO Arrested: Rquities Tank
Oil prices wobble ahead of OPEC
Trading in positive territory since the beginning of December and following a drop of 22% in November, oil prices appear on the verge of a comeback, as OPEC’s meeting in Vienna kicks off. The market expects an output cut of 1 million barrels/day (current production: 33.13 million bpd). However, the Russian Energy Minister noted that there are diverging opinions: current oil prices are comfortable for Russia (lower oil prices mitigate the impact of a weaker rouble). This poses the question: will OPEC compensate for Russia’s lack of cuts? Saudi Arabia has made clear it won’t carry the cuts on its own. Both Brent crude and West Texas Intermediate prices dropped 1% in morning session, trading at USD 60.92 and USD 52.34 per barrel.
Huawei CFO arrested: equities tank
Asian shares continue down, after Canadian authorities confirmed the arrest of Huawei Technologies’ CFO Wanzhou Meng on charges of violating the USA’s sanctions on exports to Iran. Japan’s Nikkei 225 dropped by 1.91% while Hong Kong’s Hang Seng and China’s CSI 300 declined 2.47% and 2.16%, their most in two weeks. European shares are also dropping, as the UK Parliament mutinies over the Prime Minister May’s Brexit plan. The Euro Stoxx 600 has hit a 2-year low while Germany’s DAX and France’s CAC 40 slid 1.90% and 1.85%. Trade discussions between the USA and China officially started this week and are expected to continue for the coming 3 months. Investors are worried, especially about semiconductor manufacturers being hard hit.