Sample Category Title
Sunset Market Commentary
Markets
Global core bonds gained ground today as the selloff on equity markets continued. The news that Canada, on behalf of the US, arrested Huawei CFO Wanzhou Meng, weighed some more on investor sentiment, illustrating that the US/China relationship remains very fragile. Asian equities lost ground. Secondary eco data released in EMU wasn’t able to steer trading. European equities opened lower but moved sideways afterwards. The ongoing risk-off sentiment supported Bunds. US Treasuries edged higher as well after markets were closed yesterday. The ADP employment change (+179k) and the jobless claims (231k) suggest an ongoing healthy labour market, but both missed market consensus narrowly (+195k and +231k resp.). We don’t expect data to influence trading much, as sentiment remains clearly in the driver’s seat these days. The rally of Treasuries accelerated somewhat as investors cut the probabilities for more Fed rate hikes next year. Fed governor Kaplan called for patience as inflation “isn’t running away” and forecasts show a slower US growth next year. US yield curve bulls steepens with changes ranging from -4.4 bps (30-yr) to -6.6 bps (2-yr).German yield changes range from -1.1 bp (2-yr) to -4.4 bps (30-yr). Peripheral spreads over Germany widen with Greece (+11 bps) and Italy (+10 bps) underperforming.
Trading in the major FX cross rates again decoupled from the risk-off trade on global equity- and interest rate markets. Investors feared a new flaring-up in the US-China trade war after Canada arrested the Huawei CFO. The risk-off repositioning continued during the European morning session, but the impact on EUR/USD was negligible. The pair eased to the 1.1320/25 area, but even a test of the 1.13 area didn’t occur. EUR/USD easily drifted back higher later in the day. At least for now, the global equity sell-off doesn’t provide clear guidance on the relative monetary policy approach of major central banks. The US-German interest rate differential narrowed further at the short end of the curve, but spread chances were modest at the long end of the curve. Regarding the data, German orders were stronger than expected. US ADP reported softer than expected November job growth. The ADP caused some intraday USD losses, but the data didn’t provide news important enough for investors to change their view on global developments going forward. EUR/USD trades currently in the 1.1385 area, near the intraday top. USD/JPY dropped to the 112.50 area on USD softness and as the yen profits slightly from global risk aversion.
Sterling also still develops an erratic-like trading pattern as the Parliamentary debate on Brexit continues. UK PM May and her staff were said to consider small changes to the implementation of the back-stop procedure on the Irish boarder. Apparently, it isn’t enough to raise the chances on an approval of the Brexit in Parliament next week. EUR/GBP doesn’t go anywhere hovering near the 0.89 pivot. Cable (1.2770 area) currently avoids a new downside test of the 1.2660 support area.
News Headlines
German Finance Minister Olaf Scholz said that Germany’s debt percentage of GDP may fall below 60% this year as he expects a 2018 structural surplus of 1.75% of GDP. He added the surplus will be “significantly” lower in next years, as federal spending will increase. Current debt/GDP ratio is 64.1%.
Saudi energy minister Khalid al-Falih said that the OPEC+ group would be satisfied with a supply cut of just 1 million barrels per day. Markets were expecting a larger cut between 1 and 1.4 million barrels however. The news sent oil prices south again (-2% - 3% at the moment). Brent dipped below $60 bp again before recovering some of the losses.
Canada’s Trade Deficit Widened to $1.2 Billion in October
Highlights:
- The Canadian trade deficit widened to $1.2 billion in October from a revised $0.9 billion shortfall (previously reported as $0.4 billion) in September.
- Lower Canadian oil prices were the main factor weighing on the balance in October. Excluding price-effects, the trade balance in volume terms improved somewhat.
Our Take:
A wider trade deficit was not unexpected with Western Canadian oil prices continuing to fall in the month. Controlling for what ended up being a 10% drop in the price of energy exports, the trade balance in volume terms improved somewhat. Export volumes increased 1.4% on relatively widespread gains — although led by a big 4.8% jump in motor vehicle and parts shipments. Non-energy exports were up 2½% from September and closer to 7% from a year-ago. Imports volumes were softer, holding steady following four straight monthly declines, but despite an increase in equipment imports that is a good sign for near-term business investment.
Of course, trade is not the only concern at the moment for the Bank of Canada. Western Canadian oil price spreads have begun to narrow, even before announced mandated oil production cuts in Alberta in 2019, but lower global benchmark prices have added to concerns of another round of retrenchment in the oil sector. At the same time, soft details underlying the 2.0% increase in Q3 GDP — including slower household spending growth, particularly for interest-rate sensitive purchases like cars and houses —arguably leave less urgency for further interest rate hikes to keep consumer debt from getting further out of hand. The economy still looks to be operating close to capacity. Reports of labour shortages haven’t all of a sudden disappeared and underlying inflation trends still appear to be anchored right around the central bank’s 2% inflation target. And the Bank of Canada reiterated its view yesterday that it will still be appropriate for interest rates to move higher from still-low levels to more of a ’neutral’ policy stance over time. Nonetheless, recent developments have lowered the odds that the next central bank rate hike will come in January.
US ISM non-manufacturing rose to 60.7, respondents remain positive
US ISM non-manufacturing composite rose to 60.7 in November, up fro 60.3 and beat expectation of 59.5. Employment component dropped -1.3 to 58.4 but remained well above 50. ISM noted that "The non-manufacturing sector continued to reflect strong growth in November. However, concerns persist about employment resources and the impact of tariffs. Respondents remain positive about current business conditions and the direction of the economy."
Also released, factory orders dropped -2.1% in October versus expectation of -2.0%
Canada Ivey PMI dropped to 57.2, down from 61.8 and missed expectation of 60.3.
AUDJPY Declines Sharply, Short-Term Bias Back to Negative
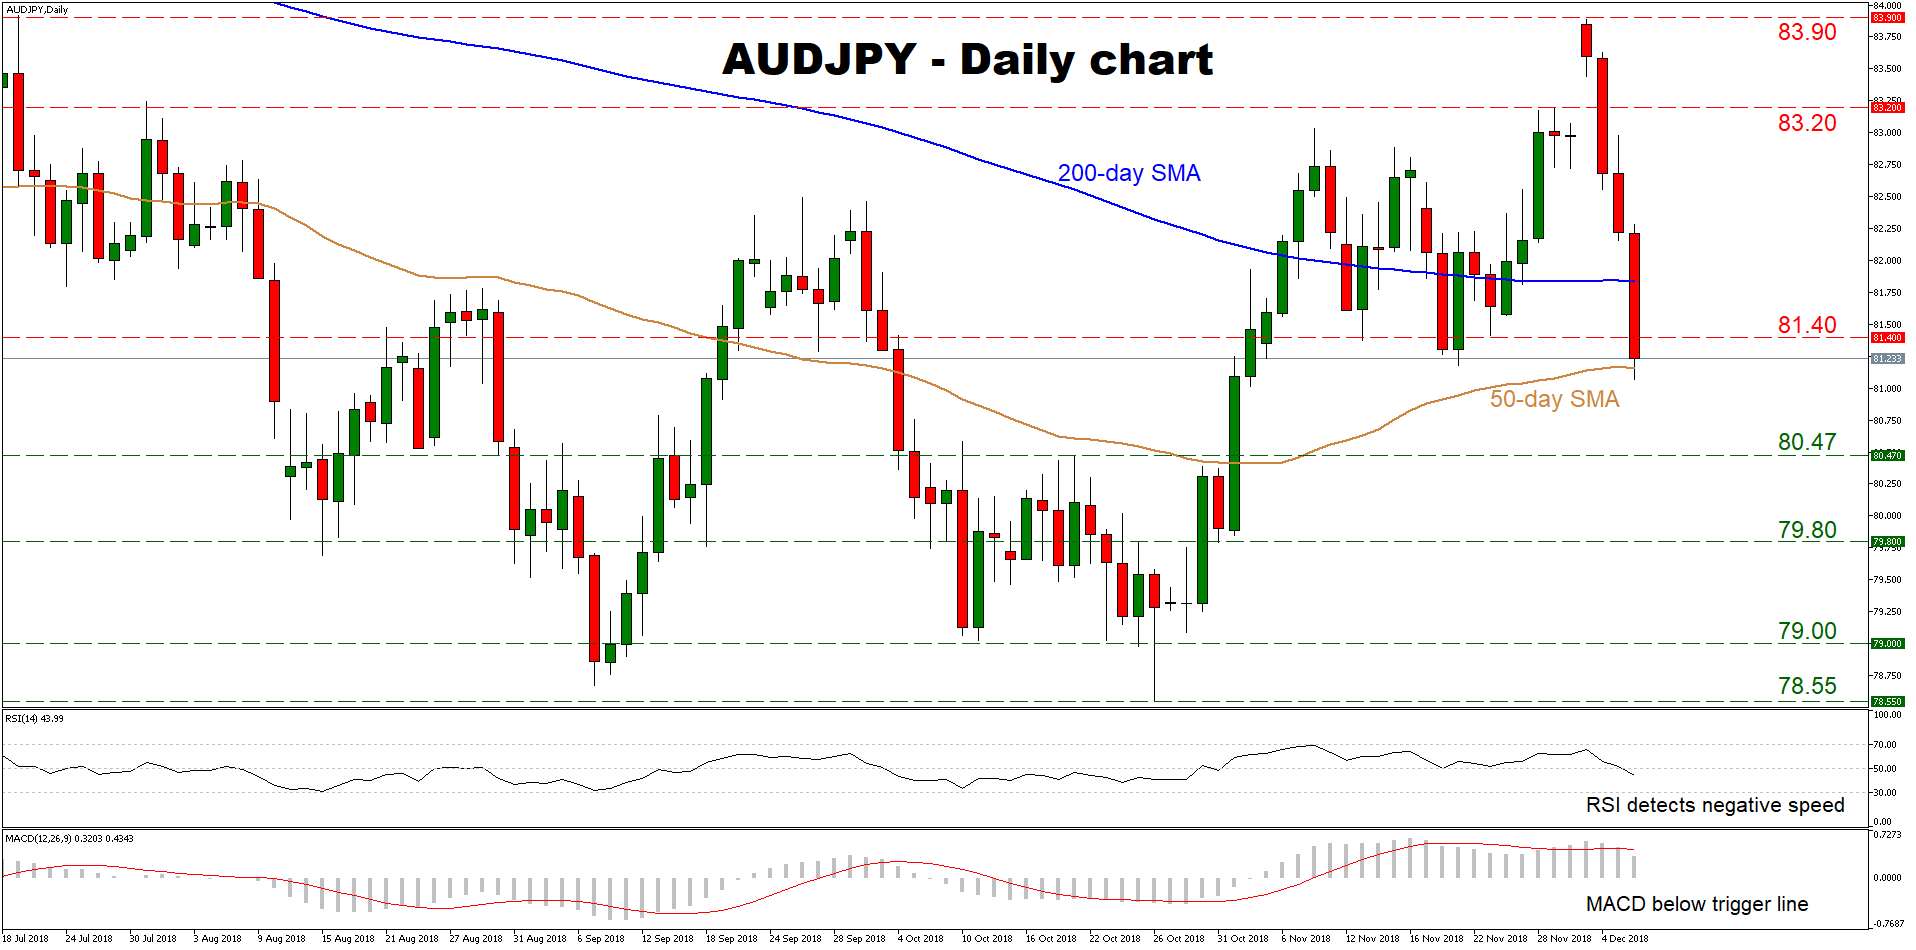
AUDJPY posted hefty losses after rising to a five-month peak of 83.90 in early December, falling back below its 200-day simple moving average (SMA) to find support near its 50-day SMA. The pair is now trading at a one-month low, and the short-term bias seems to have shifted back to negative, though a decisive close below the 50-day SMA is needed to confirm that.
Short-term oscillators support the notion, as the RSI just dipped below its neutral 50 line, while the MACD recently crossed beneath its red trigger line; a bearish signal.
Further declines could encounter support near the 80.47 zone, marked by the peaks of October 19. Even lower, the October 25 top of 79.80 would come into view, a level much more visible on the 4-hour chart. Lower still, buy orders may be found near the round figure of 79.00.
On the upside, a first wave of resistance to advances may come at 81.40, the November 23 trough. A bullish break would open the way for the 200-day SMA at 81.83, with even steeper moves higher seeing scope for a test of the 83.20 territory – defined by the highs of November 29.
Summing up, the short-term picture seems to have turned negative, but a clear close below the 50-day SMA is required to validate that.
U.S. Trade Deficit Expands to Largest Since February
The U.S. trade deficit rose to $55.5 in October, 1.7% (m/m) larger than the (revised) $54.6 billion recorded in September. October marks the widest deficit since this past February.
Nominal exports fell 0.1%, with notable declines in food and beverages (soybeans), and automotive products. Imports rose 0.2% in the month, driven by consumer and automotive goods.
Nominal services exports rose 0.1%, while imports of services rose 0.4%.
Adjusted for inflation, real goods exports fell 0.8%,and real goods imports fell 0.2% on the month.
Today's report shows that trade deficits through October (year-to-date basis) have widened this year between the U.S. and most of its major trading partners, with some exceptions (UK, Japan, Korea, and Taiwan). The U.S. trade deficits with Europe and China are on track to be the largest ever.
Key Implications
October's trade data is the first full month after the U.S. imposed a 10% tariff on $200bn in Chinese goods, and there may be some evidence that this action is distorting trade data. For one, the ongoing weakness in food and beverage exports, including soybeans, likely reflects a continuation of the trend of reduced exports to China after the U.S. announced its intent to tariff $50bn in Chinese goods this past spring. Moreover, consumer goods imports ramped up a little earlier than expected this year for the holiday season, consistent with reports that firms were anxious to bring in product in advance of tariffs.
Widening trade deficits with its major trading partners suggest that the U.S. administration's actions to rebalance trade in favor of the U.S. have yet to make much headway. This could go two ways. First, the U.S. administration may view this as the need to double down on tariffs, and thereby escalate trade tensions. Such an escalation would likely exert an economic drag at a time when the global economy has already lost a lot of momentum, in part due to trade uncertainty. Second, the U.S. administration could act to address some of the structural factors that are largely responsible for trade deficits, such as its dependency on imported oil and rising fiscal deficits that are largely financed by capital from abroad.
BoC Poloz admits economy loss momentum going into Q4
BoC Governor Stephen Poloz admitted today that "data released since our October Monetary Policy Report have been on the disappointing side ". And, "the economy has less momentum going into the fourth quarter than we believed it would."
Also, regarding recent oil price slump, Poloz added "it is already clear that a painful adjustment is developing for Western Canada and there will be a meaningful impact on the Canadian macroeconomy."
The comments echo BoC's cautious statement yesterday and solidify the chance for BoC to pause its rate hikes if things don't improve.
Canada’s Trade Deficit Widens in October, Driven by Declines in Energy Prices
Canada posted a $1.17 billion trade deficit in October, up from a revised $0.89 billion deficit in September (previously reported as a $0.42 billion deficit). This is higher than consensus expectations of a $0.73 billion deficit. Exports fell 1.2% to $49.3 billion, driven primarily by energy. Imports declined by a less drastic 0.6% to reach $50.5 billion.
In real terms, the picture was significantly better. Exports volumes were up 1.2%, whereas import volumes were almost flat on the month.
The decline in exports was primarily an energy price story, which resulted in an overall slide of 2.3% in total export prices. As a result, exports of energy products fell 12.4% in value. This was only partially offset by strong upticks in exports of motor vehicles and parts (+4.4%) and food, fishing, and intermediate food products (+4.8%). Excluding energy, exports were up 1.6%, with increases across 7 of the 11 industries.
Imports fell for the fourth consecutive month. This was led by a decline in motor vehicles and parts (-3.5%) and industrial, chemical, plastics, and rubber products (-4.5%).
Canada's merchandise trade surplus with the U.S. narrowed significantly to $3.1 billion in October. Its merchandise trade deficit with countries other than the U.S. narrowed to $4.2 billion.
Key Implications
The release is much better than the headline picture indicates. As expected, the widening was mostly driven by reduced energy prices, due both to elevated Canadian differentials for most of the fall, and declining global benchmarks. The uptick in export volumes, which was relatively broad-based, is encouraging, whereas the flat import volumes don't raise as large a red flag on consumer spending as the nominal headline value would suggest.
Despite the good release, it likely doesn't change much in the face of larger headwinds that are approaching. Developments in the last month, including a weaker-than-expected Q3 real GDP, oil production curtailments in Alberta, and the GM plant shutdown have further added credence to a slowing growth narrative. In particular, announced voluntary oil shut-ins in Q4, combined with mandatory curtailments in 2019 are expected to weigh on export volumes going forward.
Silver Pauses Negative Tendency, Creating Neutral Phase
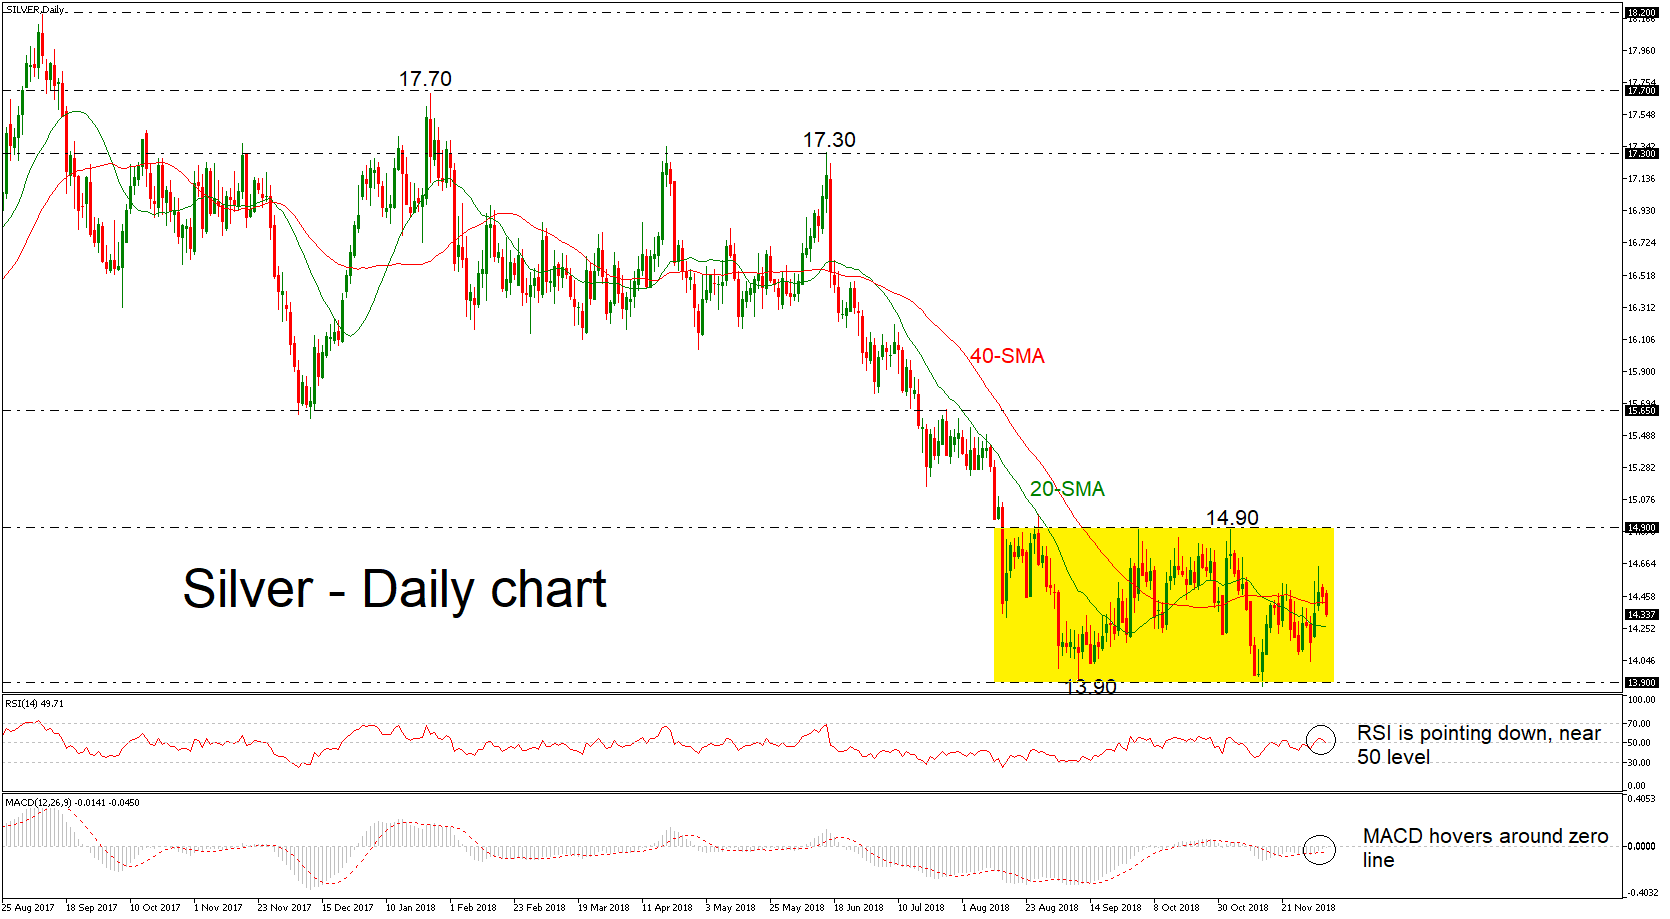
Silver has been consolidating since August 15 and has been stuck in a sideways channel. The neutral to bearish picture in the medium term looks to last for a while longer after prices failed to break above the upper channel in the preceding month.
Resistance was met at around 14.90 region and significant support at 13.90, forcing the price to remain in a range. Technical indicators confirm this view with the RSI approaching the 50 level with weak momentum and the MACD oscillator stands around the zero line, above the red trigger line.
If prices continue to head lower in the near term, support should come from the 20-day moving average (SMA) near the 14.26 mark. A drop below the 20-day SMA would send prices towards the lower band of the range at 13.90. If the market fails to halt inside the consolidation area, this would reinforce the long-term bearish structure and the price could hit the 13.58 support, reached on December 2015.
However, should an upside reversal take form, immediate resistance will likely come from the 14.90 barrier. A break above this region could shift the bias to a more bullish one with the next resistance coming from the 15.65 level.
Overall, silver has been developing in a downtrend since July 2016 in the long-term, while in the short-term view the price needs to exit from the range for a clearer direction.
USD/JPY Mid-Day Outlook
Daily Pivots: (S1) 112.80; (P) 113.03; (R1) 113.41; More..
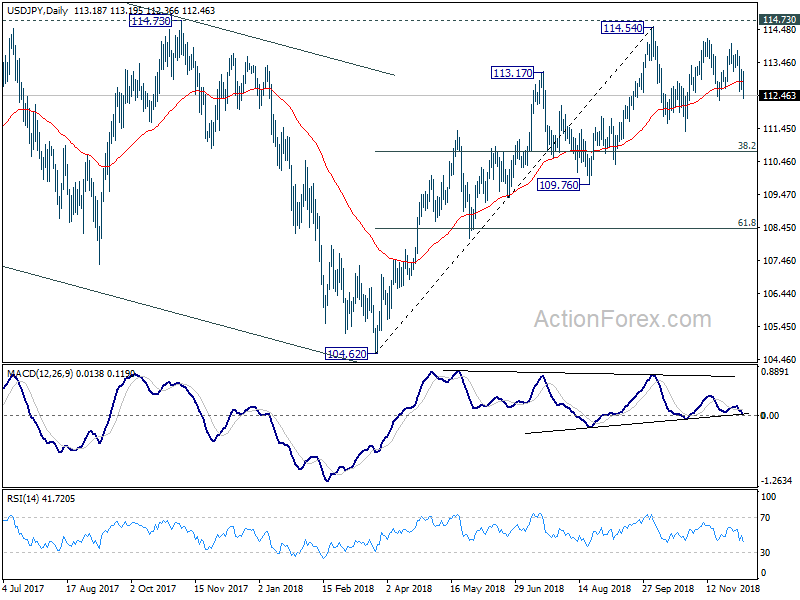
Intraday bias in USD/JPY is back to the downside with break of 112.57 minor support. Break of 112.30 will will extend the fall from 114.20 to 111.37 support and below. But after all, price actions from 114.54 are seen as a consolidation pattern. Hence, even in case of deep decline, downside should be contained by 38.2% retracement of 104.62 to 114.54 at 110.75 to bring rebound. Larger rise from 104.62 is expected to resume later. On the upside, above 113.24 minor resistance will turn bias back to the upside for 114.03 resistance.
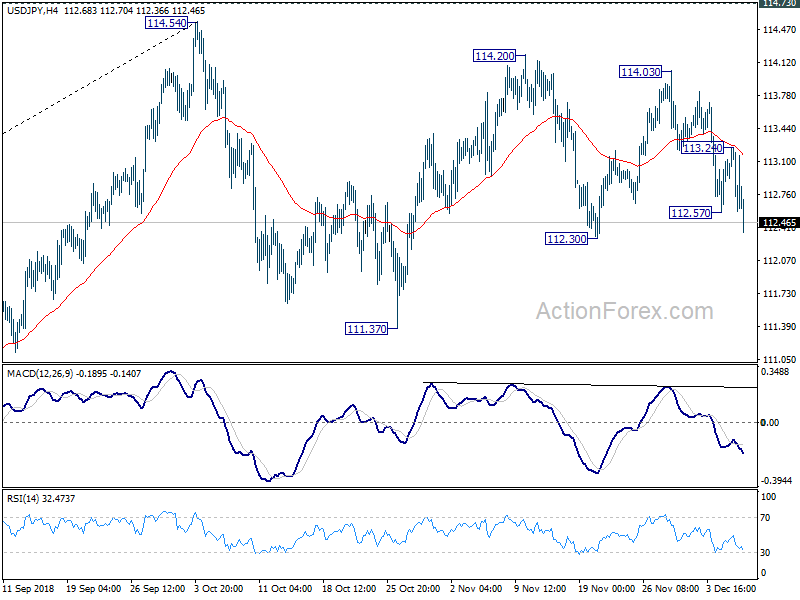
In the bigger picture, corrective fall from 118.65 (2016 high) should have completed with three waves down to 104.62. Decisive break of 114.73 resistance will likely resume whole rally from 98.97 (2016 low) to 100% projection of 98.97 to 118.65 from 104.62 at 124.30, which is reasonably close to 125.85 (2015 high). This will stay as the preferred case as long as 109.76 support holds. However, decisive break of 109.76 will dampen this bullish view and turns outlook mixed again.
USD/CHF Mid-Day Outlook
Daily Pivots: (S1) 0.9959; (P) 0.9984; (R1) 1.0001; More...
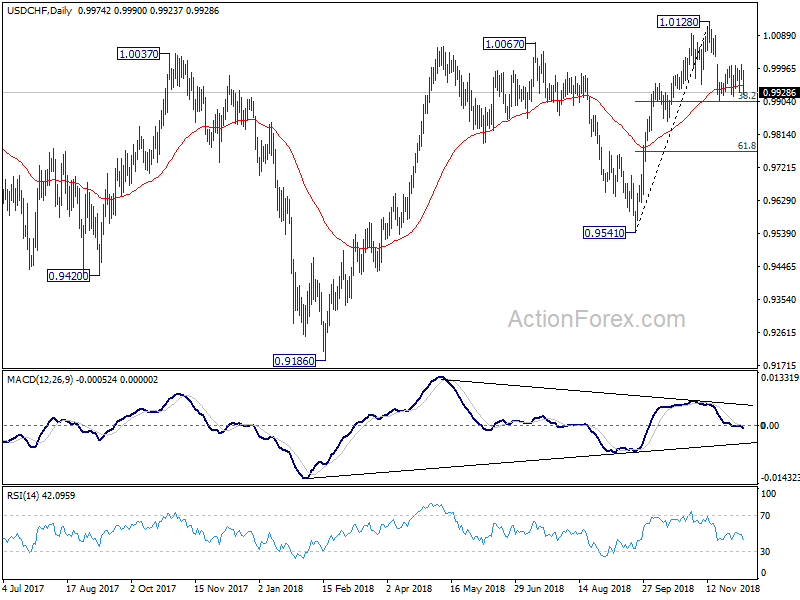
At this point, USD/CHF is still staying in consolidation in range of 0.9908/1.0006. Intraday bias remains neutral first. On the upside, break of 1.0006 will argue that the pull back from 1.0128 has completed. Intraday bias will be turned back to the upside for retesting 1.1028. On the downside, break of 38.2% retracement of 0.9541 to 1.0128 at 0.9904 will resume the fall from 1.0128 to 0.9848 key support level. Break there will indicate near term reversal and target 61.8% at 0.9765.
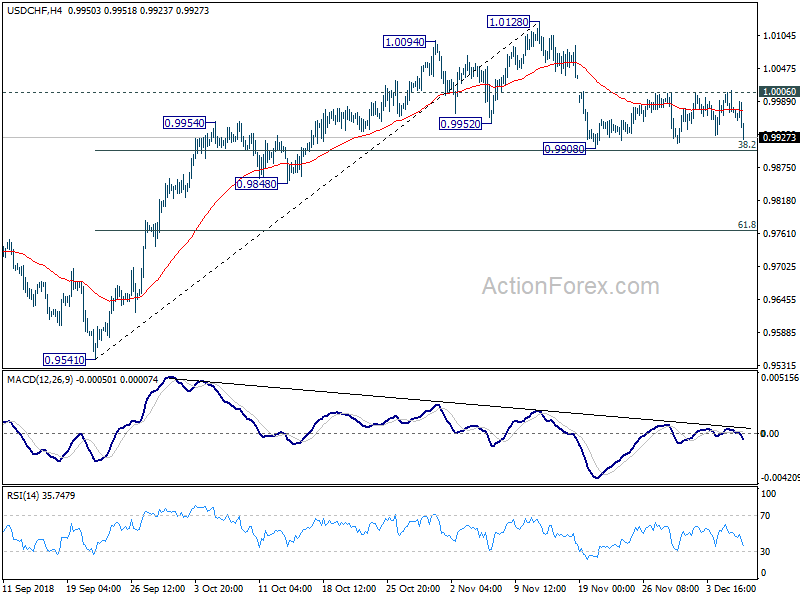
In the bigger picture, rise from 0.9541 could have topped at 1.0128. But as long as 0.9541 support holds, we'd still expect rise from 0.9186 to resume at a later stage. Break of 1.0128 will target 1.0342 key resistance. However, break of 0.9514 will pave the way back to 0.9186 low.