

Sample Category Title
Eco Data 12/7/18
[php_everywhere instance="1"]
Today’s top mover: AUD/JPY downside accelerate mixes up technical outlook
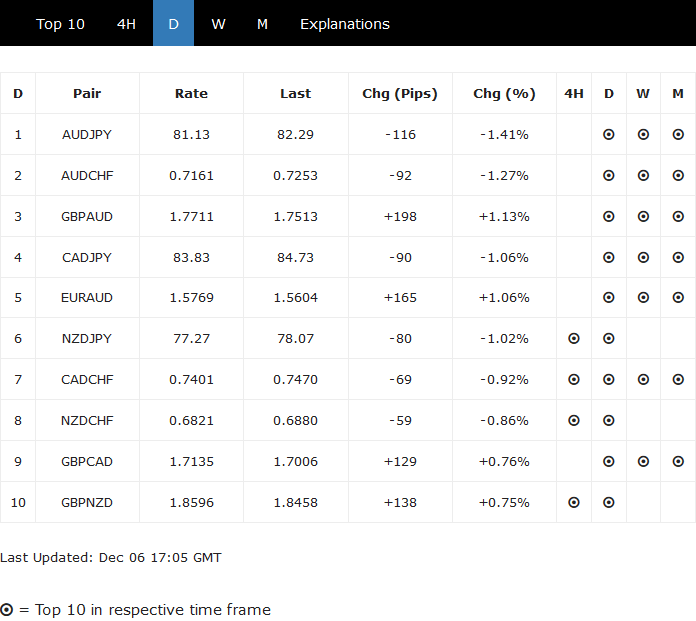
At the time of writing, Australian Dollar is clearly today's biggest loser on risk aversion. And let's be reminded that Australia Q3 GDP released earlier this week was also a big miss. Yen is the strongest one naturally on risk aversion. In particular, the selloff in stock markets is global. And, the decline in treasury yields is global too.
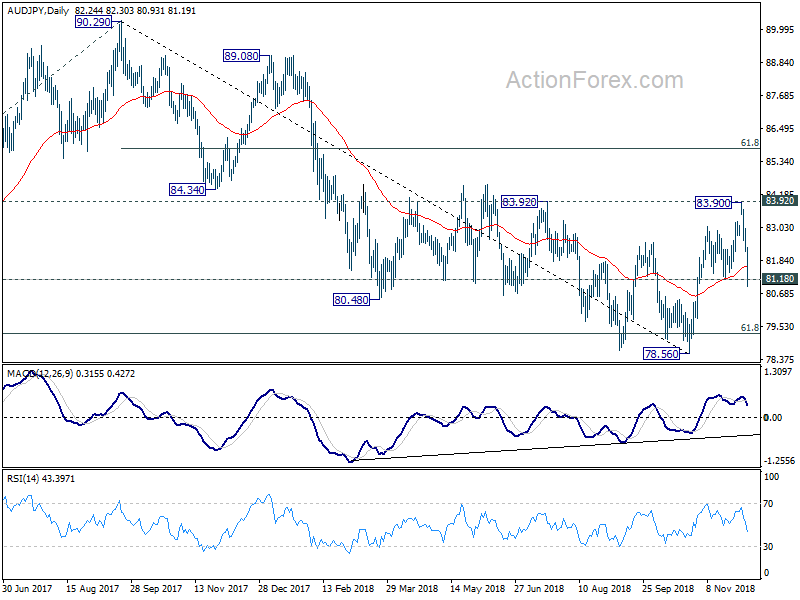
AUD/JPY's break of 81.18 support confirms short term topping at 83.90, ahead of 89.92 resistance. And the development mixed up the technical outlook of the cross. The steepness of the fall from 83.90 does argue that rebound from 78.56 is finished. But at the same time, 78.56 is a medium term bottom on bullish convergence condition in daily MACD. Rebound from 78.56 to 83.90 is not too corrective looking.
That is, at this point, we're unsure if fall from 83.90 is merely a pull back, or resuming down trend fro 90.29. For now, we'll be neutral on the cross first. The structure of the upcoming recovery would reveal much about the underlying trend.
Risk aversion intensifies, European indices made new 2018 low, DOW breaches Nov low
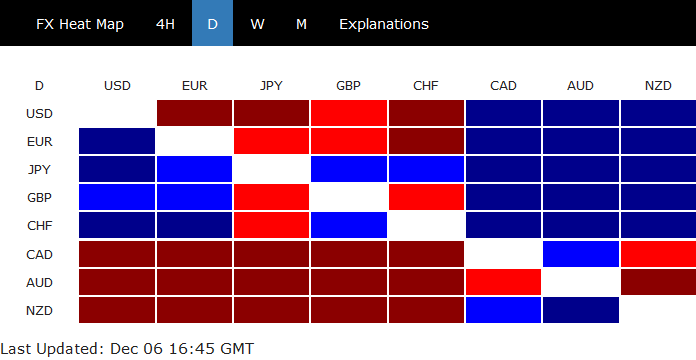
Risk aversion continues to intensify. AUD, NZD and CAD remain the weakest one is general. USD is catching up in US session. However, EURUSD and GBP/USD are staying in familiar range. USD/CHF breached 0.9908 support but quickly recovered. USD/JPY also breached 112.30 support but quickly recovered too. More is needed to prove Dollar's weakness.
In Europe:
- DAX closed down -3.61% or -404.79 pts at 10795.45. Below key support level, 2018 low (made in Nov) at 11009.25.
- CAC closed down -3.58%, or -117.04 pts at 4767.33. Below key support level, 2018 low (made in Nov) at 4894.30.
- FTSE closed down -3.53% or -244.15 pts at 6677.68. Below key support level, 2018 low (made in Oct) at 6851.59.
- German 10 year yield dropped -0.0436 to 0.234, lowest since one-day spike low at 0.186 on May 29.
In US:
- DOW is down -2.48% or -622pts at 24404.
- S&P 500 is down -2.68%
- NASDAQ is down -2.19%
- 10 year yield is down -0.082 at 2.842
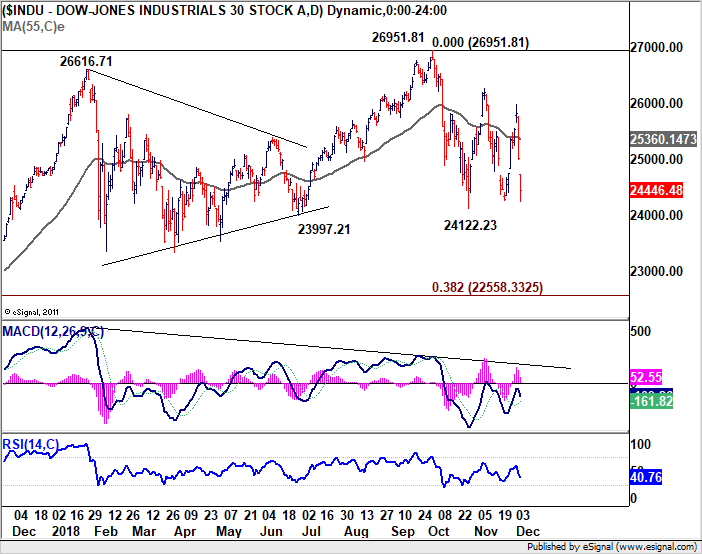
DOW breached Nov low of 24268.74 to as low as 24242.22. Oversold condition might bring brief recovery. But further decline should be seen to 24122.23 support in near term.
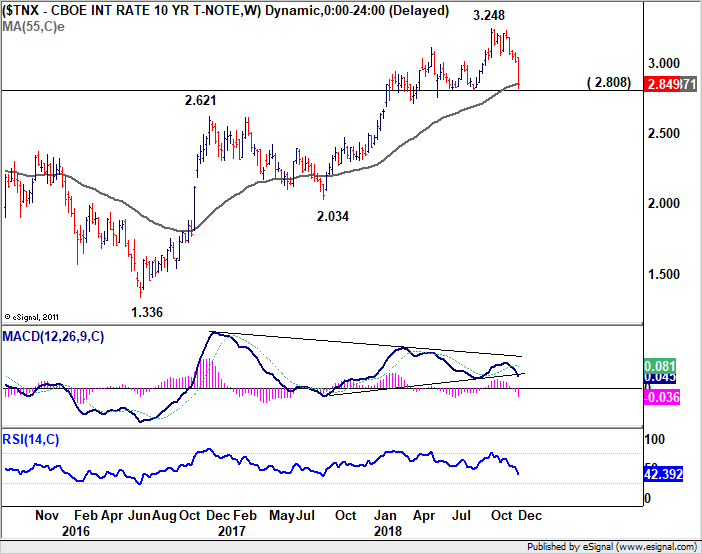
10 year yield has broken 55 week EMA and is now in proximity to 2.808 key support level. For now, strong support is still preferred around this level. But considering bearish divergence condition in weekly MACD, break of 2.808 would be a strong sign of medium term reversal. And deeper fall would be seen back to 2.034/2.621 support zone.
NFP Jobs Report Expected to be Solid but Fed May Need Something Stronger
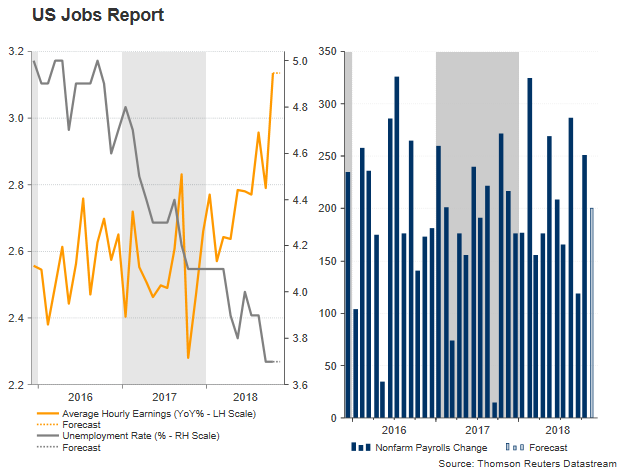
The last time US nonfarm payrolls were released, investors turned more positive that the Fed would raise interest rates at least twice next year as wages recorded their largest increase in 9 ½ -years and employment growth bounced back. This time, the jobs report comes on the heels of a less hawkish Fed, and the data are not expected to be more delightful. Hence, investors will be closely scrutinizing the numbers as policymakers seem to be resuming their data-dependent approach.
On Friday at 1330 GMT, the US government is expected to say that nonfarm payrolls in both the public and private sectors rose by 200k in the month of November, somewhat less than in October when the measure bounced up by 250k, but still at normal levels. The rest of the report is anticipated to remain unchanged, with the unemployment rate standing at 3.7%, the lowest in 18 years, and average hourly earnings growing steadily at 3.1% y/y, the strongest pace in almost a decade.
 While the labour market looks healthy and tight, which in theory should speed up inflation, estimates of the core Personal Consumption Expenditure Index (PCE), showed surprisingly that inflation cooled down to 1.8% y/y in November, back below the Fed’s 2.0% price goal.
This in combination with a slowing GDP growth – it fell from 4.2% in annualized terms in Q2 to 3.5% in Q3 – are feeding skepticism that the central bank might turn more careful with monetary policy after delivering another rate hike in December as the Fed chief Jerome Powell probably tried to communicate at the Economic Club of New York last Wednesday. Powell, who previously claimed that interest rates are far away from estimates of neutral – the level that neither stimulates nor restricts economic activity – is now supporting that borrowing costs are just below them.
But given that the range of neutral estimates is between 2.5% and 3.5% and the current Fed funds rate is 2.0%-2.25%, the Bank could raise rates once to reach the lower bound of the neutral range and four more to touch the top of it. Therefore, Powell and his colleagues may still raise rates further, but will likely require concrete evidence that consumers and businesses are able to cope with higher borrowing costs. In other words, upcoming data including Friday’s NFP numbers may need to come in better than analysts predict, for markets to believe that the Fed is back on the rate hiking course next year.
Investors also seem to be using the spread of longer and shorter-term Treasury yields as a prediction of how the economy will evolve in the future. On Monday, the dollar fell after the 2-year Treasury yield dropped below the 5-year yield, which implies investors are betting that the economy is poised to weaken and that the Fed may need to cut rates again in the next years.
Undoubtedly, the US-Sino trade dispute is another topic in concern which could put the Fed’s tightening plans on hold in case the governments fail to reach a compromise. Both sides agreed to pause the trade war for the next 90 days and restart negotiations during the G20 summit, but they still have not convinced markets that a solution could be found in such a short period.
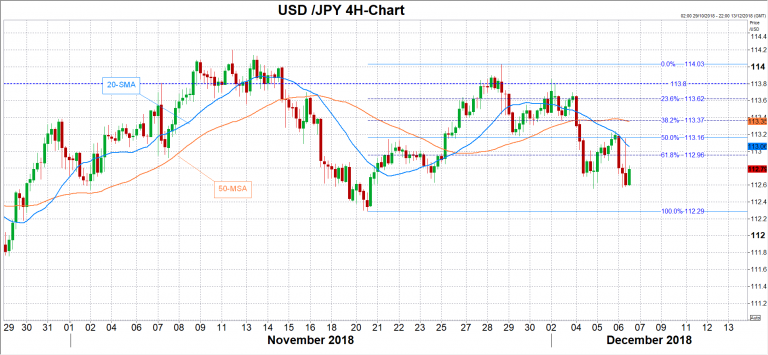
Turning to FX markets, the dollar is set to close lower against the Japanese yen this week, though an upbeat jobs report could help the US currency to recover somewhat on Friday, perhaps sending the pair up to 113.16, the 50% Fibonacci of the upleg from 112.29 to 114.00. An upside surprise in the numbers – especially in the wage growth readings – could also bring the 38.2% fibo of 113.37 under the spotlight before the 113.62-113.80 area comes into view.
Alternatively, should the figures miss forecasts, adding speculation that the Fed might indeed deliver just a single rate hike in 2019 as is currently priced in by markets, it would be interesting to see whether dollar/yen can reach the previous low of 112.29. A breach of that bottom would then shift attention to 111.80.
Canadian Jobs Numbers Up Next as Loonie Awaits OPEC Outcome
Canada’s latest employment figures will hit the markets on Friday, at 1330 GMT. Forecasts and gauges of the labor market point to another solid report, which may help the loonie recover some of its latest losses. In the bigger picture though, the direction of oil prices following the OPEC decision later today may prove even more important for the Canadian currency.
The loonie recorded hefty losses this week, diving to a 1½-year low versus the dollar, after the Bank of Canada (BoC) struck a more cautious tone at its latest meeting. Against the backdrop of collapsing oil prices, the Bank noted that Canada’s energy sector may be “materially weaker than expected”, and “data suggests less momentum” in Q4. Investors saw these as a signal policymakers will be more cautious in raising rates, paring back their bets for near-term hikes.
Market pricing now implies a mere 26% probability for a quarter-point hike at the January gathering, while a hike in March is viewed more as a coin toss, according to Canada’s overnight index swaps. Thus, attention now turns back to incoming data, to determine whether a rate move in the coming months is indeed realistic, or not.
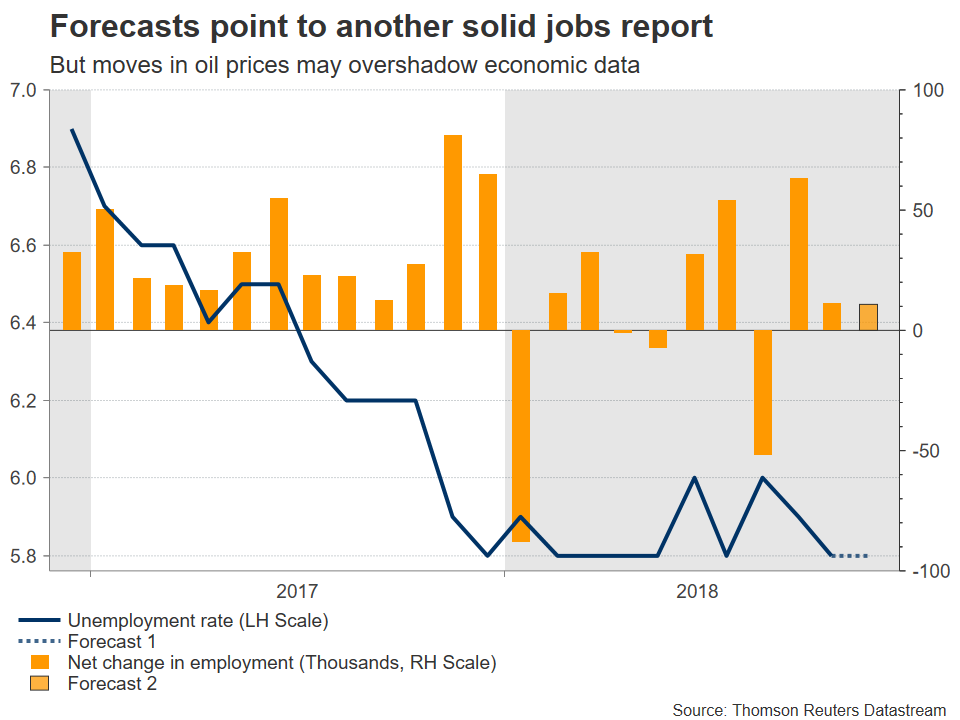
This brings us to Friday’s employment data. In November, the nation’s unemployment rate is forecast to have held steady at the four-decade low of 5.8%. Meanwhile, the net change in employment is anticipated to have remained in positive territory and almost unchanged, at 11.0k. As for potential surprises, the Markit manufacturing PMI for the month indicated the “strongest job creation since survey began”, which in isolation suggests a positive surprise in these figures is more likely than a disappointment. Stronger-than-consensus prints could rekindle hopes for a rate move in Q1 2019, potentially helping the loonie to recover.
That said, economic data in general over the next days may play second fiddle to moves in oil prices. In this sense, the outcome of the OPEC meeting later today could determine the short-term path of crude, and by extent drive oil-related currencies like the loonie. In other words, even robust jobs data may be unable to support the Canadian currency for long if OPEC disappoints and oil resumes its broader slide, for instance. Beyond OPEC, some remarks from BoC Governor Poloz at 1350 GMT today could also impact the loonie; if he echoes the cautious tone seen in yesterday’s policy statement, that may weigh further on the currency.
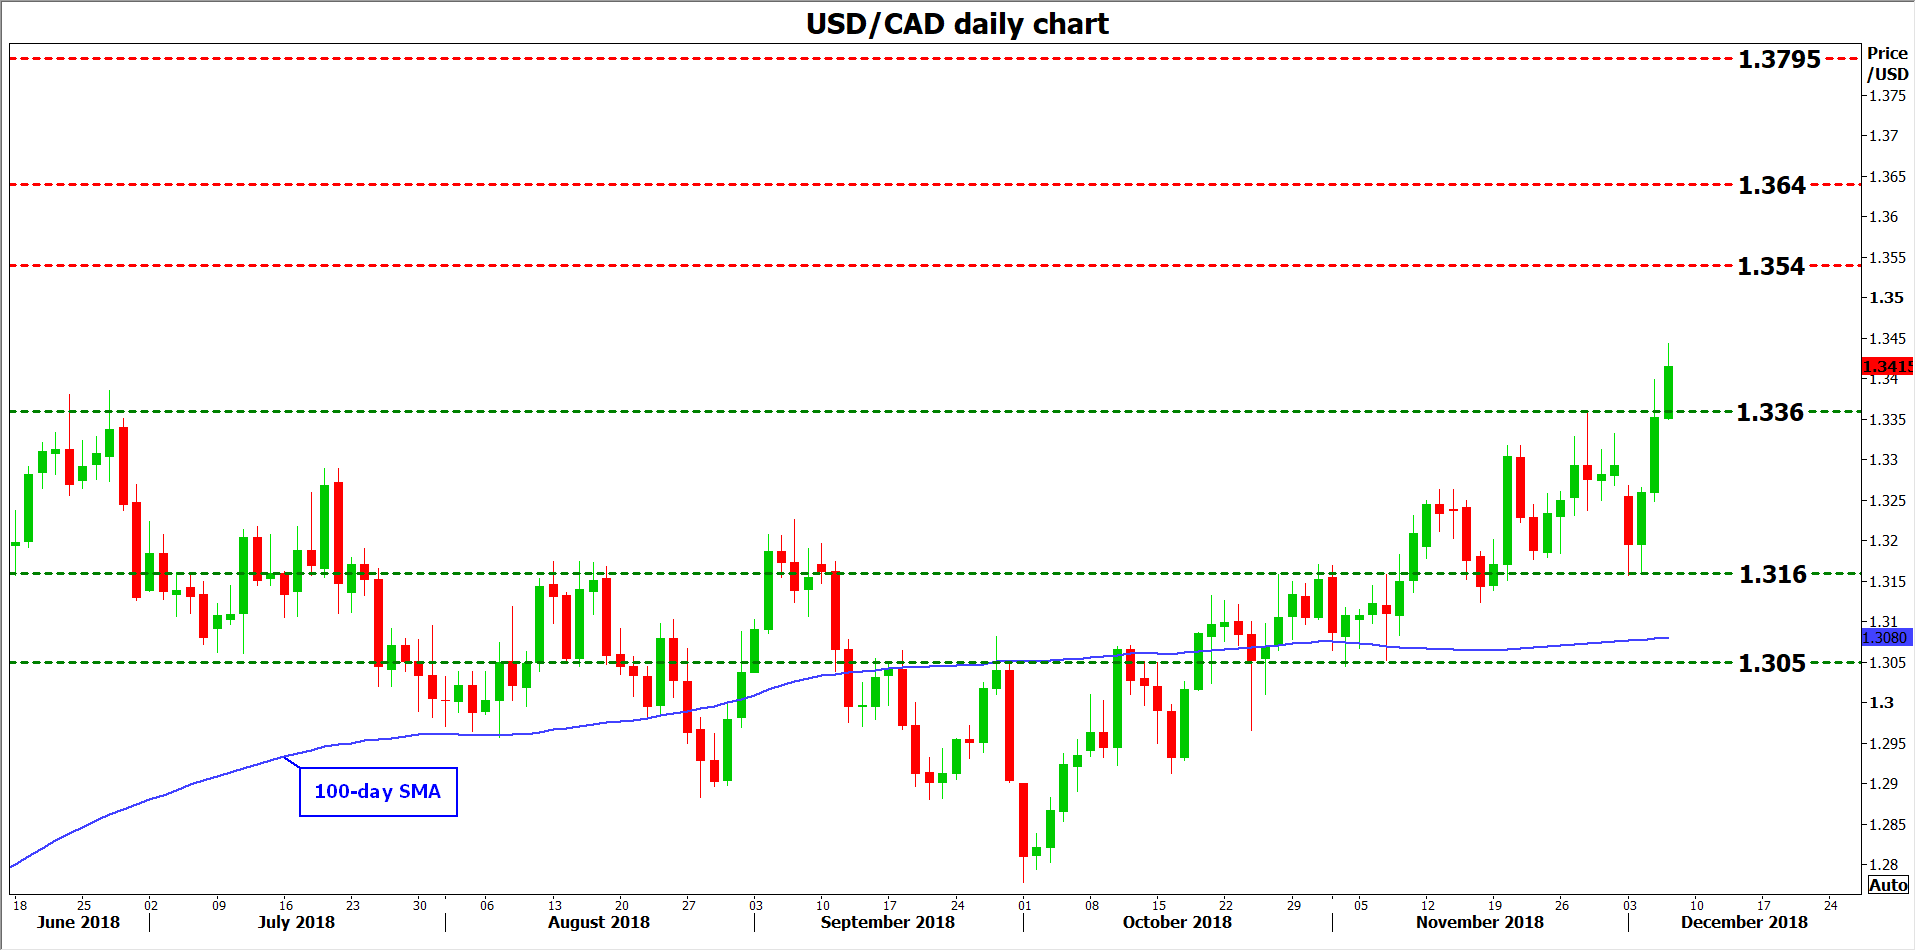 Technically, further advances in dollar/loonie may stall initially near 1.3540, the high of June 9, 2017. An upside break could open the way for 1.3640, the inside swing low of May 5, 2017. Even higher, the 2017 peak of 1.3795 would attract attention.
On the downside, preliminary support to declines may come at 1.3360, the top of November 28, before the December 3 low of 1.3160 comes into view. Even lower, buy orders may be found at the November 7 trough of 1.3050, assuming the bears can pierce the 100-day SMA at 1.3080 first.
Note that the US and Canadian jobs reports will be released at the same time, so the reaction in dollar/loonie on the news will also depend on the American data.
U.S. Non-Manufacturing Activity Picks Up Pace in November
The Institute for Supply Management's (ISM) non-manufacturing index rose by modest 0.4 points to 60.7 in November. The headline print surpassed consensus expectations, which called for the index to pull back to 59.0.
The details of the report were constructive with most of the index's key subcomponents rising on the month. Of note, the business activity subcomponent rose by 2.7 points to 65.2 – the highest level since January 2004. Prices paid (+2.6 points to 64.3), new orders (+1.0 points to 62.5) and backlog of orders (2.0 points to 55.5) also improved.
On the other hand, the employment subcomponent declined for the second month in a row (-1.3 points to 58.4). But, the subcomponent remains well in expansionary territory, and above its year ago level.
Trade-related subcomponents were mixed. While imports rose by 3.5 points to 54.5, new export orders fell by just as much (to 57.5).
Comments from business owners suggest that they generally remain upbeat about current business conditions and the economy, particularly in domestically oriented sectors. However, they do note some concern about labor shortages, tariffs and rising costs for labor and materials.
Key Implications
The ISM non-manufacturing index joined its manufacturing counterpart last month, with activity picking up pace in November. Service sector expansion remains brisk, with the headline staying above 60-points for the third consecutive month, marking the best 3-months performance since inception of the index. Growth remains not just fast but also broad-based, with all but one industry (Agriculture, Forestry, Fishing & Hunting), reporting expansion in November.
Despite the upbeat mood among the survey respondents, the negative impact of tariffs on input prices and capital planning has been mentioned by several respondents. The weekend deal between the U.S. and China to hold off on additional tariffs for at least 90 days may help to alleviate some immediate concerns. However, the cloud of trade uncertainty will continue to weigh on business investment decisions until a comprehensive agreement between the two countries is in place.
As has been the theme in last several reports, firms continue to report challenges filling in positions. This report was no exception, with firms reporting difficulty finding workers and rising labor costs (for the second consecutive month). The second consecutive monthly decline in the employment subcomponent further corroborates this notion. With the labor market tightening further with every passing month, labor shortages will likely begin to weigh on employment growth and business expansion plans in the months ahead.
Amid Trade Turmoil, U.S. Deficit Widens in October
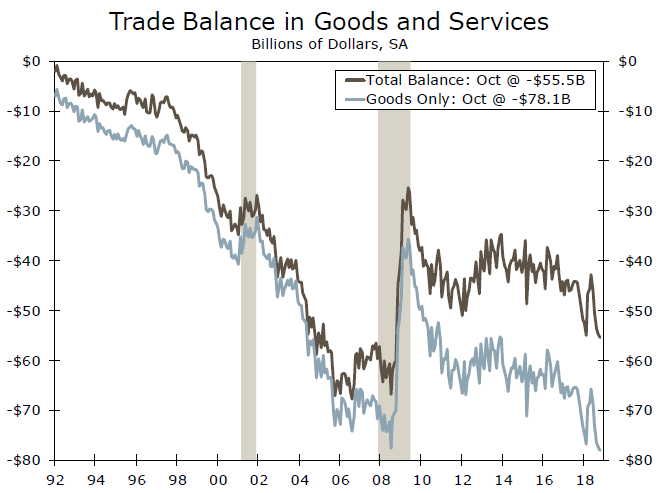
The nation's trade deficit widened in October, falling $900 million to $55.5 billion. Exports saw a modest 0.1% decline, while imports rose 0.2% over the month. Trade is poised to weigh on growth in coming quarters.
Further Widening in the Trade Deficit
Data released this morning shows that the U.S. trade deficit widened to $55.5 billion in October, from $54.6 billion in September. The increase in red ink came as exports of goods and services dropped by $300 million and imports rose by $600 million.
There were broad-based declines on the export side of the ledger, with every major goods category, other than industrial supplies and consumer goods, seeing declines over the month. The food, feeds and beverages category saw its fifth monthly decline. Weakness here continues to be led by declines in soybean exports due to the distorting effects of tariffs imposed earlier this year. Services exports rose a modest 0.1% in October.
The trade-weighted value of the U.S. dollar against other major currencies has risen about 5% since the beginning of the year. All else equal, this makes exports relatively more expensive for our foreign trading partners. Despite the strong performance, we expect that the greenback will eventually reverse trend and begin to depreciate for the majority of 2019, which may be more supportive of export growth.
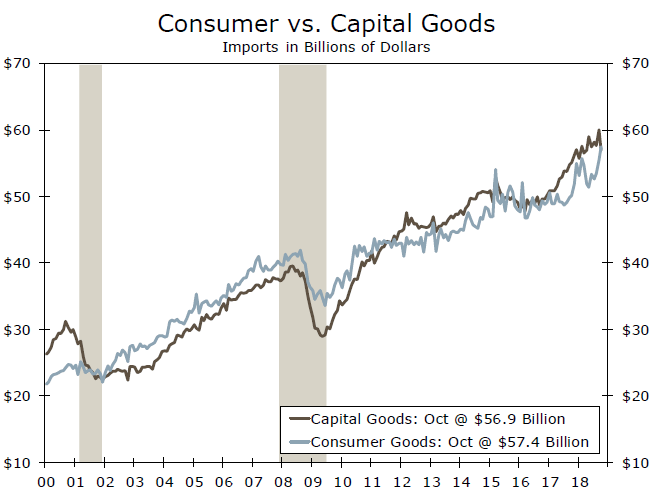
On the other side of the ledger, strong consumer demand continued to pull in imports, with consumer goods and automobiles leading import growth. But declines in capital goods and industrial supplies suggest caution among businesses. Capital goods imports declined $3.2 billion, or 5.2%, which is the largest month-over-month percentage decline since November 2008. Industrial supplies saw a more modest $224 million decline in imports. Although trade uncertainty regarding tariffs may be partially the cause of such weakness, if consumer demand remains buoyant, overall growth in imports likely will remain strong in coming quarters.
Truce or Trouble, Trade to Remain Drag on U.S. Growth
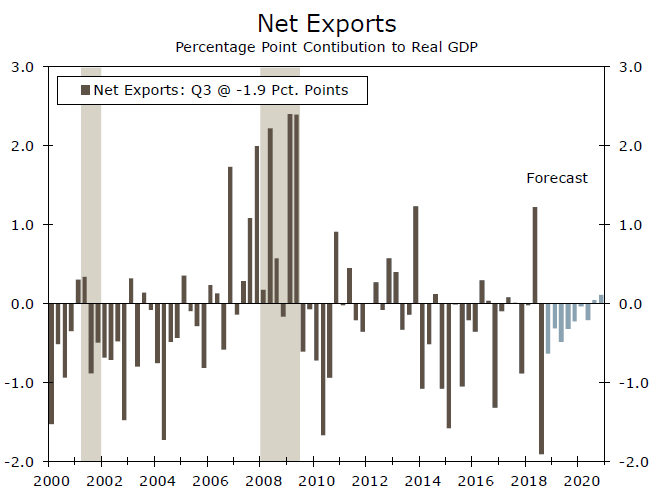
Ongoing trade tensions with China continue to add uncertainty to the outlook for trade. The Trump administration had previously said that in the absence of a resolution, the 10% tariff currently imposed on $200 billion of Chinese goods would be lifted to 25% at the start of 2019. But, the recent meeting between President Trump and President Xi at the G-20 summit in Argentina resulted in a 90-day cease-fire to allow for negotiations. Even if negotiations were to end with a trade truce, fundamentals, such as slower global growth, are not necessarily supportive of net exports being a significant driver of U.S. GDP growth over the next couple of years.
Trade-related distortions caused net exports to contribute 1.2 percentage points to GDP growth in Q2, but net exports took back 1.9 percentage points from growth in Q3. Although we expect that the drag will lessen going forward, we look for net exports to exert modest headwinds on overall GDP growth in coming quarters.
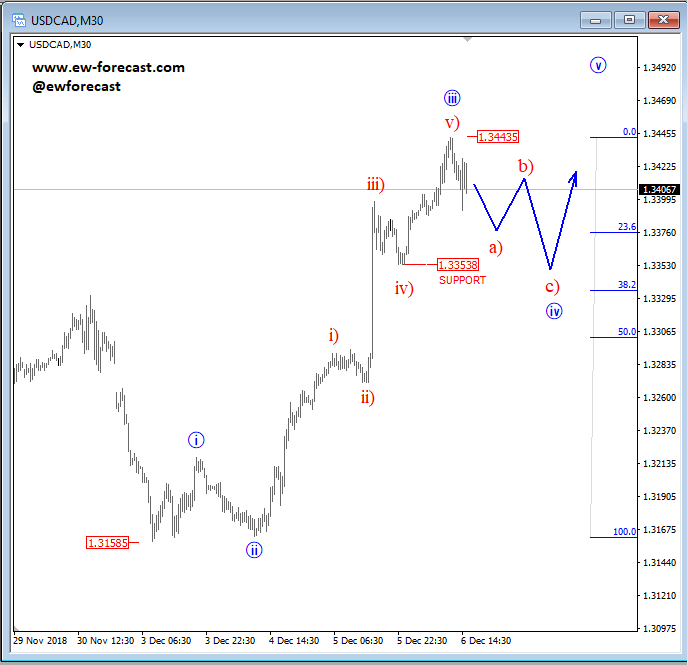
Elliott Wave Analysis: USDCAD Slowing for A Correction; More Gains in View
USDCAD unfolded a five-wave rally within wave three as part of an unfolding bullish impulse. This five-wave rally in three can be an indication of where the trend is likely going, and we expect it to slow down, and make a minor correction. This correction can be a wave iv, which can later look for support and a bullish reversal near the 1.335/1.330 region, from where final wave five can follow.
USDCAD, 1h
Japanese Yen Climbs on Market Jitters
The Japanese yen has posted considerable ground in the Thursday session. In North American trade, USD/JPY is trading at 112.40, down 0.66% on the day. In economic news, U.S. job employment numbers were soft. ADP nonfarm payrolls plunged to 179 thousand, well off the estimate of 196 thousand. This was the lowest level since May. Unemployment claims edged lower to 231 thousand, but this was higher than the estimate of 226 thousand. There was better news from the services sector, as ISM Non-Manufacturing PMI improved to 60.7, easily beating the estimate of 59.1 points. On Friday, the U.S. releases wage growth and nonfarm payrolls.
Global markets continue to spiral downward on Thursday, in what has been a dismal week for equities. Investor optimism over a 90-day truce between the U.S. and China, in which the U.S has agreed to suspend any new tariffs, quickly dissipated. Another concern for investors is an inverted yield curve of U.S Treasuries, which in the past has been a reliable indicator that a recession is coming. Investor jitters have boosted the Japanese yen, as investors have snapped up safe-haven assets like the yen.
A detente in the U.S-China trade war cannot come soon enough for the Japanese economy, as key sectors of the economy are showing signs of weakness. Japan’s manufacturing sector slowed down in November, raising concerns about the strength of the economy. Manufacturing PMI slipped to 52.2, down from 52.9 in October. The ongoing global trade war is a primary factor in the weak reading, as Japanese companies which export to the U.S. or China have been hurt by higher tariffs. A weaker eurozone economy has led to softer European demand for Japanese exports. Making matters worse, domestic demand remains fragile, as nervous consumers continue to hold tightly onto their purse strings.
What Currency Pair is the Most Difficult to Trade?
On Forex, a currency pair is the main trading instrument. Traders usually choose major currency pairs, the so-called majors. But there are other currencies available for trading: cross-pairs and exotics.
Cross currency pairs
Any currency pair that does not include the American dollar is called a cross currency pair. For example, GBP/JPY. This instrument is more unpredictable and volatile and difficult for novice traders.
In the currency majors, the dollar determines the price of the currency pair. In the crosses, both pairs are equivalent and have the same effect on price fluctuations.
Trading cross currency pairs are characterized by high volatility. The most popular cross-pairs are those that paired with the euro: EUR/CHF, EUR/GBP and EUR/JPY. In addition to cross-pairs with the euro, traders often choose cross-pairs with the Japanese yen: CAD/JPY, GBP/JPY. These pairs are characterized by low liquidity, but traders can get a profit along with good technical and fundamental analysis.
But there are also such combinations as AUD/CHF, AUD/NZD, GBP/CHF. Trading with them is more difficult and riskier than trading euro or yen currency crosses. Forex traders don’t trade too much these pairs, as the spreads can be pretty wide.
Let’s take an in-depth look at trading EUR/CHF.
EUR/CHF
The EUR/CHF quote shows how much Swiss francs you need to pay for one euro. The base currency is the euro, and the Swiss franc is the quoted one. This currency pair has its own characteristics and is not recommended for beginners. The volatility of the financial instrument is average.
The currency pair has a relatively stable movement pattern. You can earn a profit using long-term strategies. For scalpers, EUR/CHF isn’t a reliable instrument. All trading strategies are allowed at JustForex – forex broker offering favorable trading conditions.
Exotic currency pairs
Exotic currency pairs represent the ratio of the base currency to the currency of one of the developing countries. These currency pairs are rarely used in trading, have low liquidity, huge spreads and are rather difficult to forecast.
Exotic currency pairs include liquid trading instruments. Among them are: USD/TRY, USD/ZAR, USD/IDR etc. Trading exotic currencies differ from trading majors by the interest level in the market. Such currency pairs bear the risks, so they are mainly traded by experienced traders.
Features of exotics:
1. These pairs have high spreads that exclude this instrument for scalping. Trading exotics require long-term strategies.
2. Unlike the majors, trading exotic currency pairs is not easy due to its low trading activity.
3. There are not so many important news related to the economies of developing countries, so fundamental analysis may be a little bit difficult for a beginner. The currencies of developing countries often depend on domestic processes, and it is not always possible to receive such information timely.
4. Not all brokers offer the opportunity to trade such pairs. JustForex works with exotic currency pairs, so you can open a demo account and try trading with this instrument.
5. The political and financial state of developing countries may undergo rapid changes and cause a rise or fall in the value of the national currency.
Let’s consider USD/ZAR.
USD/ZAR
The Rand (ZAR) is the currency of South Africa. The USD/ZAR quotes show how much South African Rand you need to pay for one American dollar. The US dollar is the base currency, and the South African Rand - the quoted one. The South African rand is a commodity currency. Factors affecting the USD/ZAR price are the demand for precious metals and raw materials.
Finding high-quality and relevant analytics for this pair is hard. Furthermore, the news on this currency pair is released pretty rarely. But it should be noted that all the news related to the US dollar is worked well on the USD/ZAR currency pair.
The USD/ZAR currency pair is characterized by high volatility, which is perfect for scalping. Also, due to the high volatility, it is worthwhile to plan money management properly.
Bottom line
In addition to these groups, traders also choose metals: XAU/USD, XAG/USD. These instruments are liquid; however, they are difficult to trade for beginners.
With a proper strategy and right tactics, trading can bring a good profit. So, it is necessary to know the basics of the market, as well as to stay up-to-date on important events. It“s also important to remember that anytime you can do some trading practice on a Demo account free of charge.