Sample Category Title
ECB Preview – Focus on Reinvestment Plan, New Round of TLTRO
The market is closely watching ECB’s policy after QE. At the upcoming meeting next week, ECB would announce its plan to reinvest the maturing bonds. Meanwhile, market speculations are rising that the central bank would soon announce a new round of its targeted long-term refinancing operations (TLTRO). Given recent slowdown in GDP growth in the bloc, it is likely that the staff would revise lower the forecasts on growth and inflation for coming years.
Post- QE Reinvestment
At the previous meeting, ECB kept the main refi rate stays at 0% and the deposit rate at -0.4% and reaffirmed that the policy rates would stay on hold until at least the summer of 2019, to ensure that inflation returns sustainably to the target of below, but close to, 2%. More importantly, it affirmed that its asset purchase program, reduced to 15B euro per month from October to December, would by the end of the month. In order to lessen the disturbance to the market, the central bank, like what the Fed did in 2014, would reinvest the maturing bonds assets after QE ends in December. The focus at next week’s meeting is announcement of the reinvestment plan and schedule.
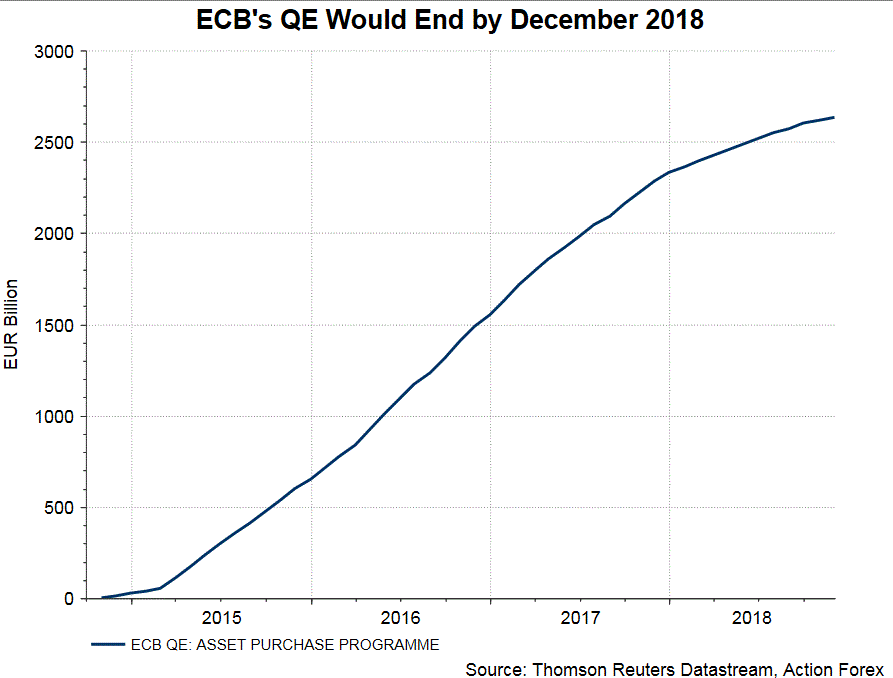
Earlier this week, the central bank announced the changes it made on the capital key, which is used to determine the proportion of capital each of the national central banks must contribute to the ECB, and the portion of the ECB's profits they would receive in return. Such measure is adjusted once every five years based on population and GDP data from European Commission. As suggested in ECB’s press release on Monday, 16 national central banks (including Germany, France and Austria) have their share adjusted higher and 12 (including Italy, Spain and Greece) lower. President Mario Draghi noted in July that the central bank would follow the capital key when deciding on reinvestment. Therefore, this change would affect ECB’s portfolio in the reinvestment process. We expect to hear more details next week.
New Round of TLTRO
ECB first launched TLTRO in Jun 2014, followed by another round in March 2016. All operations are expected to mature by June 2020. Market speculations are rising on the scenario that ECB would announce an extension/ or a new round as soon as next week. Through TLTROs, one of the ECB’s non-standard monetary policy tools, ECB provides long-term loans to banks , incentivizing them to increase their lending to businesses and consumers in the Eurozone.
We believe ECB will, and should, launch another round of TLTRO, either this month, or in early 2019. If TLTRO ends as it matures, banks’ borrowing costs would increase. This in turns would result in higher borrowing costs to private sector. Moreover, funding costs for the banking sectors in the periphery, such as Italy, have soared due to an increase in the sovereign bond yield. They are in need of ongoing assistance from the central bank or tighter credit conditions would suffocate the gradual pace of economic recovery in these countries.
ECB’s reinvestment plan after the end of QE aims at maintaining the balance sheet at the current level. A balance sheet that is no longer expanding like the past several years would have tightening effect in the market. Rising lending rates would likely amplify the tightening effect of the removal of the asset purchase program. ECB noted that it would leave the policy rates unchanged at least until the summer of 2019. This is portably under the assumption that all other things being equal, other than the end of QE. We expect an overly tight credit conditions would affect the schedule of ECB’s removal of negative rates, especially when we are facing moderation of global economic growth. We believe new TLTRO should help alleviate the market impact of the end of QE, and pave the way for ECB to gradually remove negative interest rates in coming years.
JP225 Stock Index Slumps To 2-Week Lows, Bias Still Negative
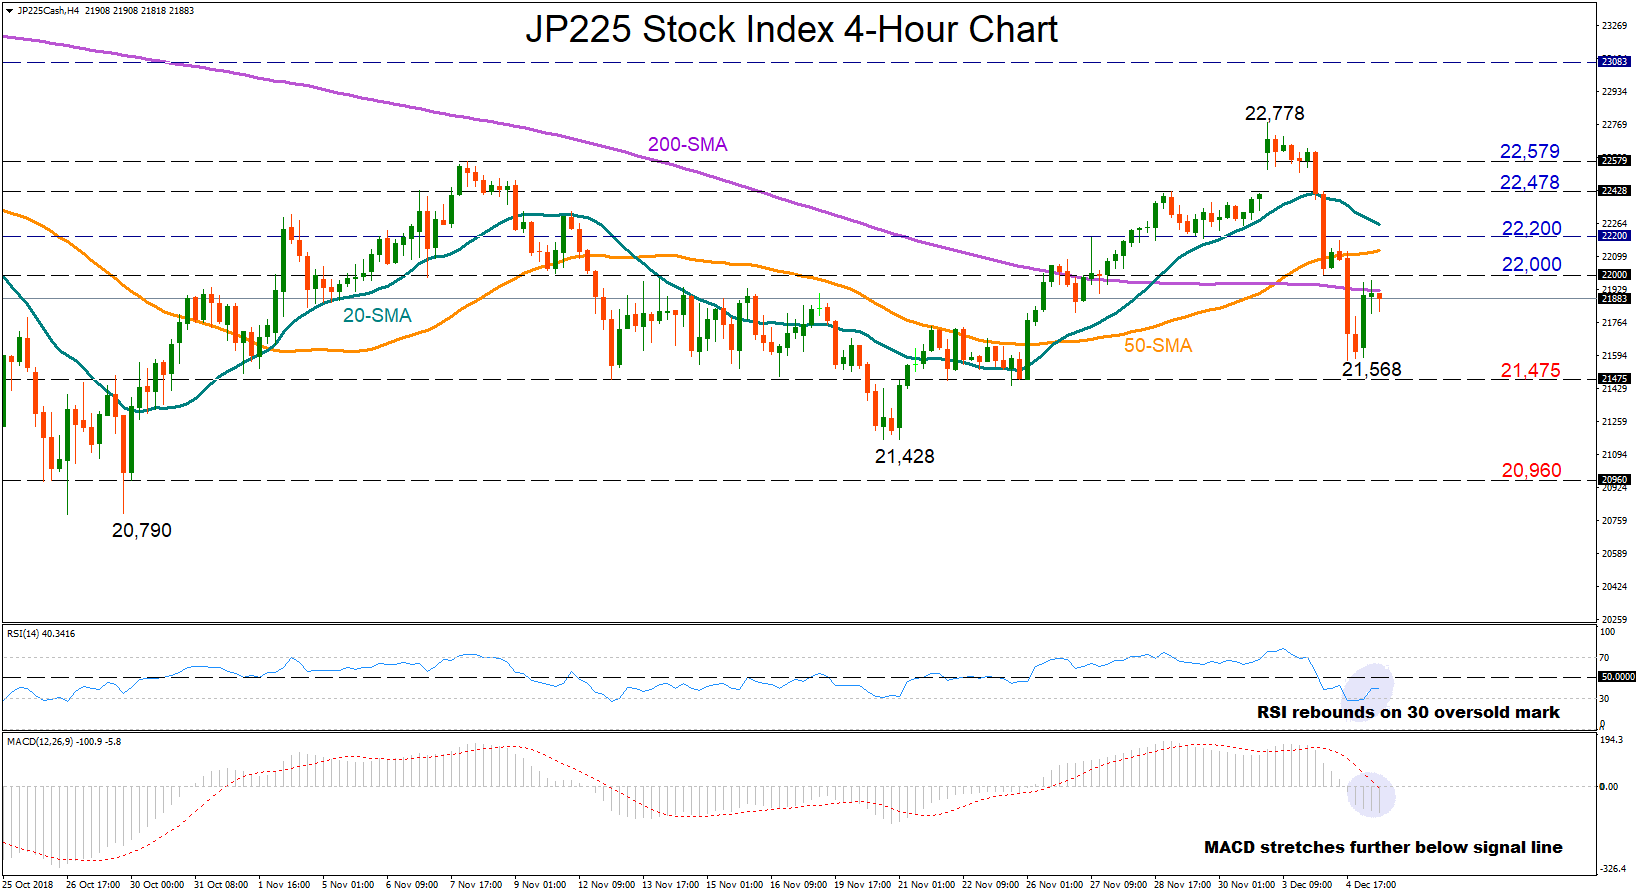
Japan 225 stock index peaked at 22,778 on Monday, the highest since mid-October but on Tuesday the market faced severe pressure, dropping straight down to an almost two-week low of 21,568 and back below the 200-period simple moving average (SMA) on the four-hour chart.
Today the index is in recovery as the recent sell-off appeared overstretched according to the RSI, with the indicator rebounding off the 30 oversold level. The MACD, though, hasn’t shown any improvement yet, extending negative momentum below its red signal line and in the negative zone, a sign that bearish action could resume.
Should the price move south again, the area between 21,568 and 21,475 could be reasonably watched as this is where bearish forces paused recently. A decisive breach of that region would then open the door for the 21,428 bottom registered on November 20. If that fails to hold as well, attention would turn to the 20,960 support seen at the end of October.
On the flip side, if the market continues to strengthen, immediate resistance may come around 22,000 before another wall appears at 22,200, identified by the lows on November 29. Moving higher, the 22,428-22,579 area could also limit upside corrections, as it did last month.
In the bigger picture, the index keeps trading within the 20,790-22,778 range but the rising 50-period SMA which managed to cross above the 200-period SMA for the first time since mid-October increases hopes for further gains in the market.
To sum up, JP225 stock index is bearish in short-term but neutral overall.
EURJPY Remains In Sideways Channel, Fails To Create Clear Tendency
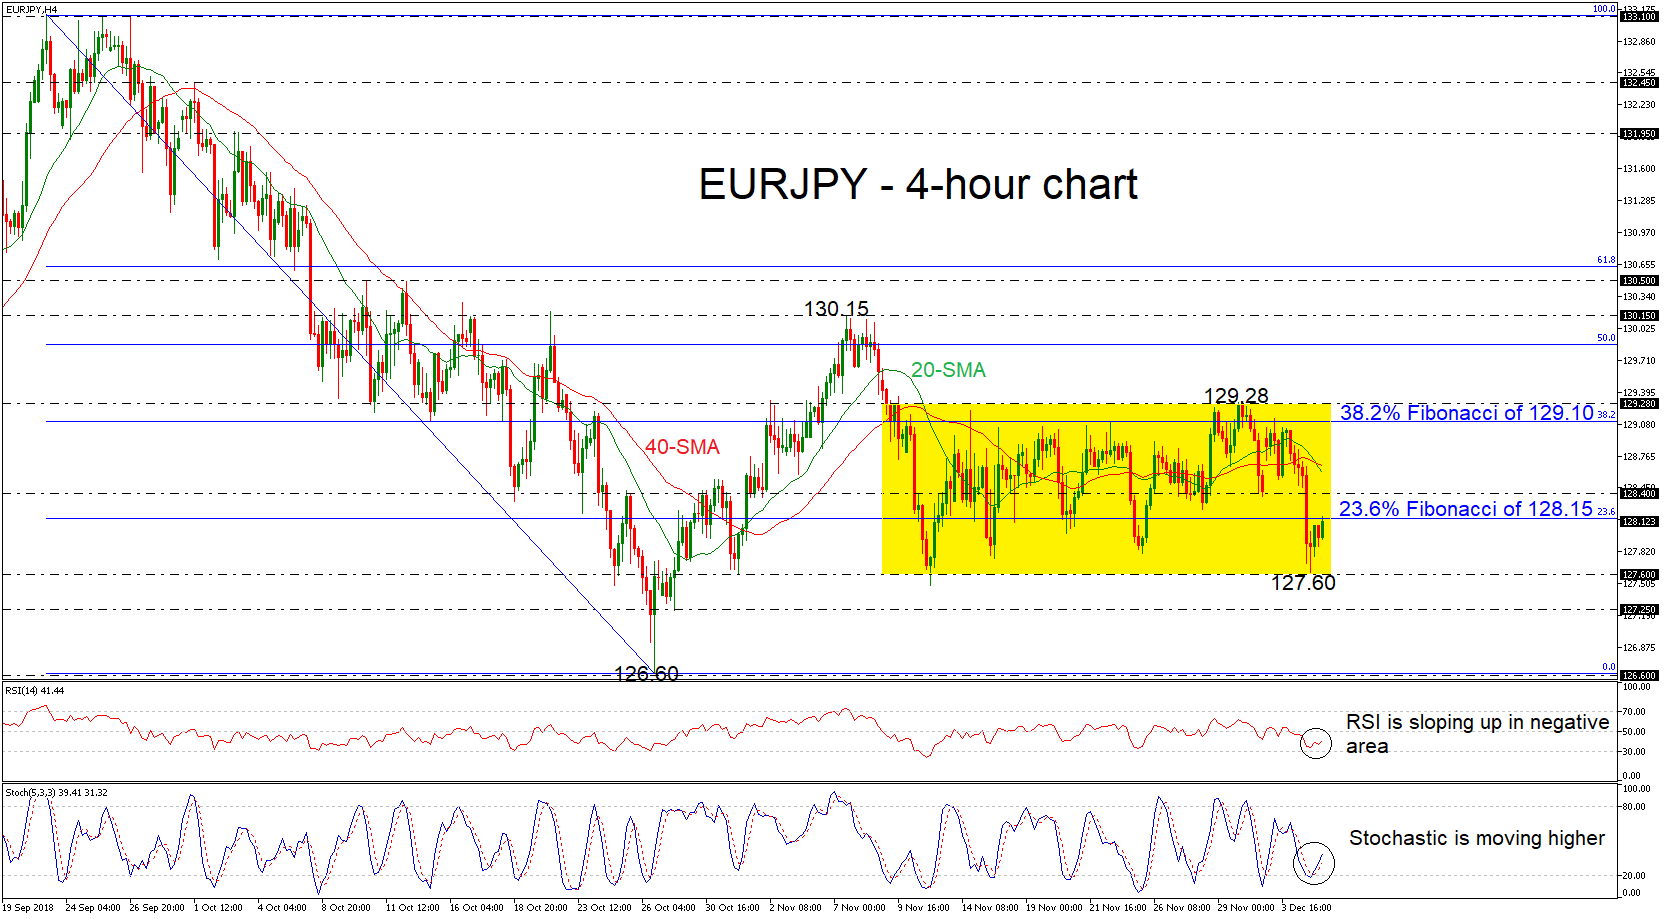
EURJPY has been developing within a sideways channel over the last month, with upper boundary the 129.28 resistance barrier, and lower boundary the 127.60 support level. Currently, the price bounced off the 23.6% Fibonacci retracement level of the downleg from 133.10 to 126.60, around 128.15.
Technically, in the 4-hour chart, the RSI indicator is moving slightly higher below the threshold of 50, while the stochastic oscillator is moving higher after the bullish crossover within the %K and %D lines.
However, if prices remain below the 23.6% Fibonacci, they could dip towards the lower boundary of the range. A penetration of this level could endorse the negative structure, sending prices until the 127.25 hurdle. More bearish pressures could find support at the 126.60 obstacle.
Alternatively, if the market manages to turn to the upside and overcome the aforementioned strong Fibonacci level, attention could turn to the 128.40 resistance. A clear run above this region, the pair could touch the bearish cross between the 20- and 40-simple moving averages (SMAs) near 128.65. Even higher, the 38.2% Fibonacci of 129.10 could be next level to focus on.
Concluding, the market is predicted to remain neutral in the short-term.
The Analytical Overview Of The Main Currency Pairs
The EUR/USD currency pair
Technical indicators of the currency pair:
Prev Open: 1.13523
Open: 1.13413
% chg. over the last day: -0.11
Day's range: 1.13168 – 1.13462
52 wk range: 1.1299 – 1.2557
Yesterday's trading in major currency majors was very active. At the same time, a unidirectional trend was not observed. The dollar index (#DX) closed the trading session with a slight decrease (-0.07%). Participants of financial markets are concerned about the inversion of the US government bonds yield curve and the risks of a trade war. At the moment, the EUR/USD currency pair is consolidating in the range of 1.13200 and 1.13450. Positions must be opened from these marks.
At 11:00 (GMT+2:00) a number of indices on economic activity in the eurozone will be published.
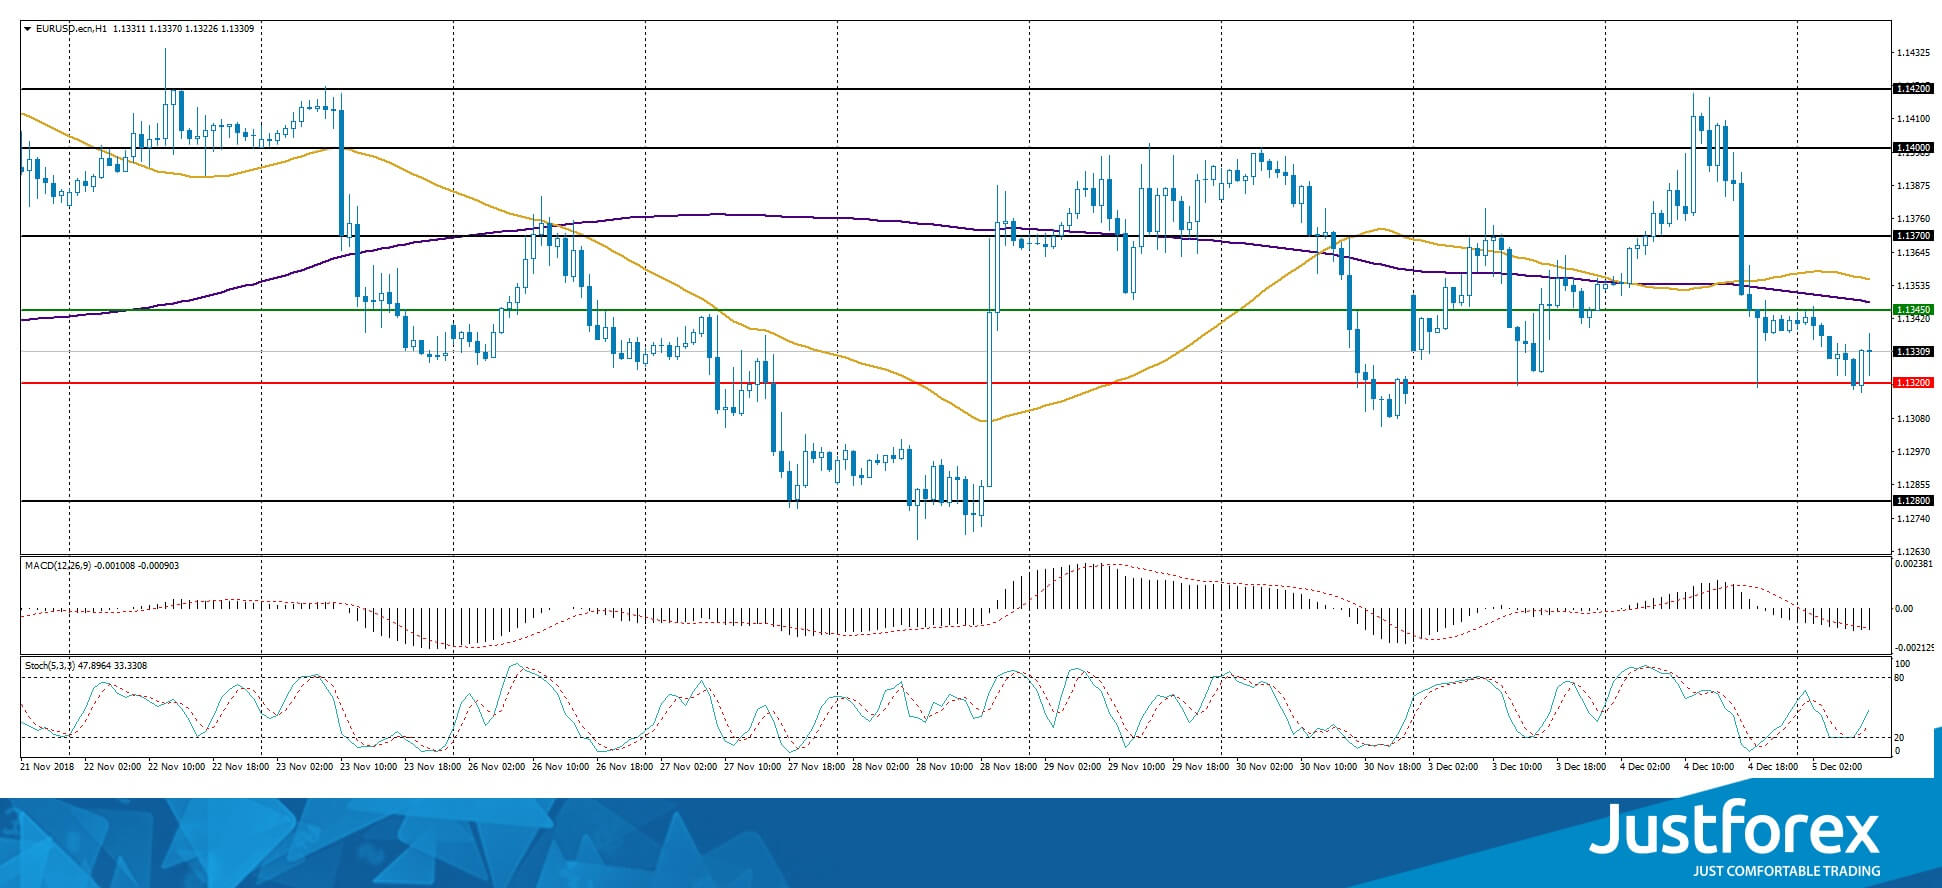
Indicators do not send accurate signals: 50 MA has begun to cross 200 MA.
The MACD histogram is in the negative zone and below the signal line, indicating the bearish sentiment.
Stochastic Oscillator has started to go out of the oversold zone, the %K line is above the %D line, which gives a signal to buy EUR/USD.
Trading recommendations
Support levels: 1.13200, 1.12800
Resistance levels: 1.13450, 1.13700, 1.14000
If the price fixes below the support level of 1.13200, it is necessary to consider selling EUR/USD. The movement is tending to 1.12800-1.12600.
An alternative could be the recovery of the EUR/USD quotes to the level of 1.13700-1.14000.
The GBP/USD currency pair
Technical indicators of the currency pair:
Prev Open: 1.27232
Open: 1.27080
% chg. over the last day: -0.04
Day's range: 1.26717 – 1.27276
52 wk range: 1.2662 – 1.4378
The technical pattern on the GBP/USD currency pair is still ambiguous. At the moment, quotes are testing key support and resistance levels: 1.26800 and 1.27250, respectively. Investors expect relevant information regarding the Brexit process. Optimistic statistics on the UK business provides additional support for the pound. We recommend opening positions from key levels.
At 11:30 (GMT+2:00) the index of economic activity in the UK services sector will be published.
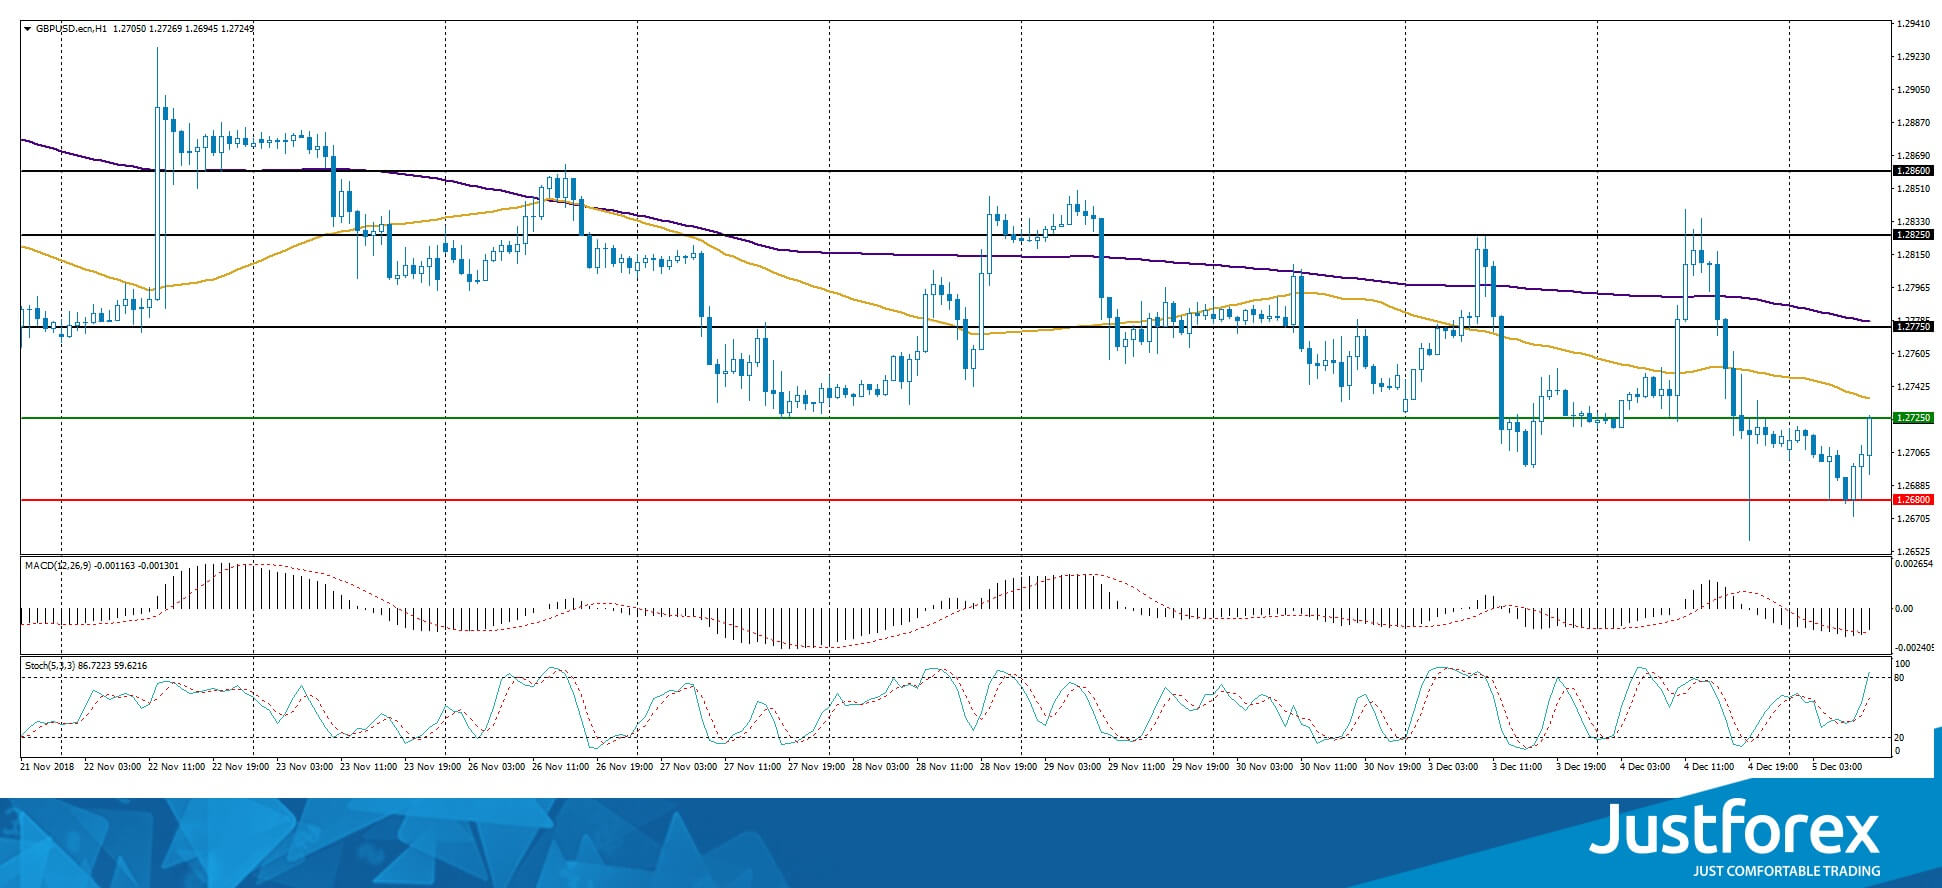
Indicator signals are different. The price has approached 50 MA, which is a strong dynamic resistance.
The MACD histogram is in the negative zone, but above the signal line, which gives a weak signal to sell GBP/USD.
Stochastic Oscillator is in the neutral zone, the %K line is above the %D line, which indicates the bullish sentiment.
Trading recommendations
Support levels: 1.26800, 1.26500
Resistance levels: 1.27250, 1.27750, 1.28250
If the price fixes above the resistance level of 1.27250, the GBP/USD quotes are expected to grow. The movement is tending to 1.27750-1.28000.
An alternative could be a decrease in the GBP/USD currency pair to 1.26500-1.26300.
The USD/CAD currency pair
Technical indicators of the currency pair:
Prev Open: 1.31967
Open: 1.32578
% chg. over the last day: +0.45
Day's range: 1.32523 – 1.32924
52 wk range: 1.2248 – 1.3387
The USD/CAD currency pair recovered most of its losses after a sharp decline on Monday, December 3. During yesterday's and today's trading, the growth of the USD/CAD quotes amounted to almost 100 points. At the moment, Loonie is consolidating near the local resistance of 1.32900. The mark of 1.32600 is already a “mirror” support. Investors took a wait and see attitude before a meeting of the Bank of Canada. It is expected that the regulator will maintain the basic parameters of the monetary policy. Positions must be opened from the key levels.
At 17:00 (GMT+2:00), the Bank of Canada will announce its decision on the key interest rate.
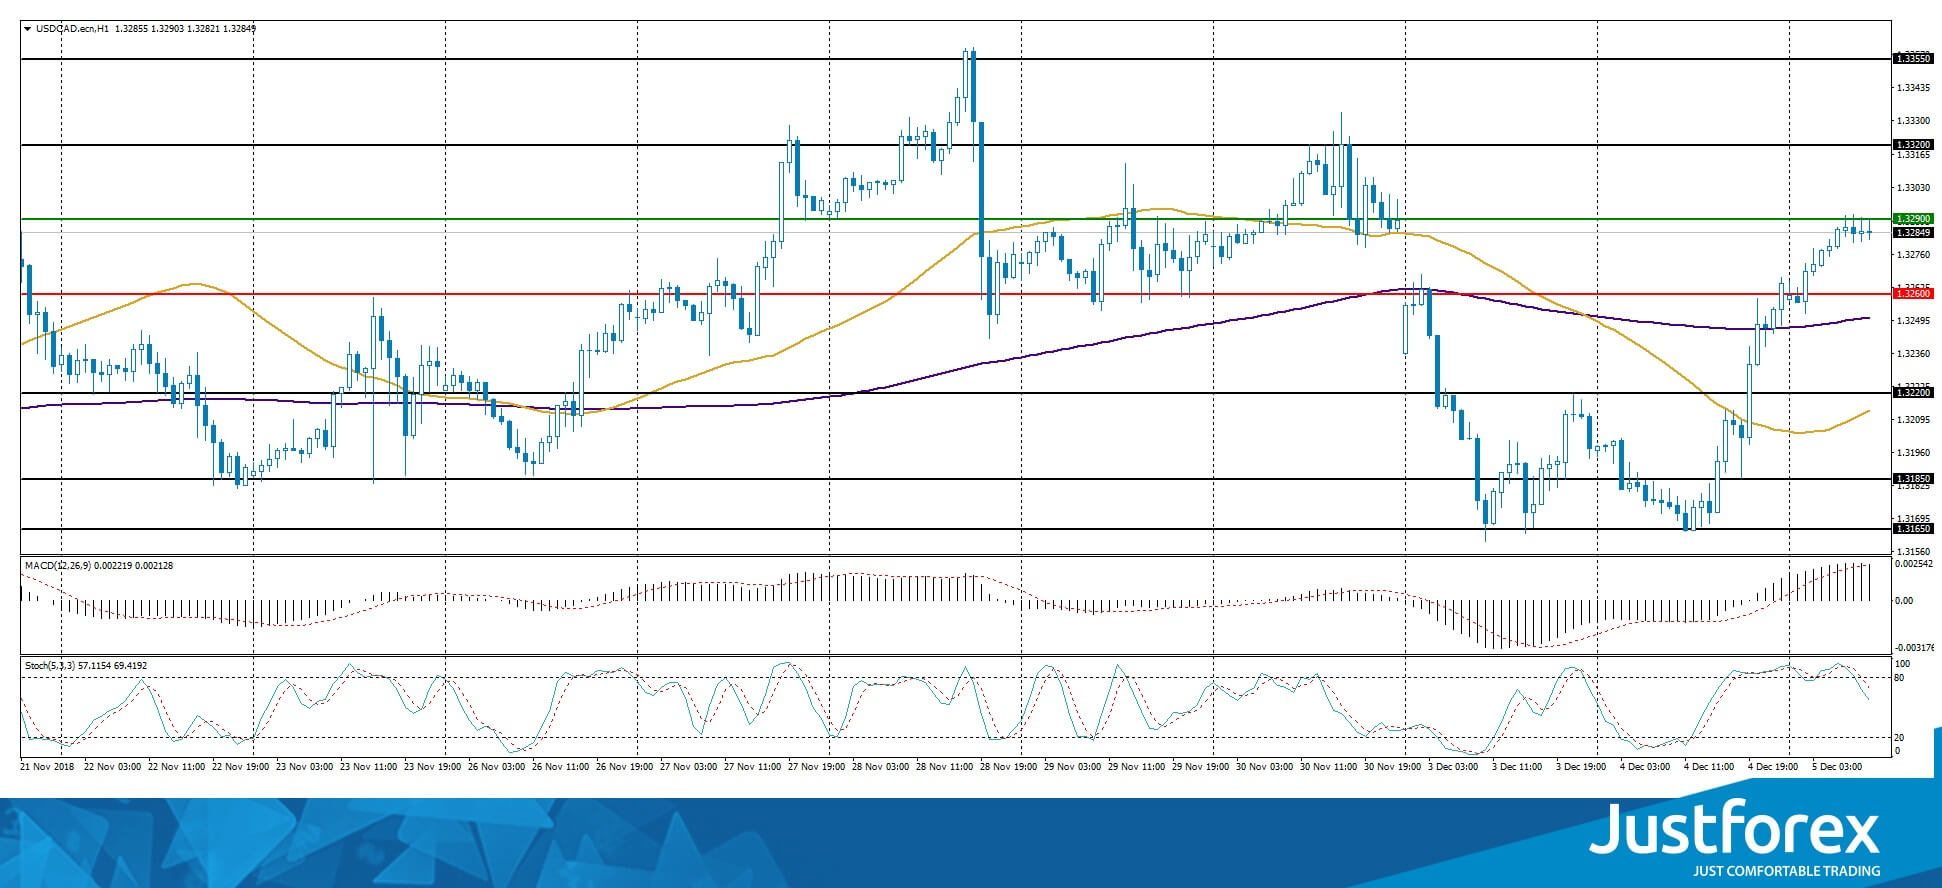
The price has fixed above 50 MA and 200 MA, which indicates the power of buyers.
The MACD histogram is in the positive zone and above the signal line, which gives a strong signal to buy USD/CAD.
The Stochastic Oscillator is in the neutral zone, the %K line is above the %D line, which indicates a drop in the USD/CAD quotes.
Trading recommendations
Support levels: 1.32600, 1.32200, 1.31850
Resistance levels: 1.32900, 1.33200, 1.33550
If the price fixes above the local resistance of 1.32900, further growth of the USD/CAD quotes is expected. The movement is tending to 1.33200-1.33500.
Alternative option. If the price fixes below 1.32600, we recommend looking for market entry points to open short positions. The movement is tending to 1.32300-1.32000.
The USD/JPY currency pair
Technical indicators of the currency pair:
Prev Open: 113.604
Open: 112.753
% chg. over the last day: -0.86
Day's range: 112.896 – 113.657
52 wk range: 104.56 – 114.74
The USD/JPY currency pair is consolidating after a sharp decline during yesterday's trading. The technical pattern is ambiguous. Local levels of support and resistance are 112.900 and 113.150, respectively. Positions must be opened from these marks. We recommend paying attention to the dynamics of the yield of US government bonds. The USD/JPY currency is tending to decline.
The news feed on the Japanese economy is calm.
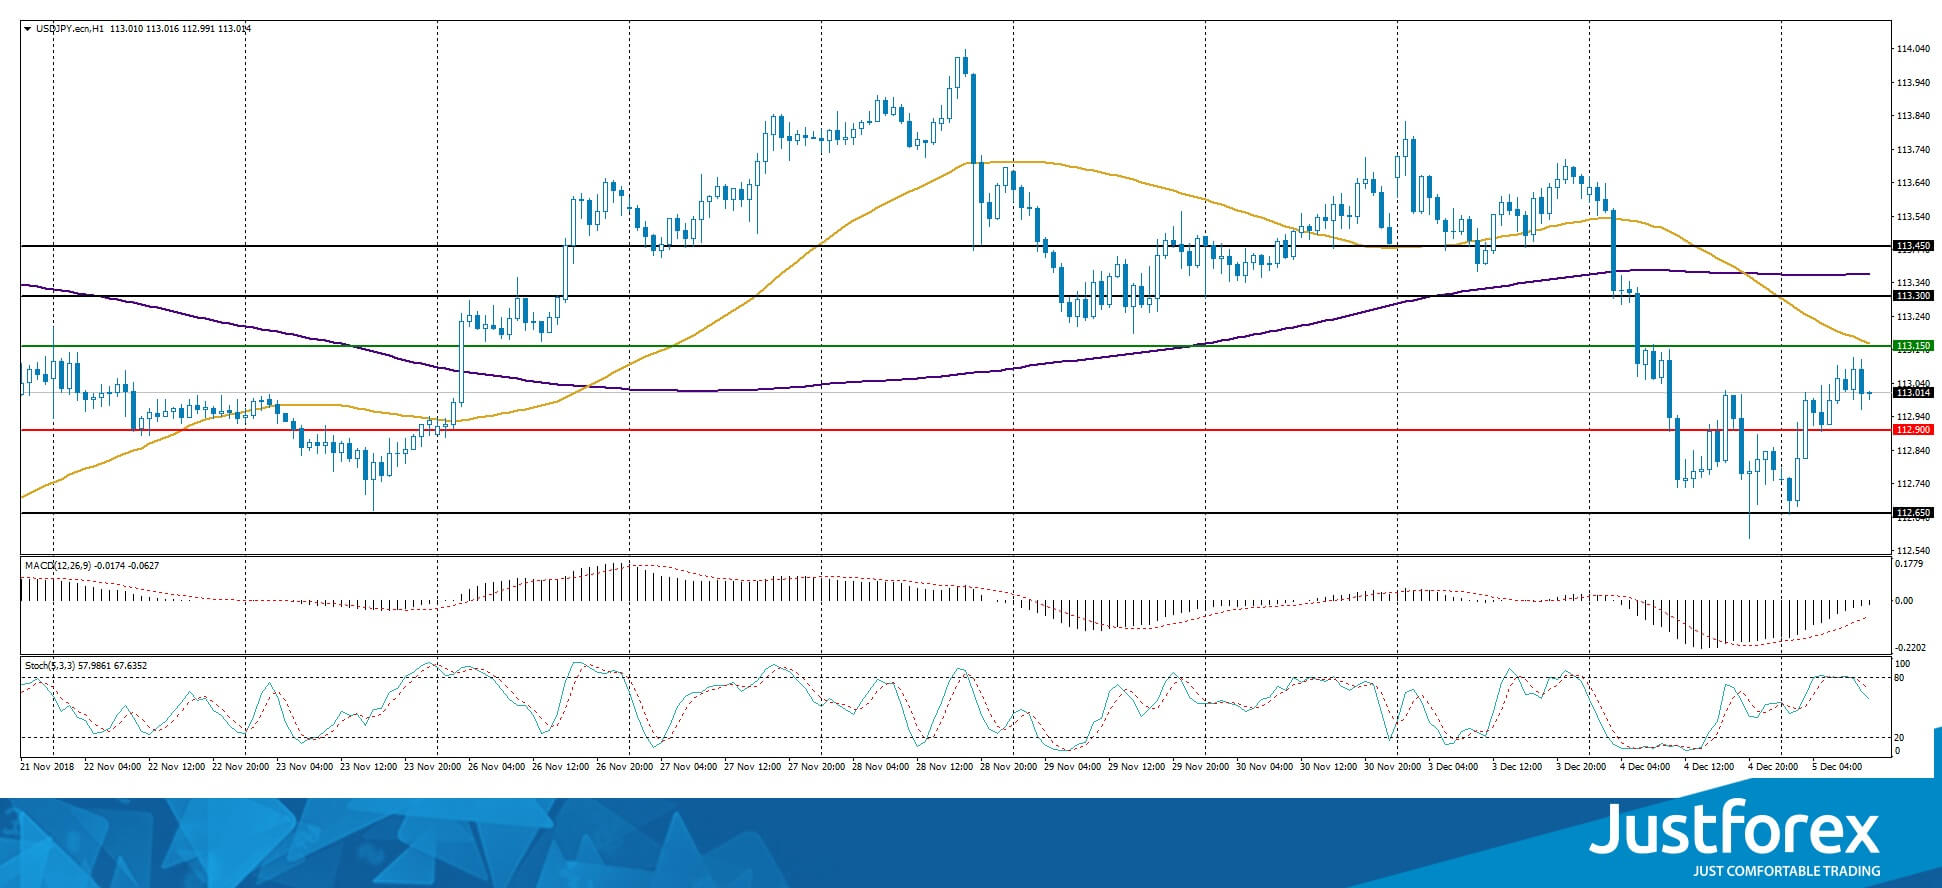
The price has fixed below 50 MA and 200 MA, which indicates the power of sellers.
The MACD histogram is close to the 0 mark. There are no accurate signals.
The Stochastic Oscillator is in the neutral zone, the %K line is below the %D line, which gives a signal to sell USD/JPY.
Trading recommendations
Support levels: 112.900, 112.650
Resistance levels: 113.150, 113.300, 113.450
If the price fixes below the support level of 112.900, it is necessary to consider selling USD/JPY. The movement is tending to 112.650-112.500.
An alternative could be the growth of the USD/JPY quotes to 113.300-113.500.
The Major Currencies Are Showing A Variety Of Trends
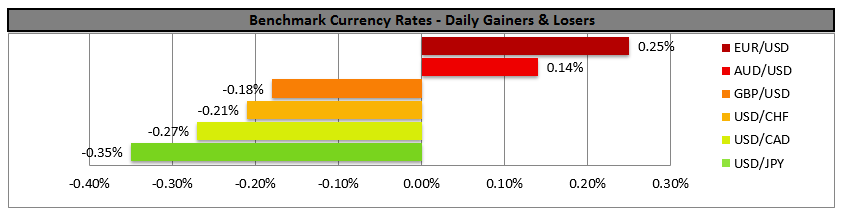
Yesterday, the trade on the major currency pairs was very active, although there wasn't a unified trend. The USD was slightly weakened against the other major currencies due to the inversion of the US government bonds yield curve. Investors are still worried about the US/China trading war, especially since Donald Trump announced that he might still increase the fees on the Chinese wares if China and the US wouldn't be able to reach a compromise. This compromise must be reached in the next 90 days of truce. The USD index (#DX) closed in the red (-0.07%).
Yesterday the UK published some positive reports. For example, the construction PMI reached 53.4 while the investors were expecting 52.5. The British pound remains under pressure due to the debates in the British parliament concerning Brexit, which will last for five days.
During the Asian trading session, Australia published weak GDP reports. The indicator for the third quarter is +0.3% while the experts expected +0.6%. The financial market participants are waiting for the Bank of Canada to decide on the key interest rate.
Prices on oil started to descend. The WTI futures are testing the 52.25 USD/barrel mark.
Market Indicators
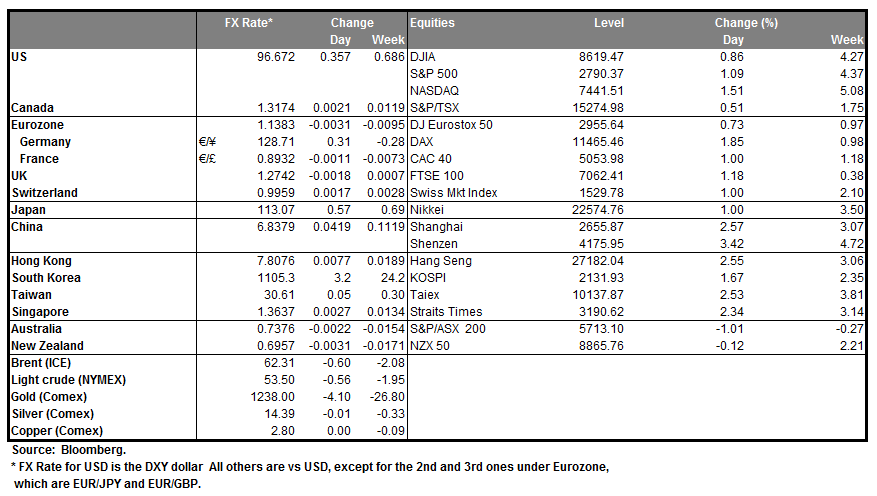
- There were some aggressive sales on the US stock market yesterday: #SPY (-3,24%), #DIA (-3,09%), #QQQ (-3,84%).
- The 10-year US government bonds yield keeps lowering. At the moment it is at 2.91-2.92%.
The Economic News Feed for 05.12.2018:
- Service PMI (UK) – 11:30 (GMT+2:00);
- A decision on the key interest rate in Canada – 17:00 (GMT+2:00);
- Beige Book – 21:00 (GMT+2:00).
British Pound In Death Spiral | Investors Trust More Xi Than Trump
Market participants were nervous yesterday over on Wall Street and this resulted in a major sell-off. The Dow Jones dropped by over 3.10% and the S&P500 also lost nearly over 3.24%. Investors simply didn’t believe that the trade truce has any legs. However, this was only until China officially called the trade talks between Washington and Beijing very successful. Trump can say whatever he likes, markets have started to doubt his statements because of all the back paddling and the White House covering his tracks, the affirmation of 90 days truce is more meaningful coming out of Xi Ping, the Chinese President than President Trump.
In other words, markets wanted to hear the confirmation of Trump’s statement from China. Now, Beijing has confirmed that it is optimistic that both countries should be able to iron out all the pending issues in a more progressive manner. This has restored the confidence and risk on assets are back in demand. The dollar index rose yesterday but now some steam has come out of it. Similarly, the Treasuries would also get a chance to catch up their breath as the yields are likely to slide.
Talking about not trusting the leader's word, no one has suffered the most humiliating defeat in British history as Theresa May. The prime minister suffered a triple defeat yesterday and this opened the door for the parliament to prepare for plan B when her Brexit deal gets voted down in the parliament in the coming days. The prime minister has already started to defend her deal, the details of which will be published today. May said that it is the best “compromise” that Britain can get but the Parliament believes otherwise. We are looking at the possibilities of No Brexit or pursue a softer withdrawal which could include staying in the bloc's single market. So, do not be surprised if the argument of another referendum starts to pick up more momentum.
In the midst of this, the British Pound is in death spiral mode, thanks to Brexit chaos. The force of gravity is pulling it down and the price has broken a critical level of 1.27 against the dollar, currently trading at 1.269 and the doors are wide open for the price to touch the level of 1.25 again. The higher odds of no Brexit deal are creating more uncertainty among traders. If the UK comes out of the EU with no deal, it would be no short of a catastrophe, the Bank of England and the Treasury has already raised several warnings about this. Just to put things in perspective, the housing sector could see the prices fall as much as 30 percent and the pound could fall to 1.22 against the dollar.
BOC Interest Rate Decision
In the American session, we get BoC's interest rate decision and the bank is widely expected to remain on hold at +1.75%, after October's 25 basis points rate hike, with CAD OIS currently implying a probability for the bank to remain on hold of 94.78%. Fundamentals behind the Loonie could suggest a wait and see position for the bank, as oil prices were dropping until recently. The headline inflation rate could support a more hawkish stance, while the GDP and recent employment data, could be advising caution. We would concentrate our focus for the Loonie, on whether the wording of the accompanying statement could provide any clues about the next rate hike (maybe in January), as well as the OPEC meeting on Thursday could fundamentally influence oil prices.
USD/CAD rallied yesterday breaking the 1.3215 (S1) resistance line (now turned to support). We could see the pair stabilising ahead of BoC's interest rate decision later today and depending on the decision and the contents of the accompanying statement decide the direction of the next leg. Should the pair find fresh buying orders along its path, we could see it breaking the 1.3290 (R1) resistance line and aim for the 1.3350 (R2) resistance hurdle. Should the pair come under selling interest, we could see it breaking the 1.3215 (S1) support line and aim for lower grounds.
Brexit fears intensify as May loses critical votes in UK Parliament
The pound experienced some more choppy trading yesterday, as Brexit headlines were reeling in throughout the day. Early during the European morning, a media report stated that an EU's high court (ECJ) indicated that the UK could unilaterally reverse Brexit. Then UK's PM Theresa May, suffered three defeats in the UK Parliament, as she tried to convince it for her Brexit deal. Two vote counts found the UK government in contempt of Parliament and forced the PM to release a secret government legal advice (due out today) on her Brexit plan. The third vote, gives the Parliament the power to shape the final Brexit settlement if her plan doesn't pass the House of Commons. We consider the defeats in parliament, as further indications that May's Brexit deal may not pass on the 11th of December. Volatility is expected to continue today and the pound may remain under pressure as difficulties mount for Theresa May. Despite cable rising during the European session and the breaking the 1.2780 (R2) resistance line, later on it dropped heavily, breaking consecutively the 1.2780 (R2) and the 1.2700 (R1) support lines (now turned to resistance). We could see cable continuing to trade in a bearish market as Brexit headlines are expected to continue reeling in. We expect market focus to be on Brexit today for GBP traders, however some support could be provided for the pound by the release of UK's November Services PMI. Should the bears continue to dictate the pair's direction we could see it breaking the 1.2630 (S1) support line and aim for the 1.2555 (S2) support barrier. Should on the other hand the bulls take over, we could see the pair, breaking the 1.2700 (S1) support line and aim for the 1.2780 (S2) support hurdle.
In today's other economic highlights:
In today's European session, we get Eurozone's final Composite PMI for November and retail sales growth rate for October. Also during the European session we get UK services PMI for November. As for speakers, ECB's president Mario Draghi will be speaking during the European session today and please note that the US markets are expected to be closed as former US president George H.W. Busch will be remembered.
USD/CAD H4
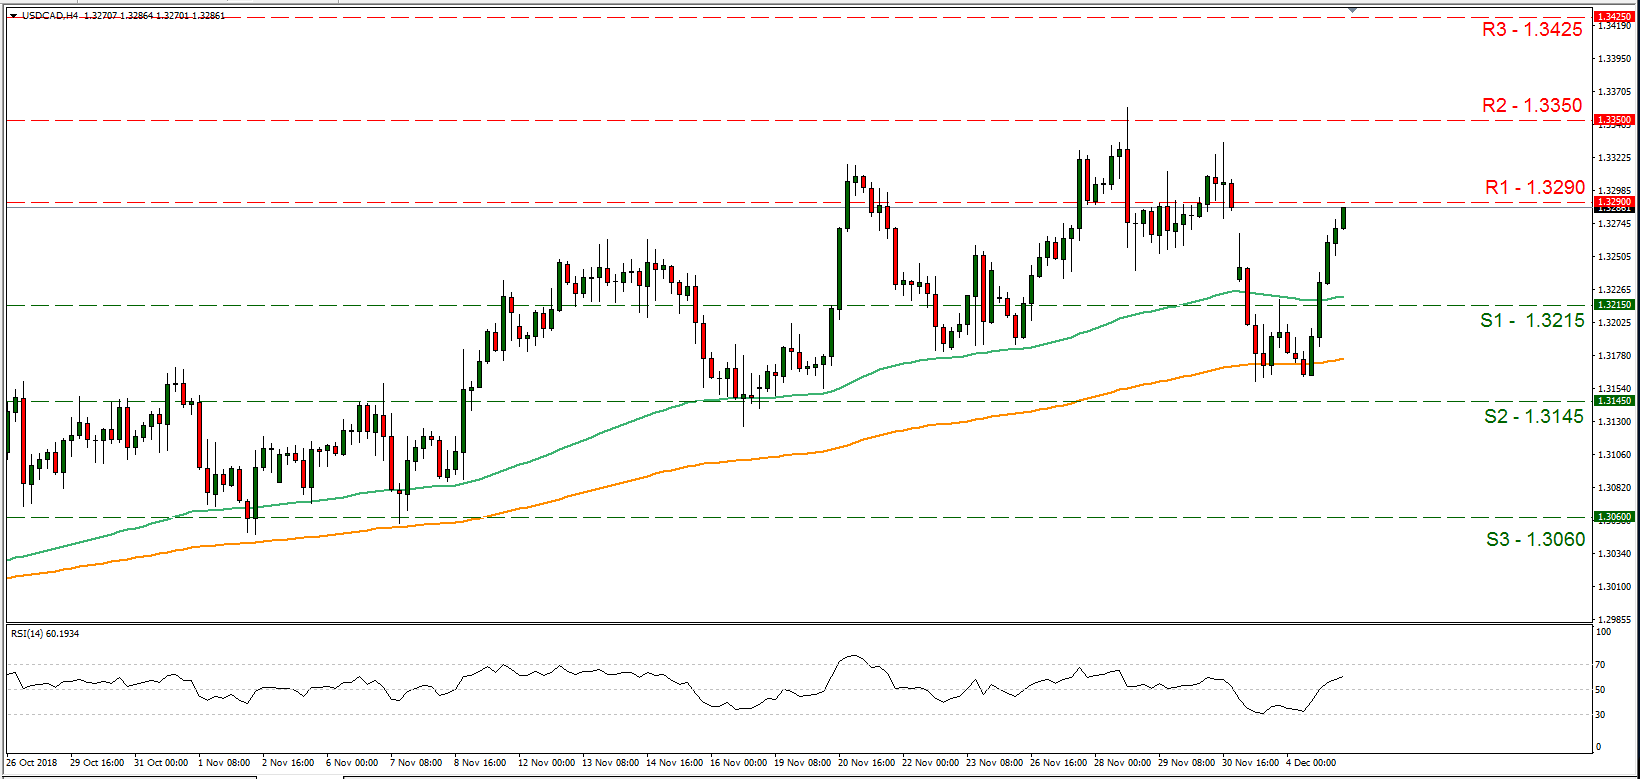
Support: 1.3215(S1), 1.3145 (S2), 1.3060 (S3)
Resistance: 1.3290 (R1), 1.3350 (R2), 1.3425 (R3)
GBP/USD H4
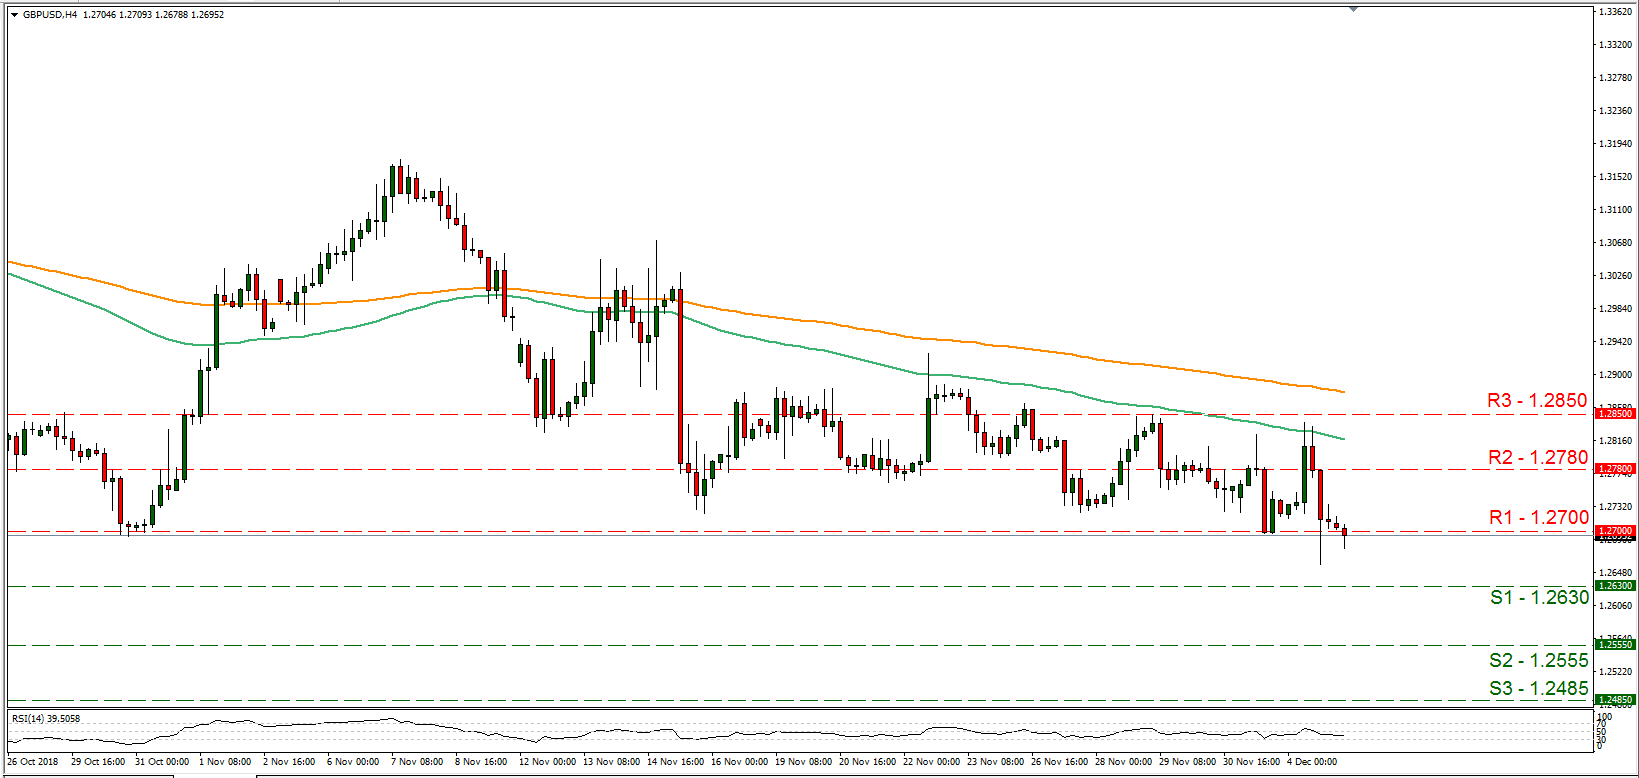
Support: 1.2630 (S1), 1.2555 (S2), 1.2485 (S3)
Resistance: 1.2700 (R1), 1.2780 (R2), 1.2850 (R3)
The United States Launched The New Nuclear Race With Russia
The United States delivered Russia a 60-day ultimatum on Tuesday to come clean about what Washington says is a violation of a arms control treaty that keeps missiles out of Europe, saying only Moscow could save the pact. NATO allies led by Germany pressed U.S. Secretary of State Mike Pompeo at a meeting in Brussels to give diplomacy a final push before Washington pulls out of the 1987 Intermediate-range Nuclear Forces Treaty, fearing a new arms race in Europe.
NATO foreign ministers agreed to formally declare Russia in “material breach” of the INF treaty in a statement in support of the United States, after Pompeo briefed them at the alliance headquarters in Brussels on Russian violations and on U.S. President Donald Trump’s stated aim to withdraw from it. Russia denies undertaking any such development of land-based, intermediate-range Cruise missile capable of carrying nuclear warheads and hitting European cities at short notice.
Germany, the Netherlands and Belgian are concerned about the deployment of U.S. missiles in Europe – as happened in the 1980s, touching off large anti-American demonstrations – while being caught up in nuclear competition between Moscow and Washington. A U.S. exit from the INF treaty would put another strain on NATO allies already shaken by Trump’s demands for higher defense spending and what diplomats say is a lack of clarity about where U.S. strategy is heading on the issue. Washington has said it would be forced to restore the military balance in Europe after the 60-day period but Pompeo declined to elaborate, saying only that tests and deployments of new missiles were on hold until then. He also said that because China, Iran and North Korea were not signatories to the INF, the United States was putting itself at a disadvantage by not developing medium-range missiles, citing three failed diplomatic attempts to enlarge the treaty.
Waves Cryptocurrency Rate Jumped 50%
Waves, a token platform with the web developer generation in mind, has seen its base token rise nearly 50 percent over the last 24 hours amid a generally-stagnant crypto market, making analysts scratch their heads – what could be driving this? Aside from the normal hustle and flow of cryptocurrencies gaining wider adoption, we think we might have found the answer to increased demand for Waves — their updated mobile wallet, which now enables credit card purchase of Waves that can then be exchanged across the mobile exchange for Bitcoin and a host of other cryptos.
The app currently has more than 100,000 installs in Google Play. As they wrote in their blog on the subject: “Open the app and you’ll find the most popular features of the desktop client at your fingertips. This isn’t just a wallet by any means. You can trade on DEX, with the great tools and charts you’ve come to expect but with the convenience of mobile. There’s also access to fiat and crypto gateways, so you can deposit, store, trade and withdraw other assets. We’ve incorporated the most popular digital asset management tools from the platform, so you can send tokens to your address book contacts, lease your WAVES, receive warnings about suspicious tokens and burn any spam assets you don’t want.”
Unfortunately for US users, you won’t be able to get into the crypto market using a credit card through this app. Coinbase still seems to be the best option for that. Waves Wallet uses Indacoin, which doesn’t support US customers. Like Ethereum, the factors that drive demand for Waves have to do with the tokens on the platform. It has a few successful ones, and a number more in the works. One of its better known and higher volume tokens is MobileGO, which trades higher against Waves than it does against most other currencies.
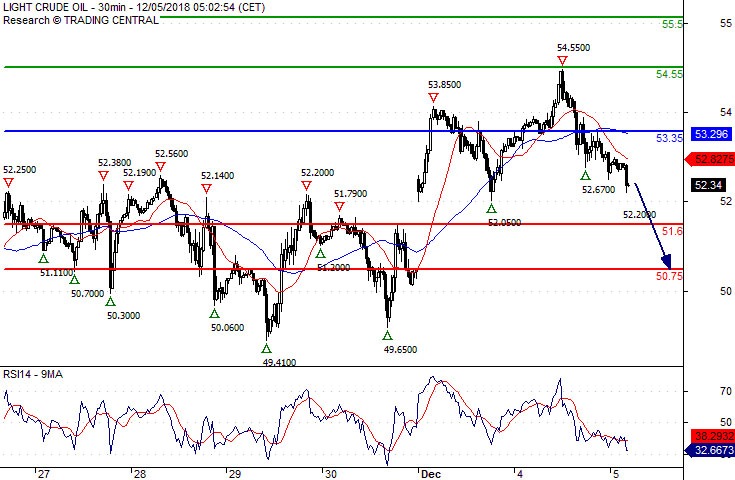
Crude Oil The Downside Prevails
Pivot (invalidation): 53.35
Our preference Short positions below 53.35 with targets at 51.60 & 50.75 in extension.
Alternative scenario Above 53.35 look for further upside with 54.55 & 55.50 as targets.
Comment The RSI advocates for further downside