Sample Category Title
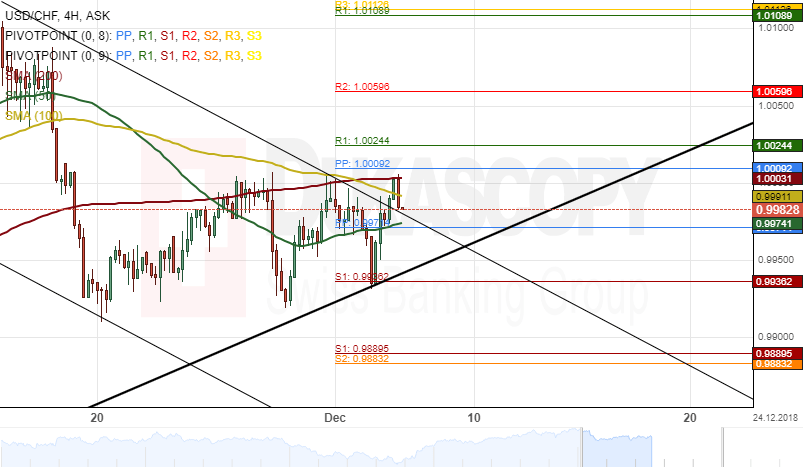
USD/CHF 4H Chart: Stranded Between SMAs
The bearish momentum which has been dominating the USD/CHF currency pair since the middle of November has guided the US Dollar toward the lower boundary of a long-term ascending channel pattern at 0.9889.
The exchange rate was stranded between SMAs during the first part of Wednesday's trading session. The 50-hour simple moving average was providing support for the pair at 09973, while the 200-hour SMA was providing resistance for the rate at 1.0003.
Given that a breakout had occurred through the upper boundary of a one-month descending channel, it is likely that the currency exchange rate will continue to gain strength within this session and potentially target a resistance level formed by the weekly R1 at 1.0024.
Markets Tumble After US Sell-Off
Traders fret about yield curve ahead of market closure
Another major sell-off on Wall Street on Tuesday is dragging on markets across the globe on Wednesday, as traders continue to fret about the meaning behind the inverted US yield curve.
The week got off to such a positive start, with Trump and Xi agreeing to work towards ending the trade war that has seen a total of $360 billion of tariffs imposed ($250bn by the US and $110bn by China) and more threatened. While optimism faded over the ability of the two sides to bridge such a significant divide in 90 days, the cause of Tuesday’s sell-off was more likely driven by two other factors.
The inversion in the US yield curve between two and five years has got people talking about recession risks which understandably weighed on stock markets. The timing of the inversion - coming the day before the US market closure as a national day of mourning takes place following the death of President George H.W Bush – likely exacerbated the move as investors worry about the risk of holding long positions.
This has now spread across Asia and Europe, understandably as a recession in the US would have negative consequences across the globe, although the sell-off has been much less significant. Still, more negativity at a time when markets have shown signs of recovery threatens the prospect of a Santa rally which, on Monday, was looking promising.
GBP under severe pressure as May’s deal looks increasingly unlikely to get over the line
The UK is unlikely to provide much reason for optimism over the next week or so, with the government being locked in debates over Theresa May’s Brexit deal before probably voting it down next Tuesday. This leaves us with numerous possible avenues over the coming weeks which could see this drag on through the festive period and into January, oh joy!
This level of uncertainty at such a crucial time for the Brexit process has put the pound under severe pressure and leaves it at risk of breaking below 1.27 against the US dollar, which could in turn send it into a downward spiral. This level is currently holding up on the increasingly questionable belief that something will happen to get a deal back on track. As ever though, it’s more a question of when rather than if and the longer this plays out, the more risk there is of a plunge. We may have avoided an 11th hour deal initially but once again, this may go right down to the wire.
Oil lower again as Russia and Saudi Arabia meet on side-lines of OPEC+ meeting
Oil prices are once again under pressure ahead of OPEC+ meeting on Thursday, led by overall risk aversion in the markets and the prospect of Russia and Saudi Arabia failing to agree on an adequate cut to support prices. The two countries are due to meet on the side-lines of the meeting today to have further discussions, the details of which could be leaked throughout the day and offer some insight into the outcome of tomorrow’s meeting. As it stands, traders are clearly sceptical that the countries will deliver given Russia’s opposition and Trump’s pressure on the Saudi’s, particularly in the aftermath of the Khashoggi murder.
Gold looking bullish on weaker USD
Gold prices are a little lower on Wednesday, weighed down slightly by the US dollar, as the yellow metal pushes against $1,240 and eyes levels not reached since July. The momentum certainly appears to be with the bulls at the moment, especially if the dollar remains under pressure in the aftermath of the trade war truce. I think a move back towards $1,260 and even $1,280 is perfectly feasible in the coming weeks.
GBP/USD Outlook: Cable Bounces From Dangerous Zone, But Bears Remain In Play, Parliament Debate On Brexit Deal In Focus
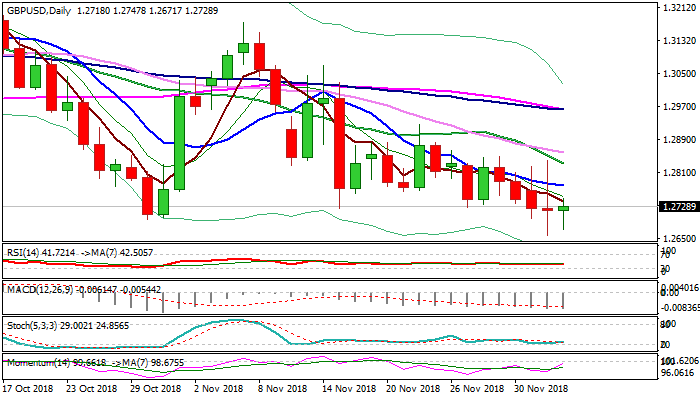
Cable bounced to 1.2750 zone on Wednesday after sharp fall on Tuesday that resulted in spike to 1.2658 low (the lowest since mid-June 2017) after UK PM May suffered defeat at the beginning of five-day parliamentary debate over Brexit plan. Sterling stands at the back foot, despite Tuesday's long-legged Doji which signaled strong indecision, as traders await more news about Brexit, pound's key driver. Dip on Tuesday probed below key supports at 1.2695 (30 Oct low) and 1.2661 (2018 low), although without sustained break, but generated negative signal. Bearish daily techs confirm that the pair remains in a downtrend and pressuring strongly key supports, but looking for firmer signals and focusing 11 Dec parliament's vote about Brexit agreement. Meanwhile, choppy trading could be likely near-term scenario, with falling 10SMA (1.2778) marking initial barrier, while stronger bullish signal could be expected on sustained break above falling 20SMA (1.2832). On the other side, eventual firm break below 1.2695/61 pivots would be strong bearish signal for continuation of multi-month downtrend from 1.4376 (2018 high).
Res: 1.2750, 1.2779, 1.2832, 1.2850
Sup: 1.2695, 1.2671, 1.2658, 1.2600
Oil Rebounds Ahead Of OPEC Meeting Amid Hopes For Production Cuts
The Organization of Petroleum Exporting Countries (OPEC) and its allies will meet in Vienna on Thursday, and expectations for a production cut to stabilize oil prices are riding high. With investors appearing confident such a reduction will indeed take place, the impact on oil prices may depend mainly on the size of any cut. If producers fail to deliver entirely though, crude prices could well visit fresh lows for the year.
OPEC and its allies, most notably Russia, are reportedly mulling a fresh round of oil production cuts aimed at stabilizing prices, following the recent collapse. Indeed, the recent declaration that Saudi Arabia and Russia intend to continue cooperating on oil matters beyond 2018 signaled there’s political willingness for further supply cuts, and all that remains is working out the details. This optimism helped crude prices to recover somewhat in recent days, and alongside them, the currencies of oil-producing nations such as Canada and Norway.
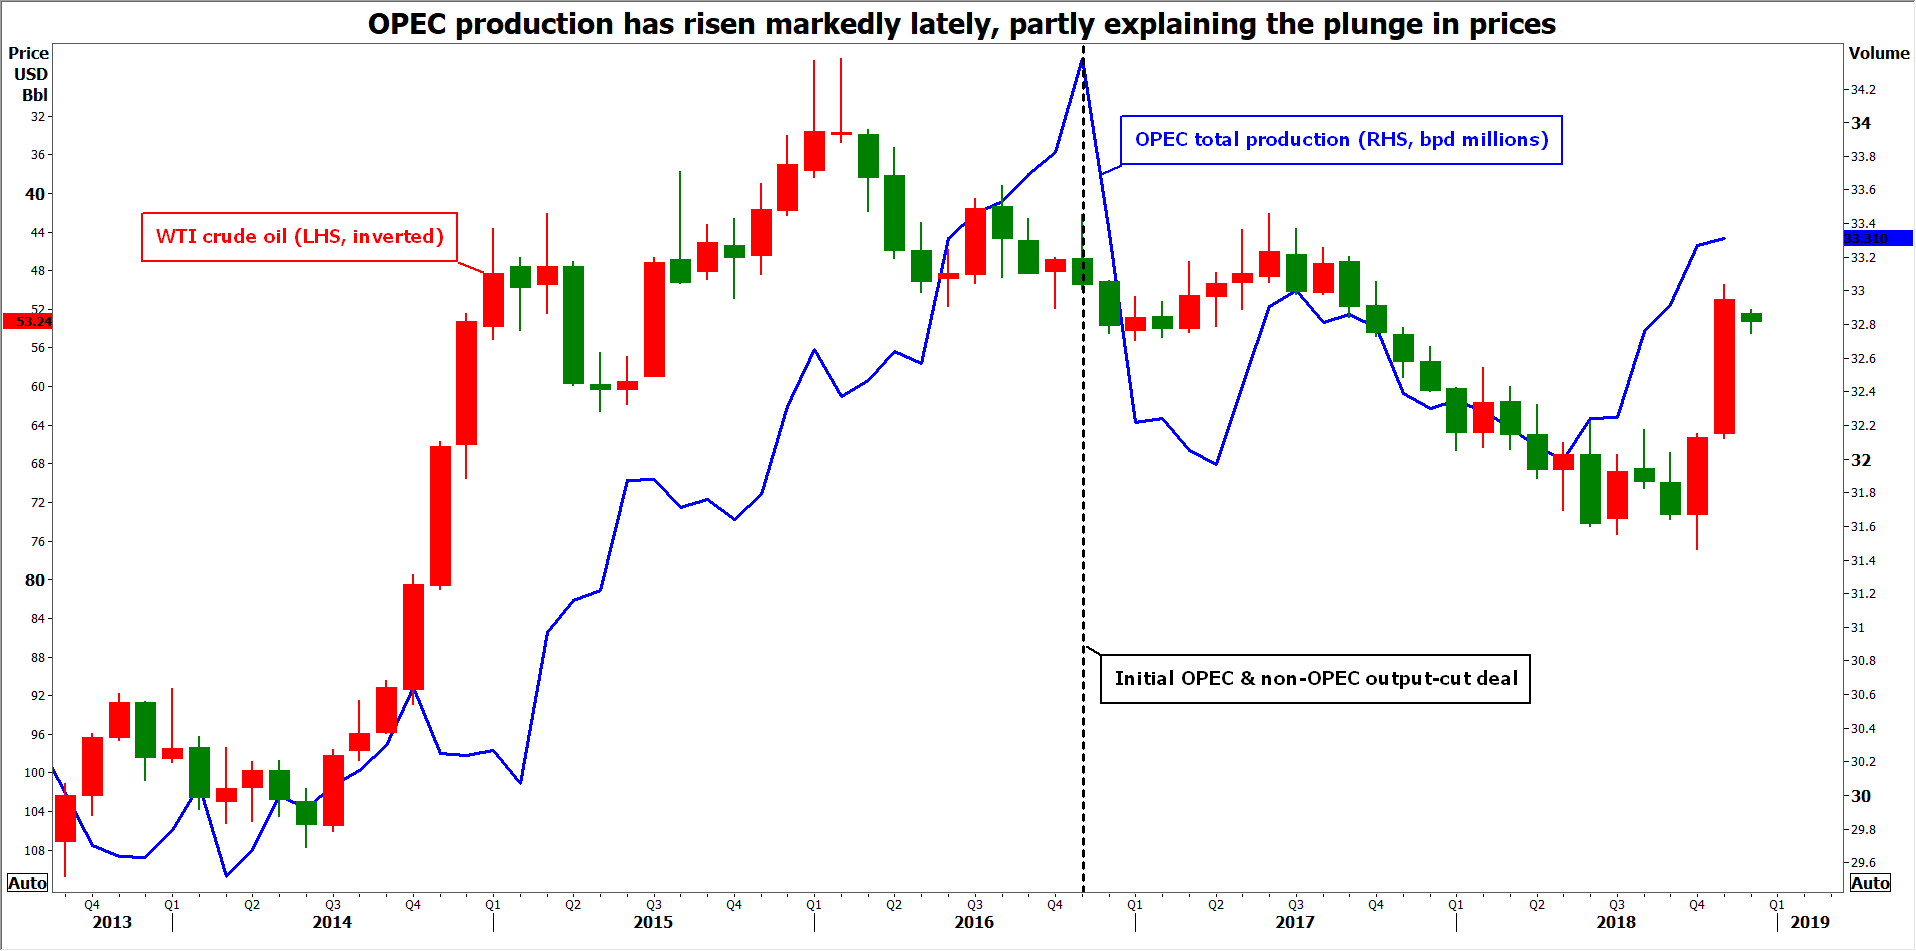
Investors appear relatively confident a production cut will be delivered, but there’s a wide range of estimates around how much the producers may cut. Market chatter currently suggests a reduction of around 1 – 1.5 million barrels per day (bpd). If the producers ultimately cut by a number near the upper bound of this range, then oil prices could recover further, whereas anything near the lower end – or even below it – would likely hurt oil, considering that expectations for a sizeable cut are probably baked into prices already.
Admittedly, predicting the exact magnitude of a cut is notoriously difficult, as the number required to balance the market may be different than the “politically acceptable” number that can be agreed among producers. Having said that, it’s interesting to note that a very substantial cut that exceeds market expectations and thereby causes prices to surge would most probably infuriate the White House, which has long been calling for lower prices to soothe US consumers and curb inflation. Hence, Saudi leaders may want to avoid an excessively large cut and instead lobby for a more “middle-of-the-road” reduction, of 1.2 million bpd for instance, merely to keep prices stable
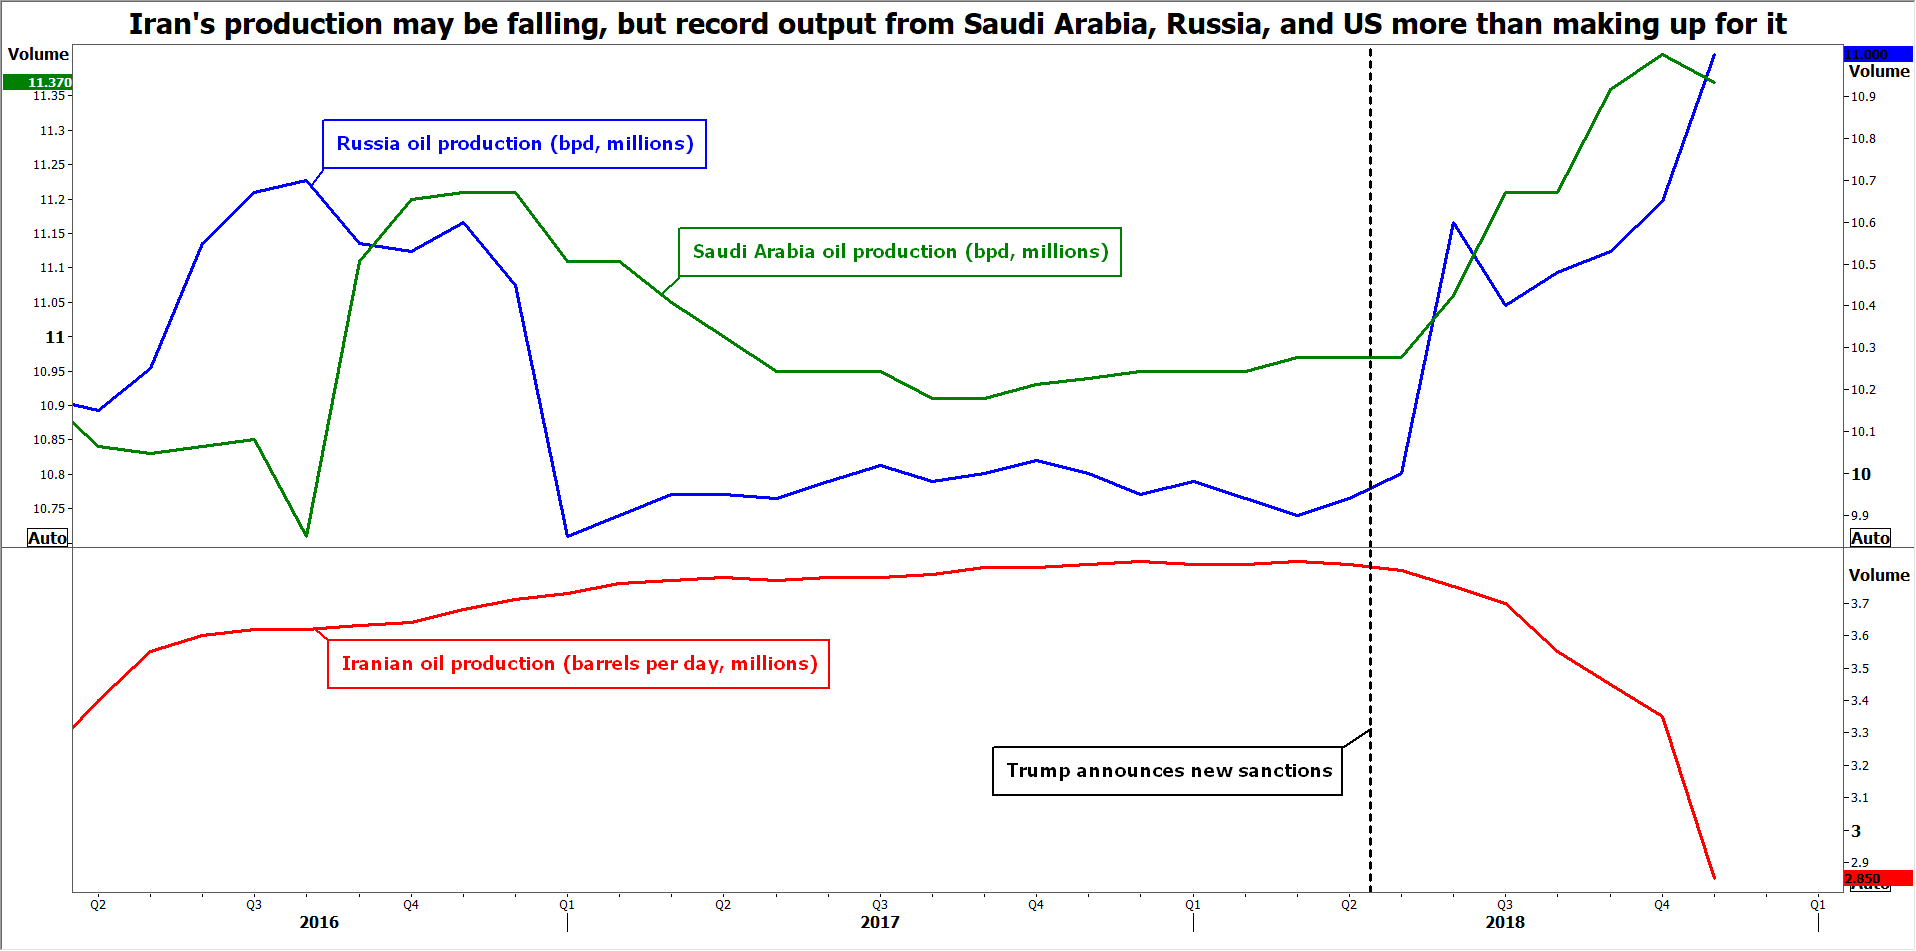
Having outlined the base-case scenario, it’s useful to highlight some low-probability but high-impact outcomes, such as the cartel being unable to agree any deal. This would be a catastrophic result for prices, and may well send both WTI and Brent to fresh lows for the year. This could happen for example if nations like Iraq, Libya, and Nigeria, whose production only now started to recover following previous shocks, are keen to raise it further. On the other side, economies whose output is dropping, such as Venezuela and Iran, may be reluctant to commit to lower output targets. Besides crude prices, oil-sensitive currencies including the loonie, Norwegian krone, and Russian ruble would probably sink in such a case.
Another possibility is the producers agreeing on the need to limit output, but failing to settle on a specific target; much like how the June meeting concluded, but in reverse. Back then, they couldn’t agree on how much to raise production. Such an ambiguous outcome may come as a disappointment for investors and thereby weigh on crude prices and oil-related currencies, although the losses would most likely be smaller than those under a no-deal scenario.
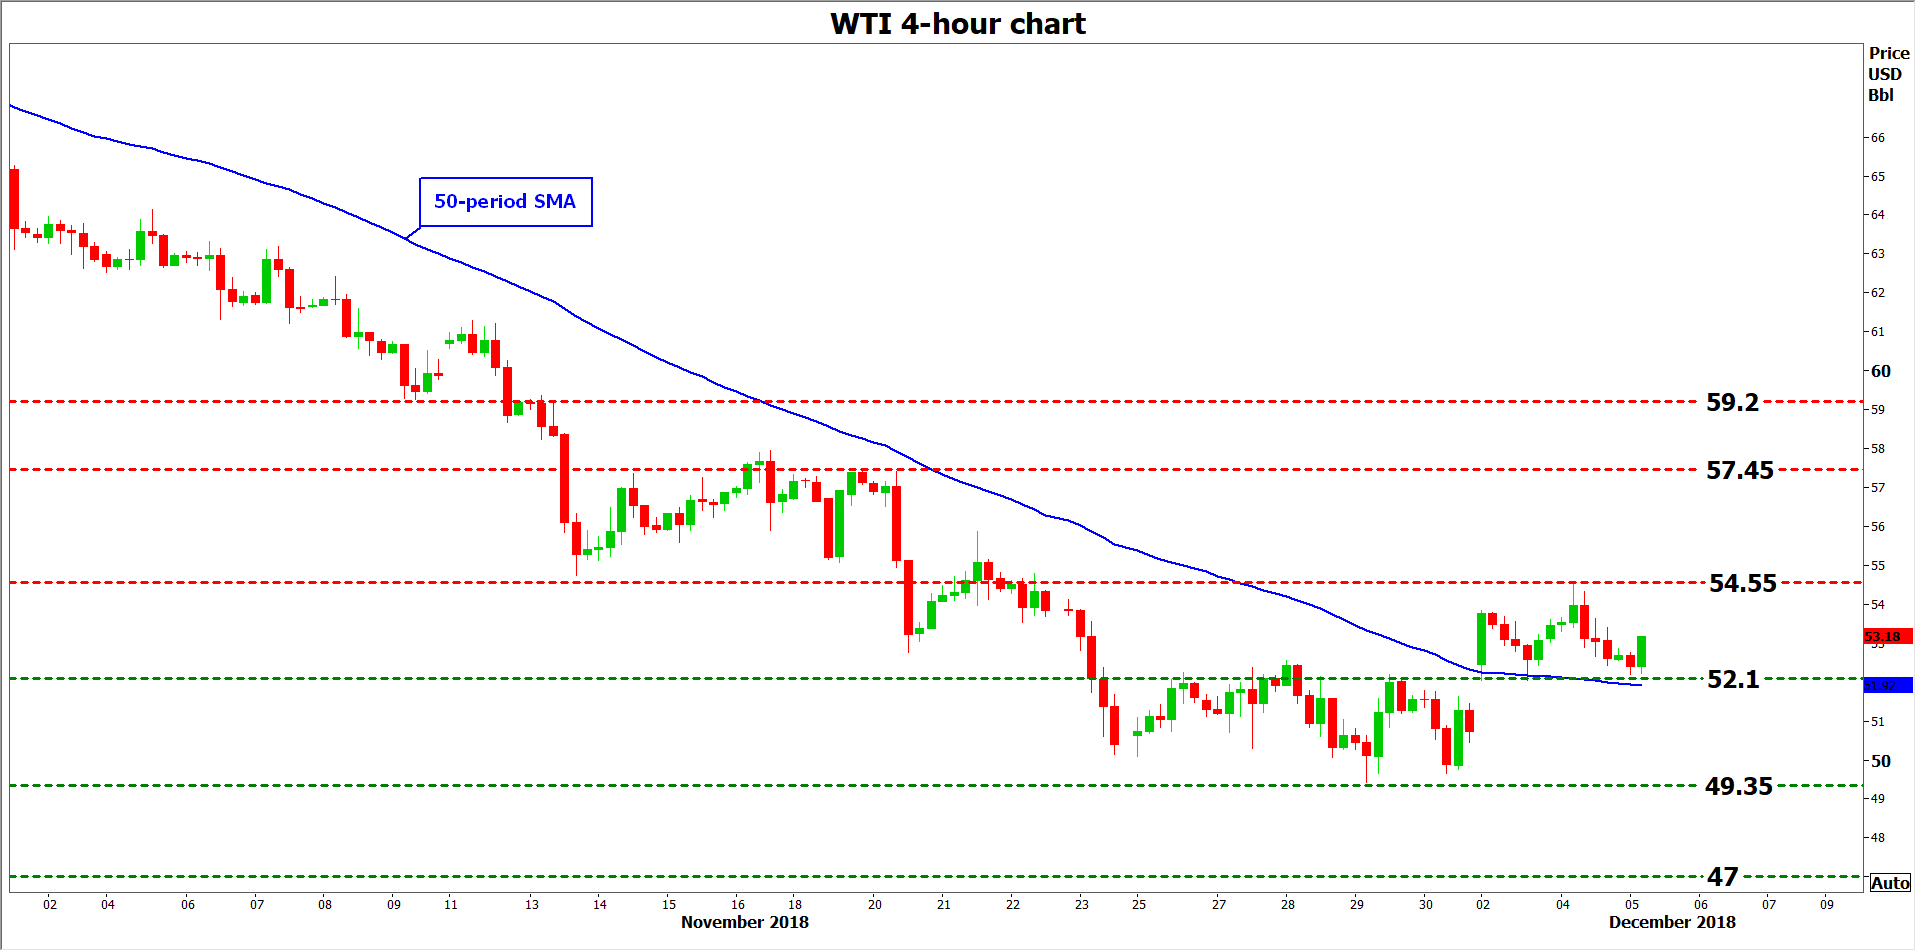
Taking a technical look at WTI, another wave of declines may meet initial support near the $52.10 area, which halted the tumble on December 3. Even lower, the November 29 low of $49.35 would come into view, with even steeper declines aiming for 47.00 – the trough of September 11, 2017.
On the upside, resistance to advances may be found around $54.55, the peak of December 4, before the $57.45 zone attracts attention, this being the high of November 19. Higher still, sell orders may be found near the $59.20 territory, defined by the November 9 lows.
Dollar Index Consolidates Gains Within Ascending Channel
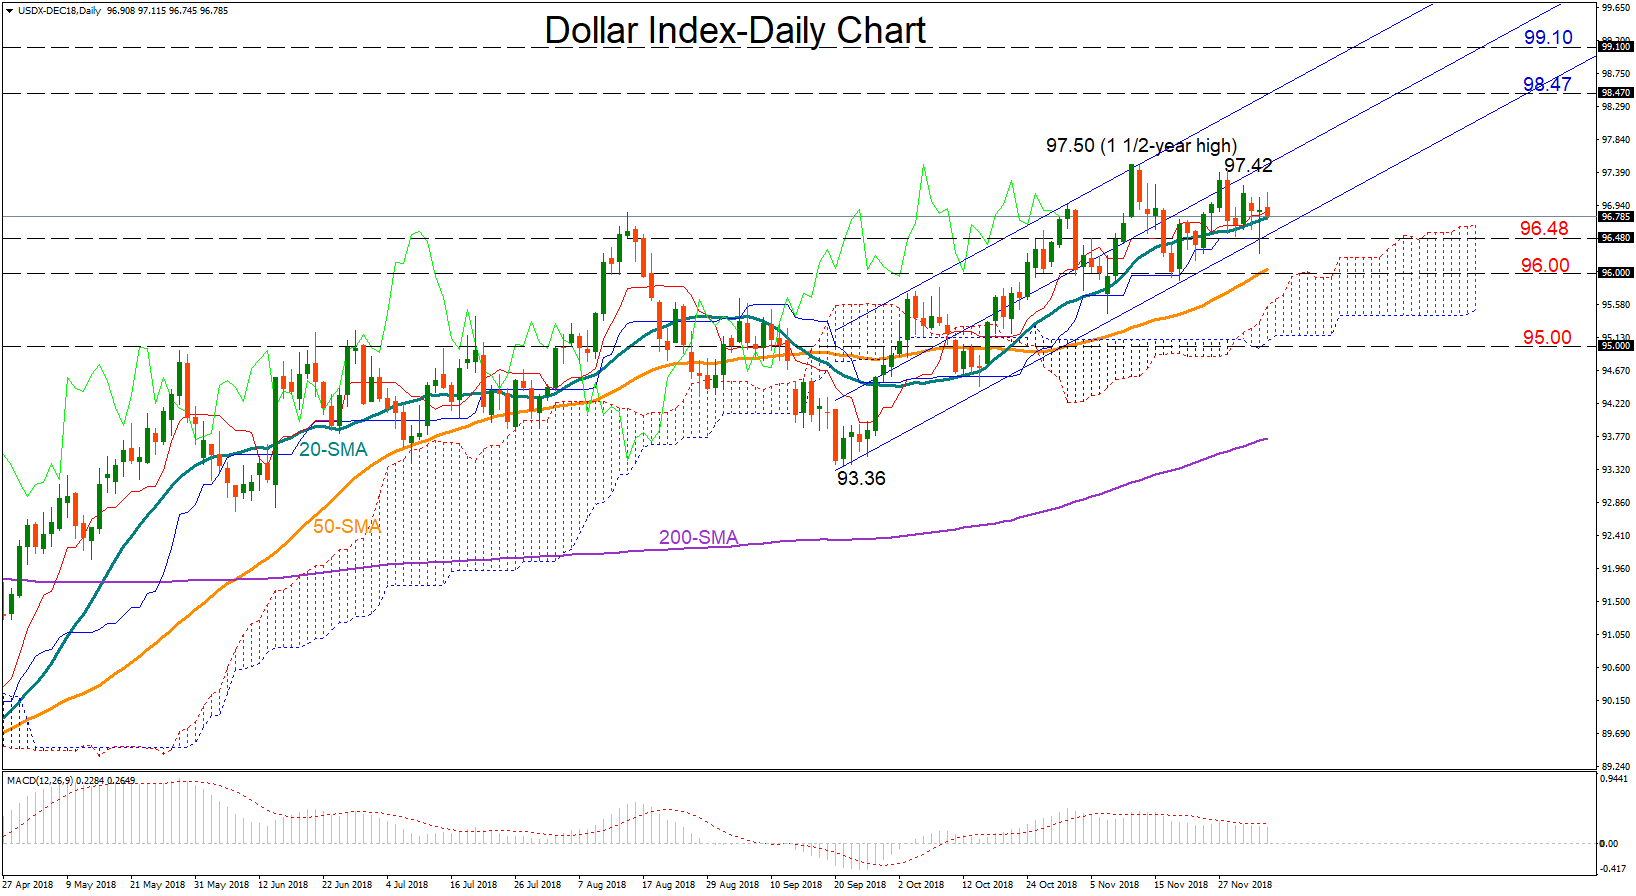
The dollar index has been moving sideways after unlocking 1 ½-year highs at 97.50 within the ascending channel. In the short term, consolidation will likely continue as the red Tenka-sen line looks to be steadying again above the blue Kijun-sen line which is also flat, while the MACD has slipped below its red signal line, though marginally.
On the upside, the index could retest the previous highs of 97.42 and 97.50 which are not far away from the middle bound of the bullish channel. A decisive close above the region could bring further buying interest into the market, pushing the price towards the upper line of the channel seen around 98.40. If that proves a weak obstacle too, resistance could run up to 99.10, with the outlook turning even more positive.
In case the index heads down, the lower bound of the channel seen at 96.48 could offer nearby support. An extension below that line and therefore out of the channel, would probably trigger further declines towards the 96.00 round level which halted downside movements in previous weeks. This is also where the 50-day simple moving average(SMA) is currently standing, adding some improvement to the level. A stronger wall, however, could be found around the 95.00 barrier, where any violation would confirm that the bullish phase has come to an end.
In the medium-term timeframe, the price is trending upwards, painting a positive picture. Given that the 50-day SMA continues to gain ground far above the 200-day SMA, the bullish sentiment might improve even further.
Summarizing, the dollar index is neutral in short term and bullish in medium term.
Markets Saw Looming Recession In US Bond Dynamics
U.S. markets on Tuesday were heavily sold, losing more than 3% on key indices. The main trigger of the decline was the dynamics of debt markets in the USA. The yield of government bonds with longer periods of circulation was lower than the yield of some more shorter-term securities. This often happens during economic downturns, but, formally, this inversion is not a sign of recession as formally central bank may raise short-term rates above the long-term levels to prevent overheating of the economy than have significant influence on debt market.
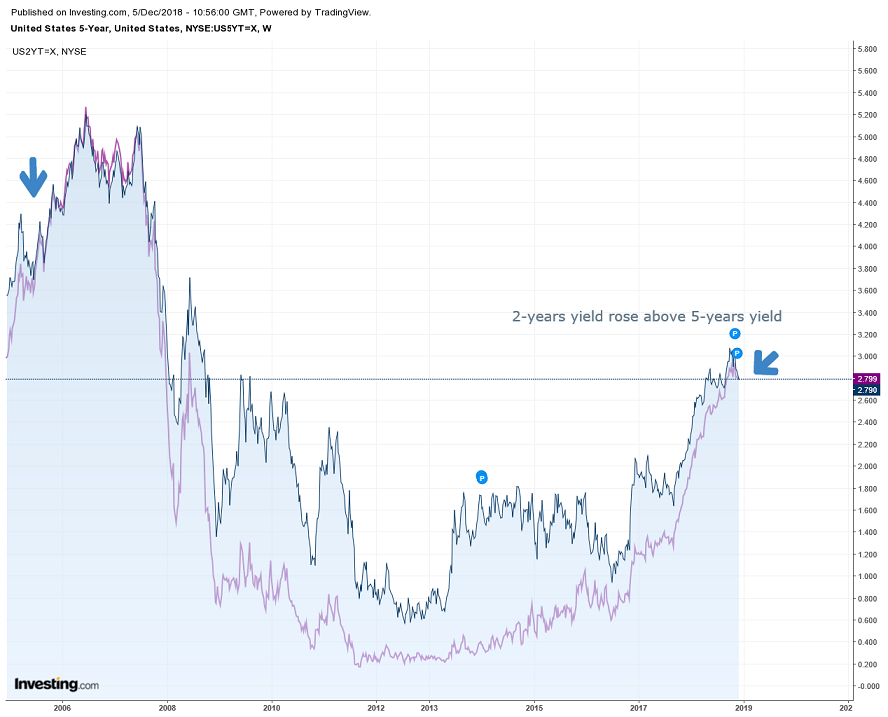
This is perfectly suited to our case, as the U.S. simultaneously benefited from tax reform, accelerated global growth and low global interest rates at the beginning of the year.
In this case it is appropriate to say that the causes and symptoms of the recession are confused, and the main reason of recession should lay in the weak economic indicators. As long as there are no signs of a dangerous slowdown, the Fed still has time to adapt its policy.
At the beginning of the year the sale of long-term government bonds (which causes their yield growth) was called one of the reasons of weak market performance.
Yesterday there were several short-term unfavorable factors, which increased the decline:
- weakening hopes for a breakthrough in trade negotiations with China;
- increased demand for safe-haven assets as markets were set to close on Wednesday;
- rollback after unsuccessful attempt to overcome the resistance level, which was not given in October and November.
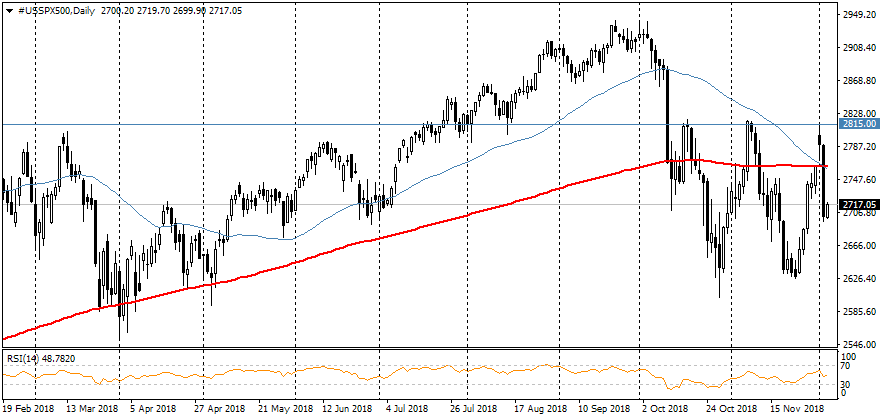
It is still too early to consider the inversion of the yield curve as a warning call to the recession. This week ahead is the publication of the American Beige Book with an overview of economic assessments in the regions, as well as the output of labor market data.
The signs of the coming recession should be found in economic reports, not in terms of yield curves. In addition, markets are now very sensitive to comments from the Fed.
GBPUSD Testing Daily Pivot Point
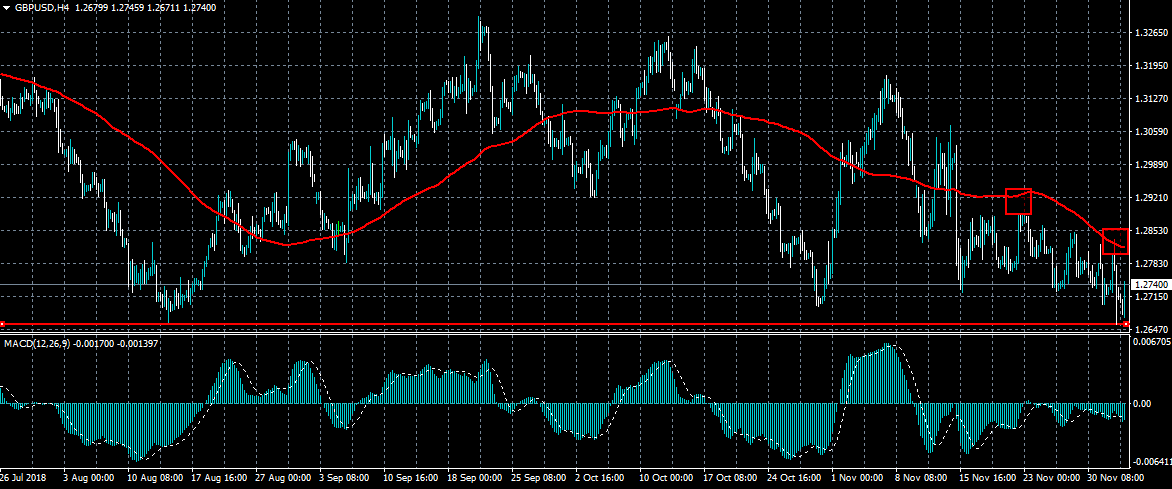
The British pound is staging a minor recovery higher against the US dollar, despite much weaker than expected PMI Services data from the United Kingdom economy. Price is now testing the GBPUSD pair’s daily pivot point, at 1.2740, after sellers earlier failed to trigger the bearish head and shoulders pattern. The overall sentiment towards sterling remains bearish, with traders likely to sell into the recent upside rally.
The GBPUSD pair remains bearish while trading below the 1.2740 level, key technical support is found at the 1.2695 and 1.2657 levels.
If the GBPUSD pair trades above the 1.2740 level, key resistance is found at the 1.2770 and 1.2840 levels.
EURUSD Intraday Bearish Below1.1360 Level
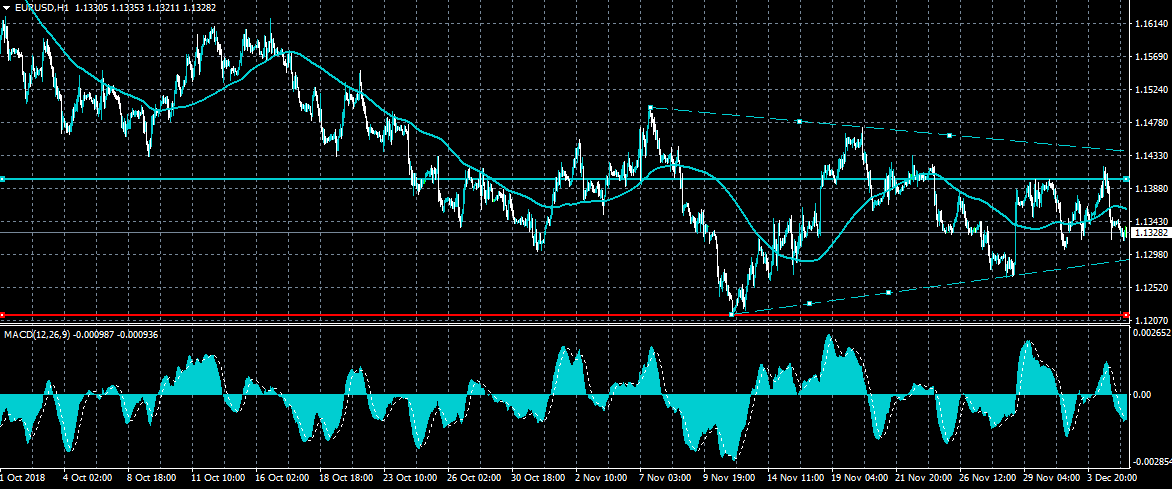
The euro is back under pressure against the US dollar, with the price now trading towards the lower end of the EURUSD weekly trading range. The intraday sentiment surrounding the EURUSD is bearish while trading below the 1.1360 level, which represents the pairs daily pivot point. Traders are now looking for a confirmed technical breakout from the well-defined triangle pattern on the one-hour time frame.
The EURUSD pair is only intraday bullish while trading above the 1.1360 level, key technical resistance remains at the 1.1400 and 1.1435 levels.
If the EURUSD pair trades below the 1.1296 level, sellers are likely to test the 1.1270 and 1.1216 levels.
EUR/USD Analysis: Trades Between PPs
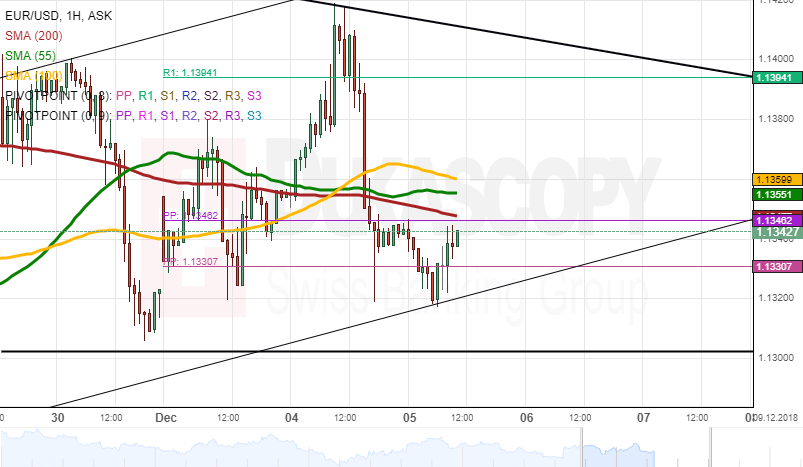
During Tuesday's trading session, the rate passed through the SMAs to end the trading session at 1.1335. On Wednesday morning, the European Single Currency was trading between the weekly PP and the monthly PP at the 1.1336 mark.
In regards to the near-term future, most likely, the European Single Currency will be trading downwards due to the resistances of the SMAs and the monthly pivot point at the 1.1346. Moreover, It is expected that the rate will trade near the bottom boundary of the medium pattern at the 1.1300 level.
On the other hand, the high volatility could push the rate to break the resistance levels of the technical indicators to trade at the 1.1360 level during the day.
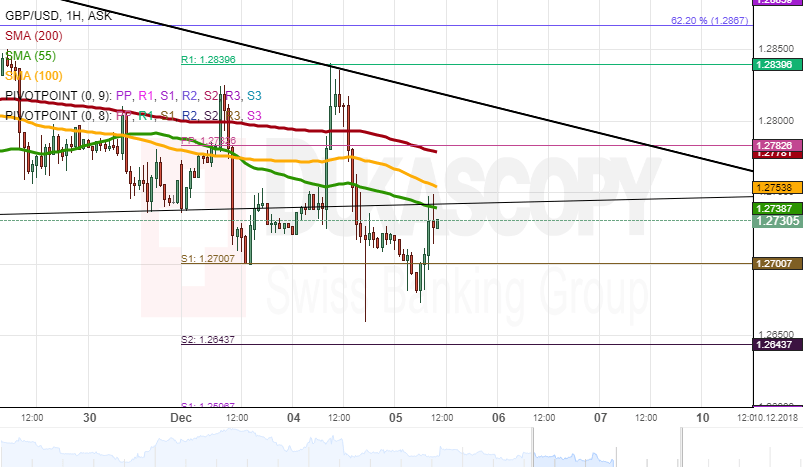
GBP/USD Analysis: Expects High Volatility
During Tuesday's trading session, the currency exchange rate depreciated by 1.41% or 181 pips due to a high volatility created by the Brexit uncertainty. During Wednesday's morning hours, the British Pound was resisted by the 55-hour simple moving average to trade at the 1.2740 mark.
In regards to the near-term future, most likely, the currency exchange rate will trade downside due to the resistance of the technical indicators which might resist the currency rate to trade near the weekly S1 at the 1.2707 mark.
On the other hand, the British Pound could appreciate against the US Dollar during today's UK Services PMI data release at 9:30 AM to trade at the 1.2800 level.