Sample Category Title
Daily Markets Broadcast
Wall Street extends decline
Wall Street extended its decline to a fourth day on continued weakness for Apple, while Brexit headlines also introduced uncertainty. Oil managed its first positive day in thirteen days. Australia added the most full-time jobs since February last month.
US30USD Daily Chart
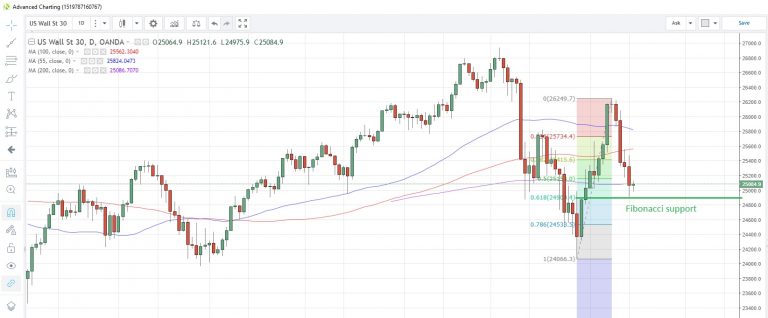
The US30 index fell for a fourth straight day yesterday with continued weakness in the tech sector
The index has yet failed to penetrate the 61.8% Fibonacci retracement support level of the Oct29 to Nov8 rally at 24,900
US October CPI data was bang in line with expectations. Today we see retail sales, which are expected to rebound to +0.5% m/m following a 0.1% decline in September.
DE30EUR Daily Chart
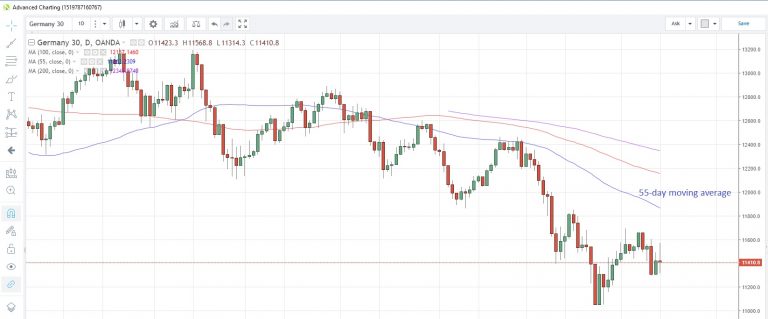
The Germany30 index was steady yesterday, unfazed by Brexit deal news as there still remain a lot of uncertainties
The 55-day moving average at 11,863 would act as the first upward resistance point
EU says it has received Italy’s official budget plan for 2019. Will respond on November 21.
AU200AUD Weekly Chart
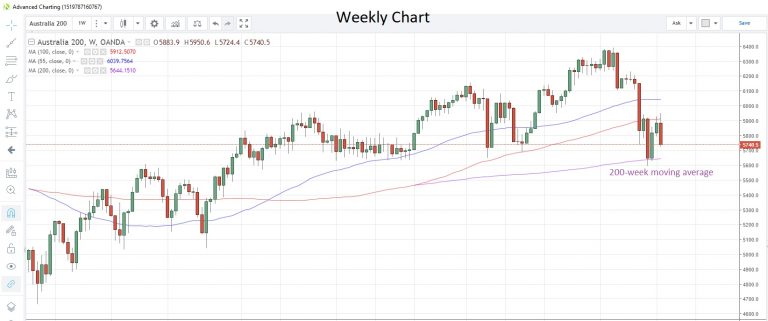
The Australia200 index is hovering near lows of the month, showing little response to a very strong jobs report for October
The 200-week moving average at 5,644 supported prices at the last test, and may do so again this time
Australia added net 32,800 jobs in October, with an increase of 42,300 full-time jobs and a loss of 9,500 part-time ones. That’s the biggest full-time jobs addition since February.
Crude Oil Price Tumbles Below $60.00
Key Highlights
- Crude oil price extended losses and traded below the key $60.00 support against the US dollar.
- There was a break below a crucial declining channel with support at $58.00 on the 4-hours chart of XTI/USD.
- The US CPI in Oct 2018 increased 0.3% (MoM), similar to the forecast.
- Today, the US Retail Sales for Oct 2018 will be released, which is forecasted to increase 0.5% (MoM).
Crude Oil Price Technical Analysis
During the past few days, there were continuous losses in crude oil price below the $65.00 support against the US Dollar. The price recently settled below the key $60.00 support and traded to a new bi-monthly low.
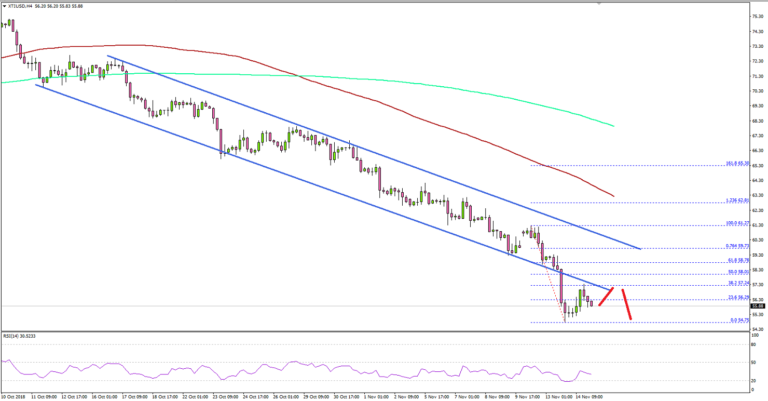
Looking at the 4-hours chart of XTI/USD, the price followed a major downtrend from the $74.00 swing high and broke many important supports such as $70.00, $65.00, $62.00, $60.00 and $58.00.
More importantly, there was a break below a crucial declining channel with support at $58.00. Besides, the price even traded below the $56.00 level and it is currently positioned well below the 100 (red) simple moving average (4-hours).
It traded close to the $54.00 level and it is currently consolidating losses. An initial resistance is near the $58.00 level the 50% Fib retracement level of the recent decline from the $61.27 high to $54.75 low.
Above $58.00, the main hurdle for buyers could be $60.00 and the 76.4% Fib retracement level of the recent decline from the $61.27 high to $54.75 low. To start a decent rebound, the price must trade above $60.00 in the near term.
On the downside, if there are further losses below $54.00, the price may perhaps trade towards the next major support at $50.00 in the near term.
Fundamentally, the US Consumer Price Index for Oct 2018 was released by the US Bureau of Labor Statistics. The market was looking for an increase of 0.3% in the CPI in Oct 2018 compared with the previous month.
The actual result was in line with the forecast and even the yearly change was +2.5%, similar to the forecast. However, the Core CPI in the US increased 2.1% (YoY), less than the forecast of +2.2%.
In the short term, there could be an upward move in crude oil price, but it won’t be easy for buyers to surpass the $58.00 and $60.00 resistances.
Economic Releases to Watch Today
- UK Retail Sales for Oct 2018 (MoM) – Forecast +0.2%, versus -0.8% previous.
- UK Retail Sales ex-fuel for Oct 2018 (MoM) – Forecast +0.5% versus -0.1% previous.
- US Initial Jobless Claims – Forecast 212K, versus 214K previous.
- US Import Price Index Oct 2018 (MoM) – Forecast +0.1%, versus +0.5% previous.
- US Export Price Index Oct 2018 (MoM) – Forecast +0.1%, versus 0% previous.
- US Retail Sales Oct 2018 (MoM) – Forecast +0.5%, versus +0.1% previous.
Looking For The Elusive Silver Lining
Markets
U.S. stocks fell for a fifth straight day as investors remain bewildered by the political ping-pong match around Brexit.More questions about NAFTA 2. While trade jitter has everyone on edge as the doomy global economic growth narrative continues to take root. Other than the carnage in Crude temporarily decreasing, there’s not much of a silver lining to be had as we enter today’s Asia session with the S &P 500 falling to 2-week lows.
Oil Markets
And when you thought a dose of OPEC verbal intervention could “right the oil tanker”, today’s API inventory build will provide yet another blow to Oil prices as the extraordinary momentum of US supply growth continues to amaze. I don’t think the build is too much of a surprise as no one was factoring in much support from US inventories, but this data continues to reinforce the significance of “The Made in America Factor.” weighing on Oil prices.
US shale producers are equally responsible for global oversupply. The latest data show producers running at an accelerating pace, placing the US as the largest oil producer in the world. As well, President Trumps stinging OPEC tweets have legs. The US administration caught OPEC wrong-footed by what was supposed to be the harshest sanction ever applied to Iran only for the US to take relatively mild action exacerbating the supply glut. And then US tariffs are compounding China’s economic woes and are fanning exaggerated concerns about demand growth in 2019 and 2020. Indeed, the Washington “quadfecta” is having a massive impact on prices,
But we need to play the cards dealt and as such the desynchronization of global GDP’s between EM markets (including China) and the US suggest that US dollar strength which has triggered Asia EM FX depreciation could continue acts as a demand drag on Asia largest Oil importers.
Early in the NY session, OPEC verbal intervention saw prices bounce off weekly lows as speculation built that OPEC + would cut output at next months triggering crisp profit taking from arguably oversold conditions. But a 2 % pullback after a 7 % drop suggests there is still a lot of apprehensions out here, supply glut concerns notwithstanding.
While it’s little more than a mug’s game to pick bottoms, but we are undoubtedly much closer to pricing in the current supply glut and reduced forward demand factors than we were on Monday. But the toxic elixir of weakening global demand and oversupply suggests upticks will run into substantial selling as numerous bearish factors are weighing on sentiment.
In short, sound OPEC output, the surge in US production, a strong US$ weighing EM product demand, and Iran sanctions waivers, have for now put a damper on crude oil prices triggering a massive flight from long-only funds while placing markets in a disadvantageous yield contango effect.
If your looking for a bullish tail risk in the absence of a significant production cut, including compliance from Russia, pray for an extended winter cold snap across the global or unexpected supply disruption.
Gold markets
The DXY failed another test of 97.75, and the CPI data did little to influence USD demand. Risk aversion continues to rear its ugly head dampening US equity sentiment. But the combination of weary USD and the markets risk off tendencies triggered a wave bargain hunting then profit taking on tow which provided a significant fillip for gold prices as the market sliced through stop losses like a hot knife through butter.
G-10 Currency Markets
Euro
After putting in a bottom near 1.1200, the USD has seen some rather acute selling the past 24 hours or so. Everyone is pointing to the Pound as the catalyst, but frankly, I’m not sure this is a compelling enough argument and Euro still looks incredibly shaky.
But there are more than a few flies gathering in the bullish US ointments, so we could see some more sizeable long dollar bets reduce across the G-10 spectrum.
Yuan and Aussie
A slight de-escalation in US-Sino tensions have seen long USDCNH bets pare and the Aussie regain composure. And we could see both the CNH and AUD sentiment improve as we near G20.
Mind Set
If traders start thinking, markets are entering a protracted consolidation phase; they will begin to throw in the towel on the long USD trade while preserving year-end profits
December rate hike effect
Fully priced into the calculus is the December FOMC, suggesting the hawkish Fed narrative may have run its course, so the USD could be driven by external factors over the near which turns things into a bit of crapshoot
Japanese Yen
ON the Japanese Yen, I think the weaker USD across the board opens the real potential for Yen to appreciate. Equity underperformance, an anticipated BoJ taper in 2019 and word on the street suggesting increased Japanese exporter hedging demand into year-end. It does support a stronger JPY into year end.
EM Asia FX
IDR and INR are catching a tailwind on cratering oil prices while the RMB complex remains relatively stable, but there seems no escaping this global risk aversion theme which will continue to temper expectation on both local equity and currency markets. It all suggests that we will continue to trade on different topics with the North Asia block struggling on a weaker equity outlook.
Malaysian Ringgit
The weaker bias remains in check as cratering oil prices now weigh negatively on the government coffers. Tomorrow’s expected rebound in GDP due the 0 GST consumption effect is priced into the currency equation. Importers are reportedly on the bid in the low 4.19 level while locals have good USD supply on offer ahead of 4.20. For today I expect the USDMYR to trade lockstep with regional peers.
Bitcoin
Bye, Bye Bitty? Bitcoin just crashed below significant support levels which have held up since April as the Bitcoin Cash hard fork is proving far more destabilising than initially thought as numerous competing factions muddy the landscape. All of this noise is triggering a “when in doubt get out” cause and effect. My long-held belief is that the eventual break of $5000 opens the door to a test of $2500 as Bitcoin retail traders move from buying on dip to full out panic mode.
Eco Data 11/15/18
[php_everywhere instance="1"]
AUDJPY Positive Momentum Weakens; Medium Term Outlook Looks Mostly Bullish
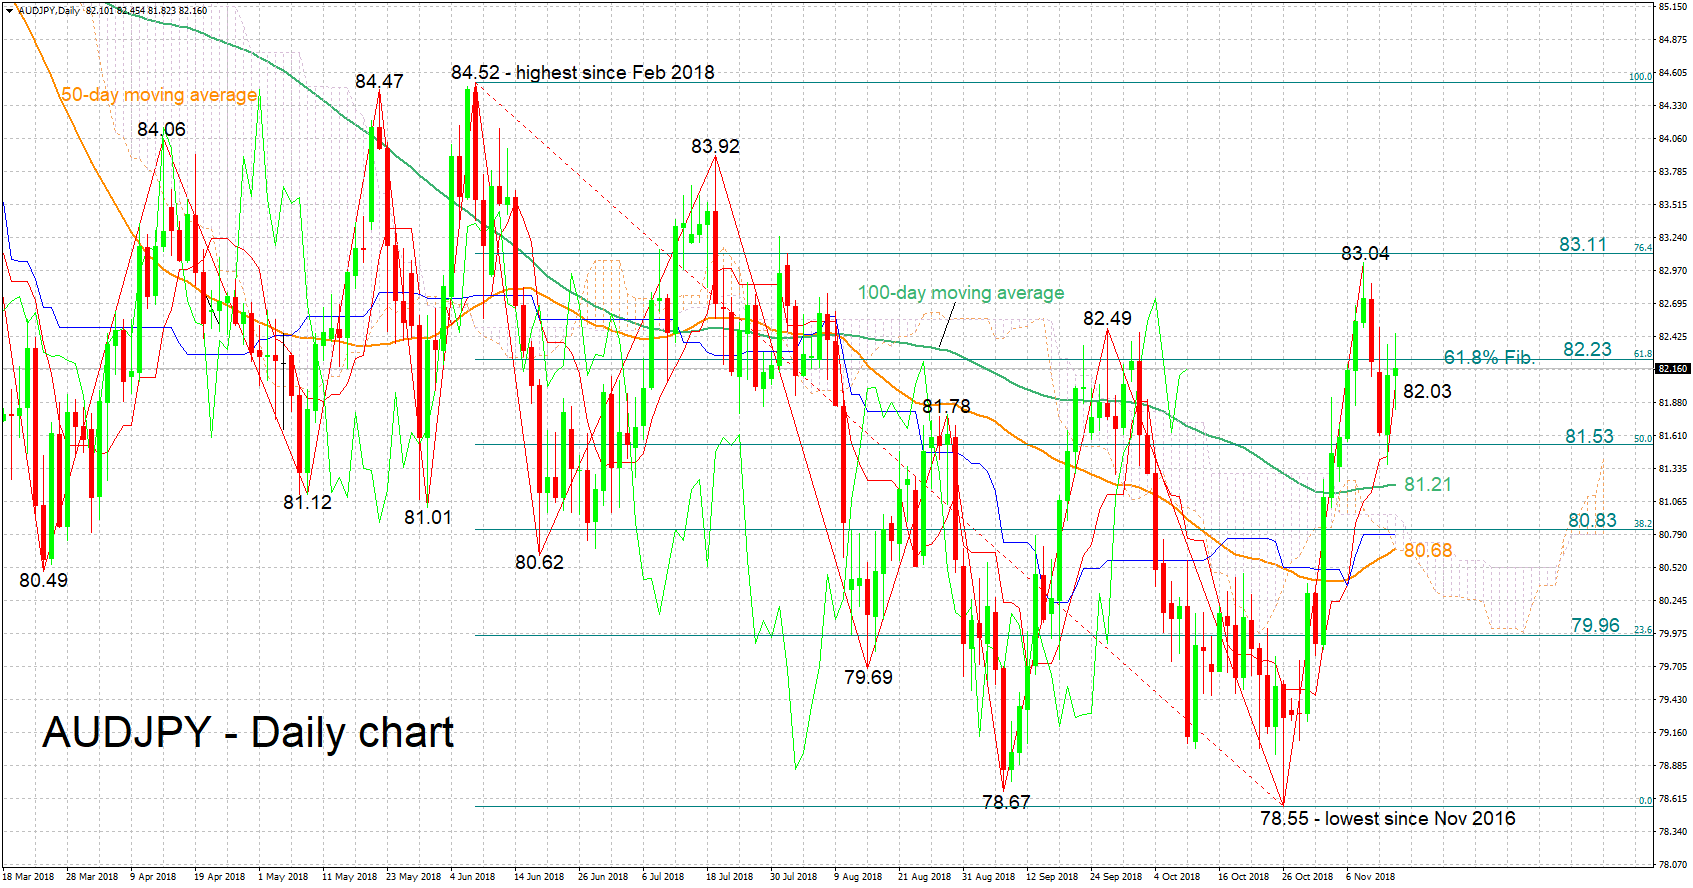
AUDJPY’s remarkable recovery after hitting a two-year nadir of 78.55 in late October lost some steam when the pair touched a near three-and-a-half-month high of 83.04 last week.
The Tenkan- and Kijun-sen lines remain positively aligned in support of a bullish bias in the short-term, though the fact that the Kijun-sen has flatlined is an indication of weakening positive momentum.
Immediate resistance to gains may come around 82.23, the 61.8% Fibonacci retracement level of the downleg from 84.52 to 78.55; the zone around this also captures the late September top of 82.49. Higher still, a barrier could be met around the 76.4% Fibonacci mark at 83.11, with the area around it also encapsulating last week’s peak of 83.04. More bullish movement would turn the attention to the 83.92 high.
A move down could meet a first line of support around 82.03, this being the current level of the Tenkan-sen; a previous top at 81.78 lies close to this point. A downside violation would eye the 50% Fibonacci level at 81.53 and then the 100-day moving average at 81.21. Steeper losses would bring the region around the 38.2% Fibonacci at 80.83 within scope; the area around this point also includes the Ichimoku cloud top (80.96) and bottom (80.66), the Kijun-sen (80.79), and the 50-day MA (80.68).
The medium-term picture is looking mostly bullish, with trading activity taking place above the 50- and 100-day moving average lines, as well as above the Ichimoku cloud.
To conclude, both the short- and medium-term outlooks look predominantly bullish at the moment, though there are signs of weakening momentum in the near term.
US CPI: Inflation Under Control
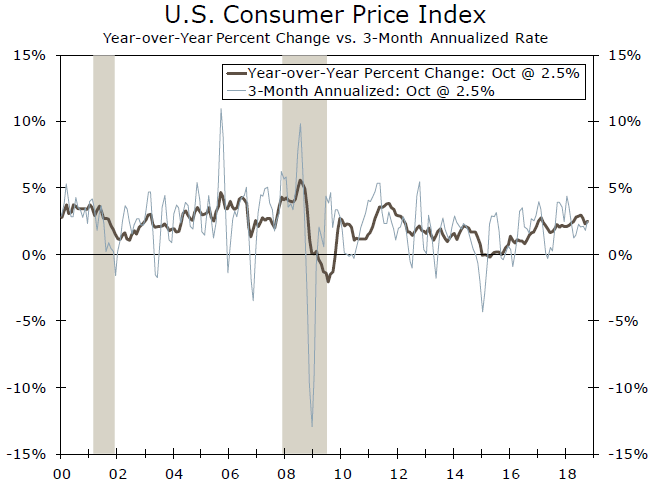
Lifted by higher energy costs, CPI inflation rose 0.3% in October. Core inflation strengthened after a couple of soft prints. October's pickup suggests inflation continues to gradually firm and should keep the Fed on course.
Inflation Climbs in October
Inflation bounced back in October, with the largest monthly gain since January. Consumer prices rose 0.3% last month with fairly widespread gains among subcomponents. One exception to this was food, where prices slipped 0.1%. On a year-ago basis, inflation is up 2.5% compared to 2.0% this time last year, but rising wages have kept real earnings rising.
Whipsawed: Energy and Inflation
Higher energy costs were a driving factor in the pickup in inflation last month. Although gasoline prices according to AAA were falling through most of October, they started the month at the highest levels since June following a run-up in September. Since then, gasoline prices have dropped along with oil and will likely be a drag on inflation in the near term. Unlike oil prices, however, gasoline prices are still up relative to last year and look set to prop up year-over-year inflation through November, or beyond if OPEC supply cuts come to fruition.
Consumers may not get a big break in energy spending based on prices at the pump anyway. The cost of energy services, i.e., electricity and natural gas, saw the biggest monthly gains since early 2014 in October. Further increases could very well be in store if this winter proves colder than usual. Natural gas spot prices have jumped to nearly a five-year high and inventories in storage are at the lowest level for this time of year since 2003.
Core Inflation Bounces Back
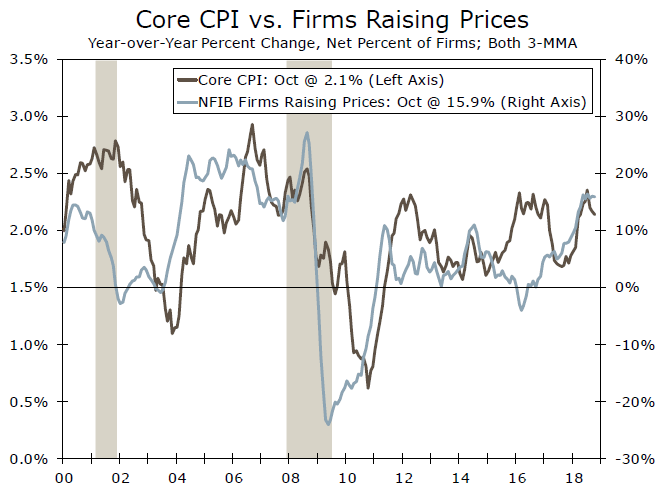
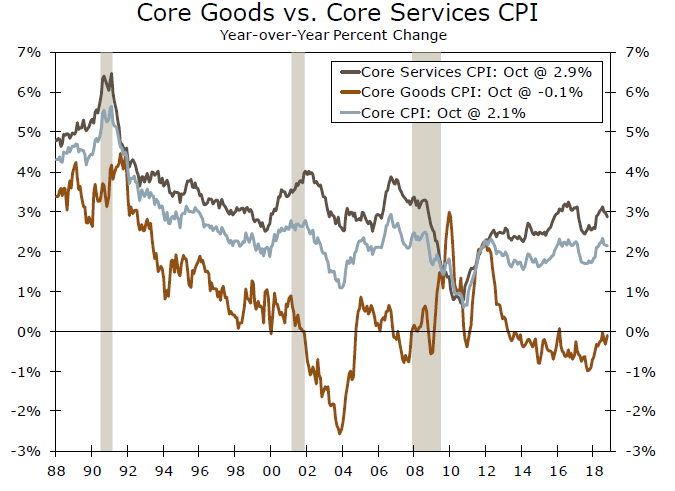
After coming in light in August and September, core inflation rose 0.19% in October. That should help alleviate fears that inflation has hit another soft patch, but the details suggest that core inflation is hardly getting out of hand. Core goods prices posted the largest monthly increase since January, although that merely unwinds what looked to be undue weakness the previous month. Indeed, the curiously large 3.0% drop in used auto prices last month was almost entirely reversed. The dollar's climb this year should keep goods prices from rising rapidly even as tariffs begin to seep into prices in the coming months. Core services prices advanced 0.17%, but the below trend reading was held down by some of the more volatile components, like a decline in lodging away from home and flat prices for airfares.
Keeping the Fed on Course
The plunge in oil prices this past month stands to put downward pressure on inflation, but there is room to give before inflation looks at risk of falling to levels inconsistent with the Fed's target. Today's rebound in core inflation suggests the underlying trend remains modestly higher. While businesses are beginning to see a break on some commodity prices, tariffs and a tight labor market are pushing other costs higher. We expect core inflation to trend up in the year ahead, spurred by more businesses willing to raise prices.
Sunset Market Commentary
Markets
Global core bonds lost ground today. German Bunds opened neutral after the German economy shrank 0.2% in the third quarter, more than the 0.1% decrease expected and down from the 0.5% growth in Q2. This move wasn’t a surprise as the Eurozone GDP number was lower than expected despite solid growth in other EU-countries (Italy excluded). German Bunds reacted little on the news, as the slowdown is expected to be a temporary bump. Risk sentiment improved through the day with European equities moving back into green territory after opening with losses. US equity futures hint this sentiment will persevere at US openings, putting pressure on bond markets. Italian bonds dropped at the open after the government didn’t alter its 2019 budget proposal yesterday despite EU warnings. However sentiment on BTP’s improved later. The US yield curve bear steepened with changes across the curve ranging from +0.8 bps (2-yr) to +2.6 bps (30-yr). German Bonds were little changed with moves from -0.4 bps (5-yr) to +0.3 bps (30-yr). Credit spreads over Germany widen in Greece (+5 bps) and Italy (+6 bps).
The (trade-weighted) dollar started the session with a cautiously positive bias. However, most USD cross rates stayed off the ST peak touched earlier this week. The EU-German interest rate differential are also a few bp off recent cycle peak levels, but the spreads remain a high hurdle for potential USD shorts. There was again plenty of event risk with potential to move the dollar (swings in the oil price, equity volatility, the EU-Italian budget quarrels, Brexit, the EMU growth data and US CPI). Out of this big package, no topic was really able to take the lead in guiding USD trading. Early this morning, the dollar retained the benefit of the doubt but the US currency couldn’t maintain gains. US (headline) CPI (2.5%) was as expected, but the core reading (2.1%) was marginally softer than expected. This was no really big issue, but in the meantime, EUR/USD returned to the 1.13 area. Global equities and oil are looking for a bottom, but in the current environment it isn’t clear whether this is a supportive for the dollar, rather than for the euro. USD/JPY is still going nowhere, holding near 114.
Sterling traders were keenly awaiting some guidance for the UK political today as Brexit enters a key phase. At the time of writing UK PM May is explaining/defending the Brexit text to her Cabinet. Press headlines as usual provided support for the case of both sides. For now, given recent rally, sterling investors were reluctant to put more money on a positive outcome (or at least to further progress). EUR/GBP returned north of 0.87. Regarding the data, UK headline CPI was a touch softer than expected at 2.4% Y/Y. However, the broader UK price data brought little news to warrant a repositioning on UK interest rate and/or FX markets. EUR/GBP trades currently in the 0.8725 area. Cable hovers in the mid 1.29 area.
News Headlines
Central European countries reported Q3 GDP growth, but details aren’t available yet. The Czech Republic was a negative outlier, with only 0.4% Q/Q growth, the slowest pace since Q3 2016. Bulgarian GDP printed at 0.5% Q/Q. Polish growth accelerated by an astonishing 1.7% Q/Q while Hungary posted a better-than-expected 1.2% Q/Q. Slovak GDP growth accelerated to 4.6% Y/Y.
Swedish inflation unexpectedly slowed in October, from 2.5% Y/Y to 2.4% Y/Y. The setback raises uncertainty on whether the Riksbank will start its normalization cycle in December or in March. EUR/SEK tried to regain previously lost support around 1.2850. The news on the political front wasn’t better, with Moderate Party Leader Kristersson losing a confidence motion in parliament to lead the next government.
The German Bundesbank warned in its Financial Stability Review that the country’s financial sector is ill prepared to face a next recession. The long growth cycle may have inflated asset prices and blurred the sector’s view on future credit risks.
EURJPY Maintains Weak Bias in Near-Term; Broader Trend is Neutral
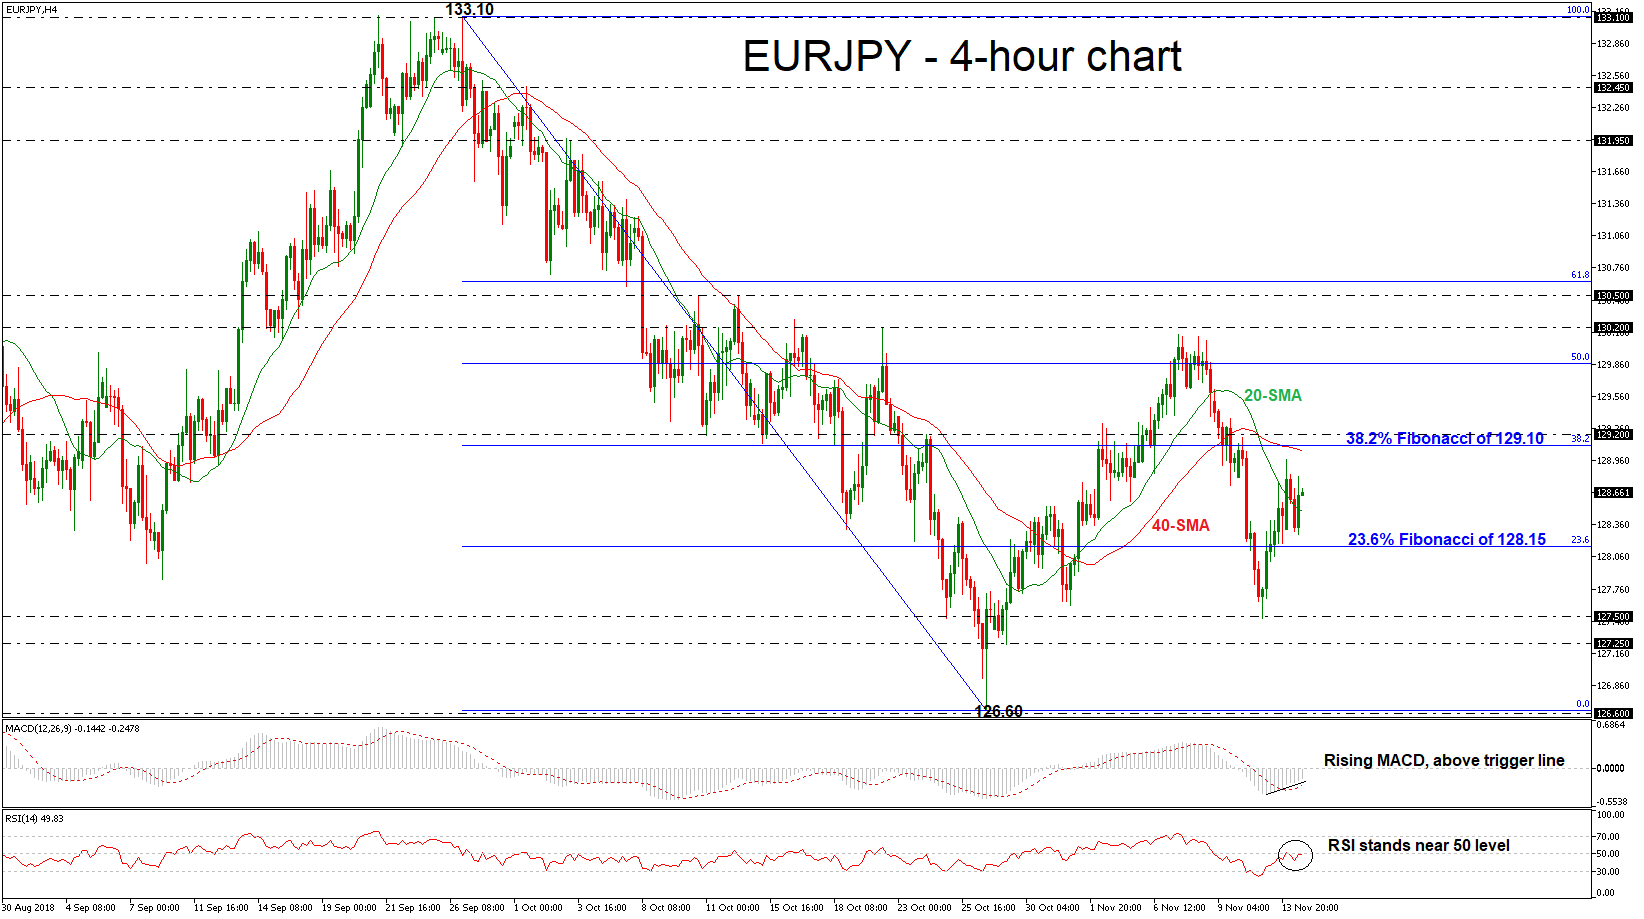
EURJPY has been trading within the 23.6% Fibonacci retracement level and the 38.2% Fibonacci mark of the downleg from 133.10 to 126.60, between 128.15 and 129.10 over the last 4-hour sessions. The MACD oscillator is moving higher in the negative zone, above its trigger line, and the RSI indicator is pointing up near the threshold of 50.
If prices are able to continue to move higher and overcome 38.2% Fibonacci of 129.10 and the 129.20 resistance, the next obstacle for traders to watch is the 50.0% Fibonacci of 129.86. Even higher, the price could meet the 130.20 hurdle, before being able to hit the 130.50 hurdle, taken from the high on October 12.
Alternatively, if the market manages to turn to the downside again below the 23.6% Fibonacci, this could open the way towards the 127.50, taken from the latest lows. Moving lower, the market could decline further until the 127.25 barrier.
To sum up, the market is expected to hold neutral in both the short-term and medium-term.
USD/JPY Mid-Day Outlook
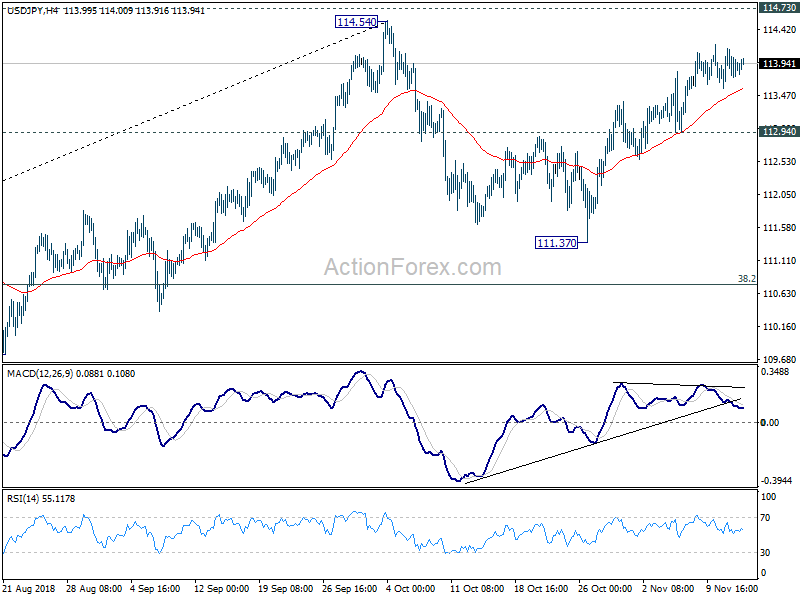
Daily Pivots: (S1) 113.54; (P) 113.85; (R1) 114.11; More..
With 112.94 minor support intact, further rise is mildly in favor for 114.54/73 resistance zone. But due to loss of upside momentum as seen in 4 hour MACD, we'd be cautious on strong resistance from 114.54/73 to limit upside and bring reversal. On the downside, break of 112.94 minor support will extend the consolidation pattern from 114.54 with another falling leg back to 111.37. Overall, rise from 104.62 is still in progress and decisive break of 114.73 will confirm resumption.
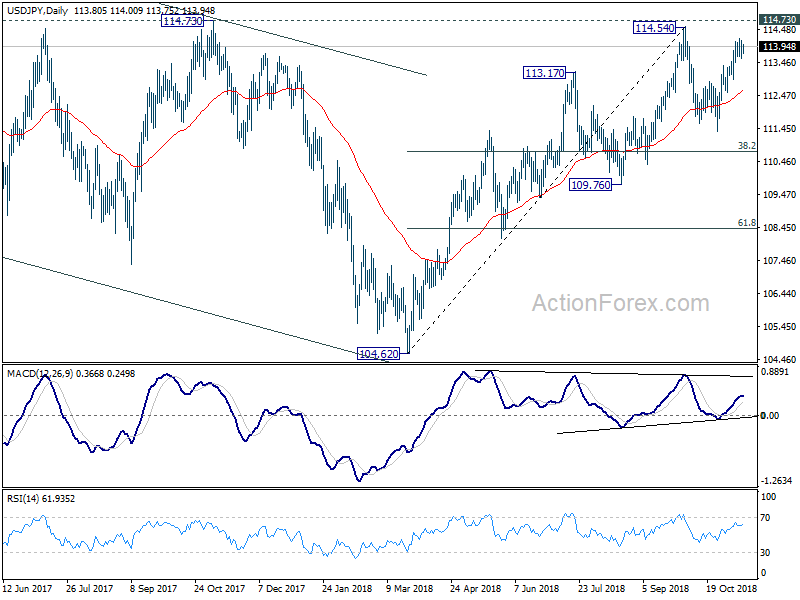
In the bigger picture, corrective fall from 118.65 (2016 high) should have completed with three waves down to 104.62. Decisive break of 114.73 resistance will likely resume whole rally from 98.97 (2016 low) to 100% projection of 98.97 to 118.65 from 104.62 at 124.30, which is reasonably close to 125.85 (2015 high). This will stay as the preferred case as long as 109.76 support holds. However, decisive break of 109.76 will dampen this bullish view and turns outlook mixed again.
USD/CHF Mid-Day Outlook
Daily Pivots: (S1) 1.0050; (P) 1.0089; (R1) 1.0110; More...
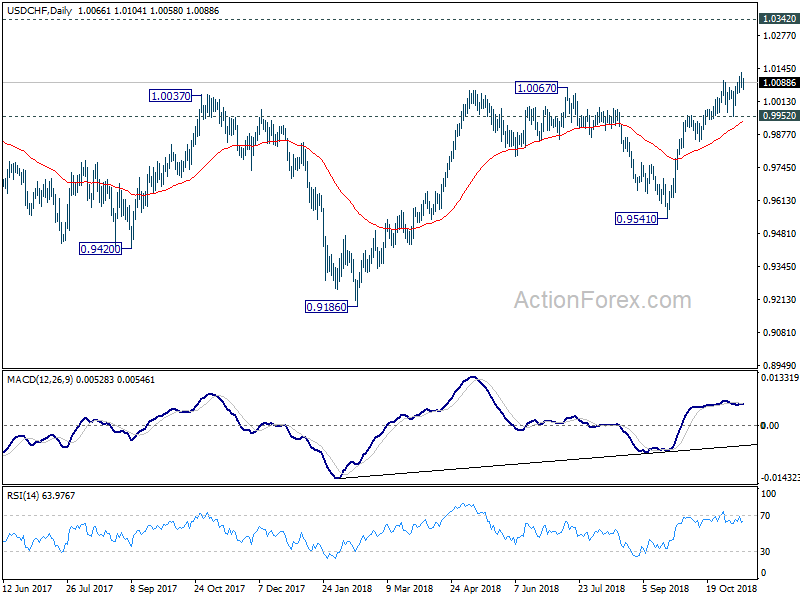
Intraday bias in USD/CHF remains neutral for consolidation below 1.0128 temporary top. Another rally is expected as long as 0.9952 support holds. On the upside, break of 1.0128 would resume larger rise from 0.9186 and target 1.0342 key resistance. However, firm break of 0.9952 will indicate short term topping and bring deeper fall.
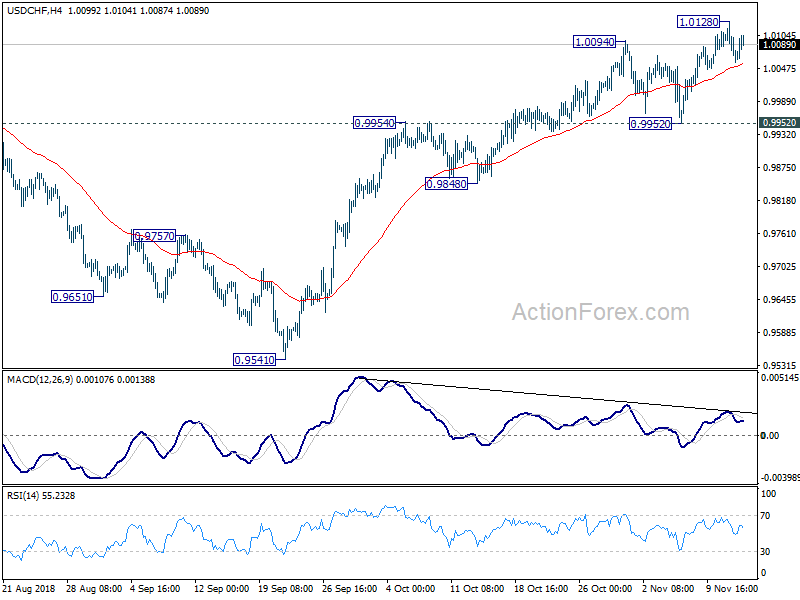
In the bigger picture, the pullback from 1.0067 has completed at 0.9541 already. And rise from 0.9186 is likely resuming. Firm break of 1.0067 will pave the way to retest 1.0342 key resistance. We'd be cautious on strong resistance from there to limit upside to bring another medium term fall to extend long term range trading. However, firm break of 0.9848 near term support will dampen this view and bring deeper decline back to 0.9541 support and possibly below.