Sample Category Title
EUR/CAD 4H Chart: Decline Likely To Continue
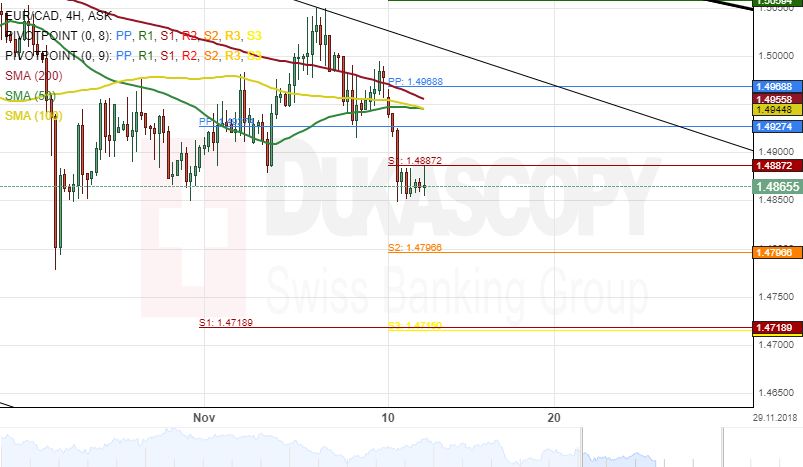
A long-term descending channel pattern has been dominating the common European currency versus the Canadian Dollar for the past few months. This decline began after the currency pair made a U-turn from the upper boundary of a dominant descending channel at 1.6148 on March 21.
A weekly S1 at 1.4887 was providing resistance for the exchange rate during the morning hours of today's session.
If this resistance level holds, the currency exchange rate could continue its southern movement today.
On the other hand, if the rate passes that resistance level as mentioned earlier, the EUR/CAD pair will target the three SMAs at 1.4946 during the following trading sessions.
EUR/AUD 4H Chart: Set For Breakout
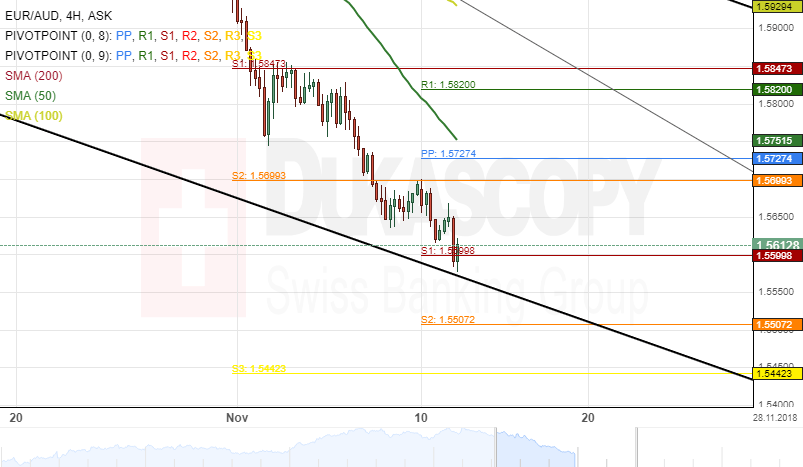
Downside momentum has been dominating the EUR/AUD currency pair since the rate touched the upper boundary of a descending channel pattern at 1.6350 on October 11.
The exchange rate is trading near the bottom border of the channel pattern during the morning hours of Tuesday's trading session and could be set for a breakout.
If this southern breakout occurs, the EUR/AUD currency pair could aim at June 4 swing low level of 1.5300 during the coming days.
Although, the short-term target for bearish traders could be near a support level formed by the monthly pivot point at 1.5453.
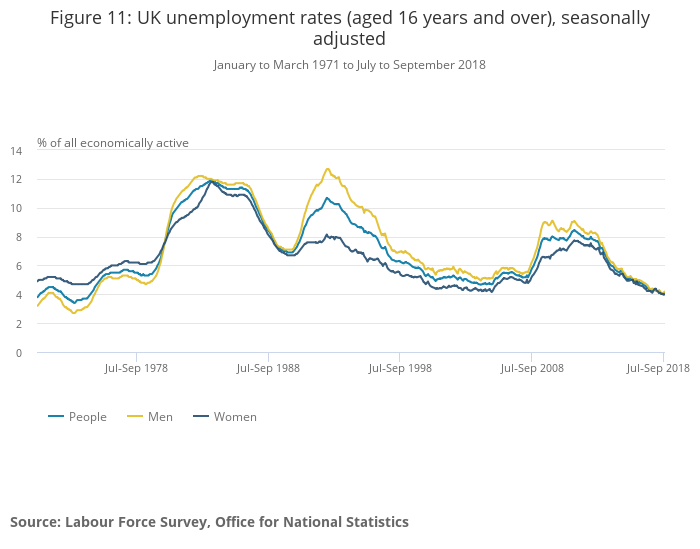
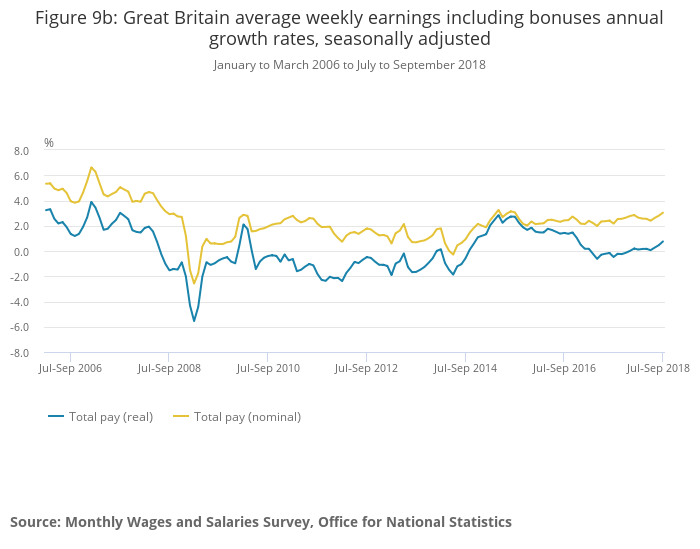
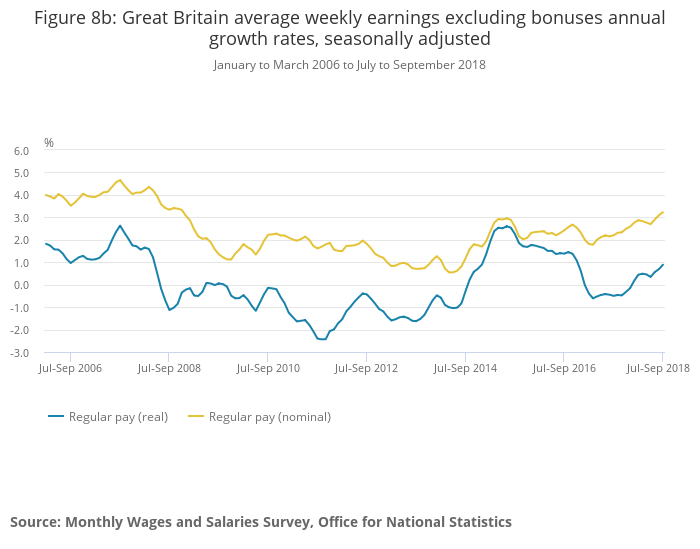
UK unemployment rate rose to 4.1%, but wage growth accelerated
UK unemployment rate rose 0.1% to 4.1% in the three months ended September, above expectation of 4.0%. But wage growth showed clear acceleration. Average weekly earnings including bonus rose 3.0% 3moy in September, up from 2.7% and matched expectation. Weekly earnings excluding bonus rose 3.2% 3moy, up from 3.1%, beat expectation of 3.1%. Jobless claims rose 20.2k in October, higher than expectation of 4.3k. Overall set of data should be pound positive, but there is no follow through buying yet.
The Analytical Overview Of The Main Currency Pairs
The EUR/USD currency pair
Technical indicators of the currency pair:
Prev Open: 1.13223
Open: 1.12176
% chg. over the last day: -0.88
Day's range: 1.12165 – 1.12573
52 wk range: 1.1299 – 1.2557
EUR is consolidating around the annual minimums. The key support and resistance levels are 1.12200 and 1.12600. The conflict between the EU and Italy remains in the spotlight. Nonetheless, a technical correction is possible soon. You should open positions from the key levels.
At 12:00 (GMT+2:00) an Economic Sentiment Index by ZEW will be published in Germany.
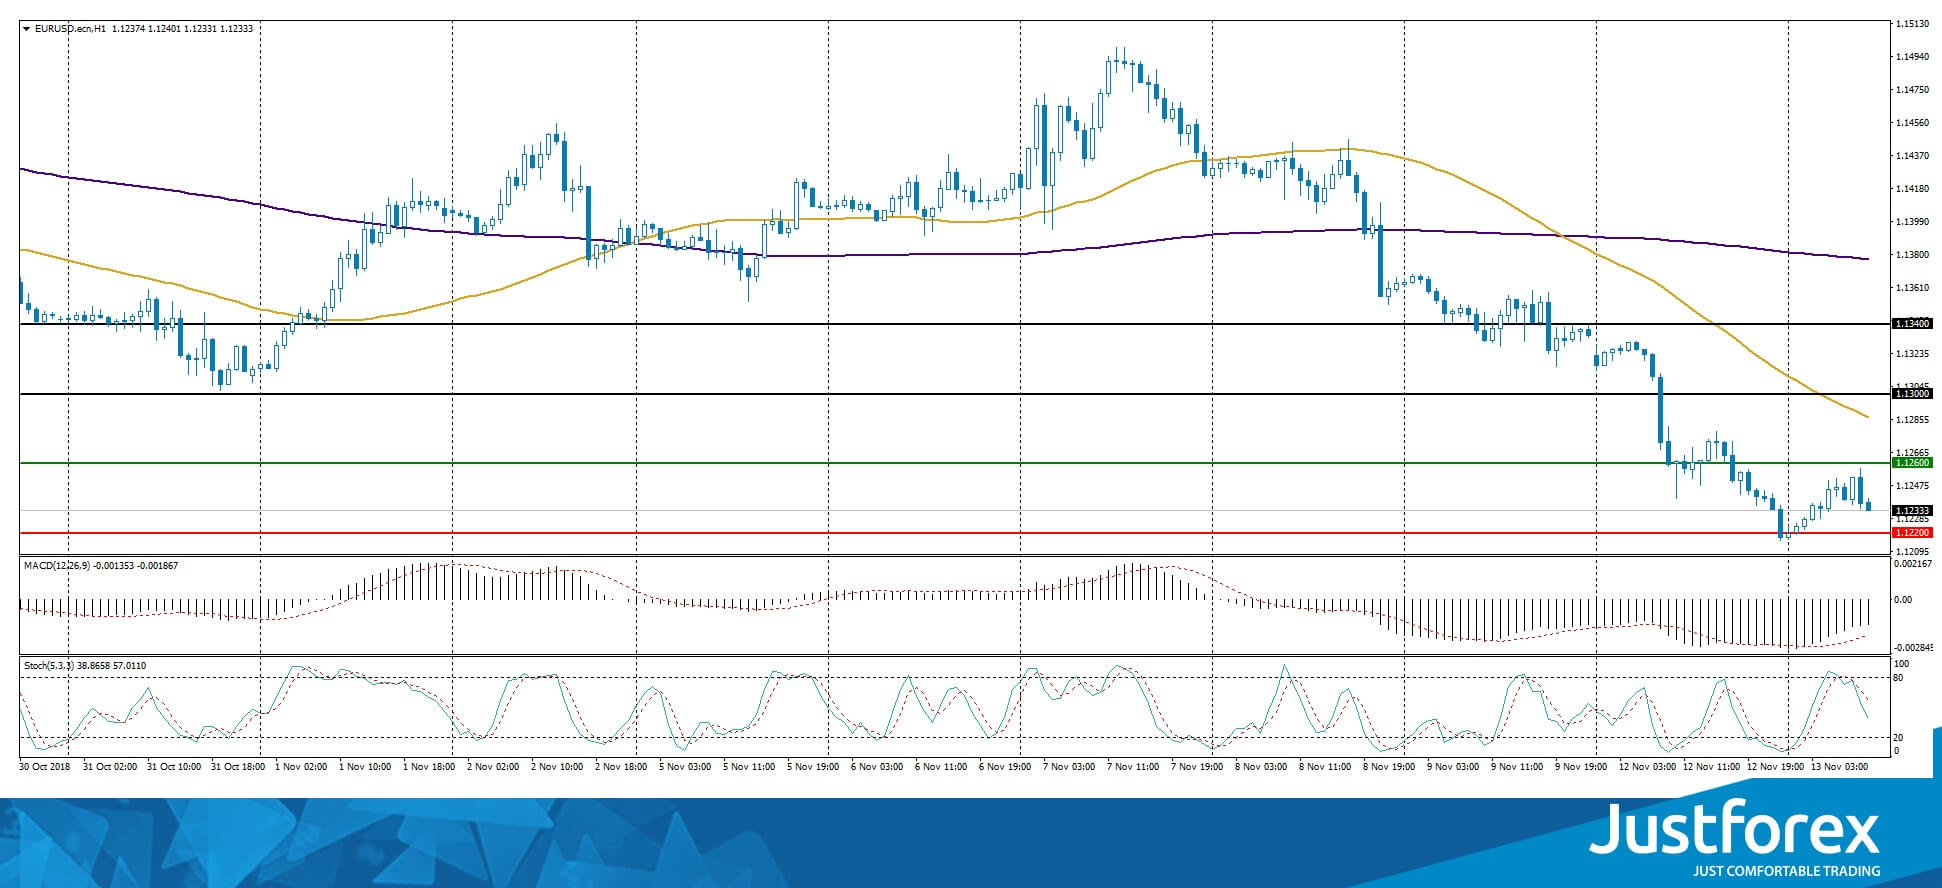
The indicators show the buyers` strength: the price fixed below 50 MA and 200 MA.
The MACD histogram is in the red but above the signal line, which gives a weak signal towards a sell-off of EUR/USD.
The Stochastic Oscillator is in the neutral zone, the %K line is below the %D line, which indicates a bearish sentiment.
Trading recommendations
Support levels: 1.12200, 1.12000, 1.11500
Resistance levels: 1.12600, 1.13000, 1.13400
If the price fixes below the support line 1.12200, we can expect further descend of the EUR/USD quotes. The movement will tend toward 1.11750-1.11500.
Alternatively, the price fixes above 1.12600, we can expect a correction of the EUR/USD. The movement will tend toward the round 1.13000.
The GBP/USD currency pair
Technical indicators of the currency pair:
Prev Open: 1.29182
Open: 1.28475
% chg. over the last day: -0.65
Day's range: 1.28349 – 1.28970
52 wk range: 1.2662 – 1.4378
GBP/USD shows an uncertain technical picture. The pound is being traded in flat. The local support and resistance are 1.28400 and 1.29000. Positions should be opened from the key levels. The market participants are waiting for important stats from GB and new data regarding the Brexit process.
At 11:30 (GMT+2:00) we expect a Labour Market report from Great Britain.
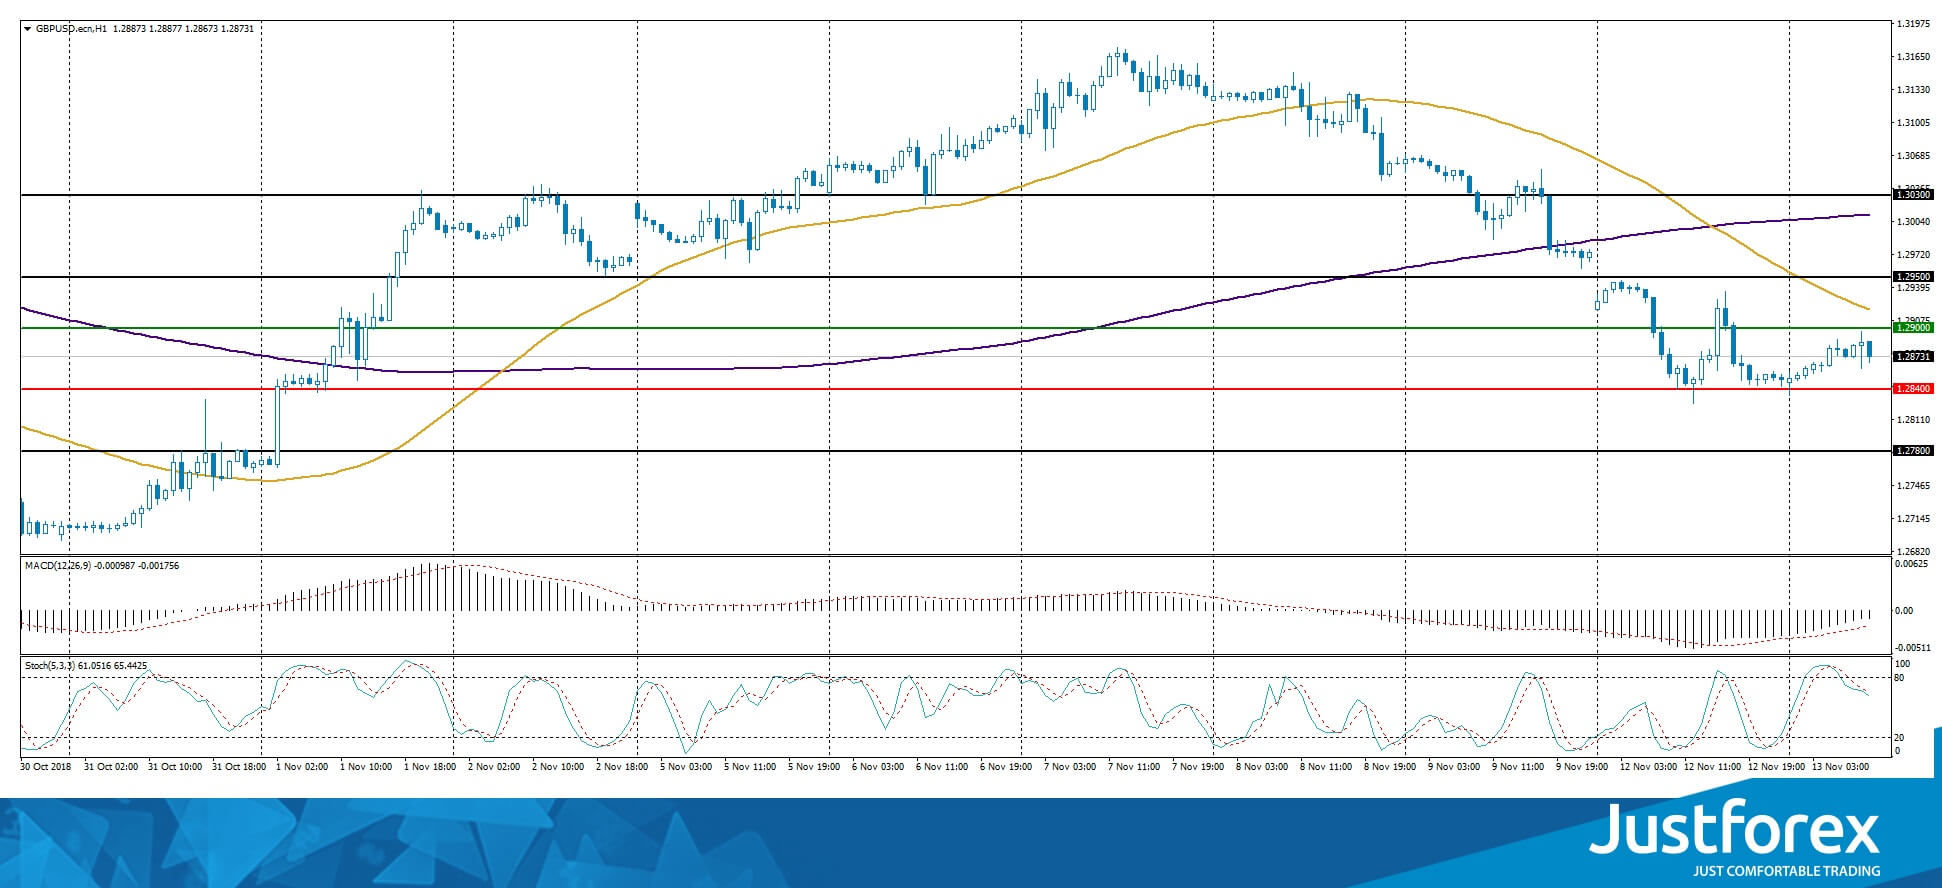
The indicators point towards the power of the buyers, the price fixed below 50 MA and 200 MA.
The MACD histogram is in the negative zone but above the signal line, which gives a weak signal towards the purchase of GBP/USD.
The Stochastic Oscillator is in the neutral zone, the %K line is below the %D line, which indicates a bearish sentiment.
Trading recommendations
Support levels: 1.28400, 1.27800
Resistance levels: 1.29000, 1.29500, 1.30300
If the price fixes below the local support 1.28400, we can expect further descend of the GBP/USD currency pair. The movement will tend toward 1.28000-1.27800.
Alternatively, the quotes can recover to the mirror support level of 1.29500.
The USD/CAD currency pair
Technical indicators of the currency pair:
Prev Open: 1.32034
Open: 1.32434
% chg. over the last day: +0.37
Day's range: 1.32152 – 1.32481
52 wk range: 1.2248 – 1.3387
The USD/CAD currency pair keeps testing the monthly maximums. The local support and resistance are 1.32150 and 1.32500 respectively. The trading instrument has good growing prospects. Positions should be opened from the key levels. Also, keep an eye on the oil quotes` pricing.
The news feed for Canada is calm for today.
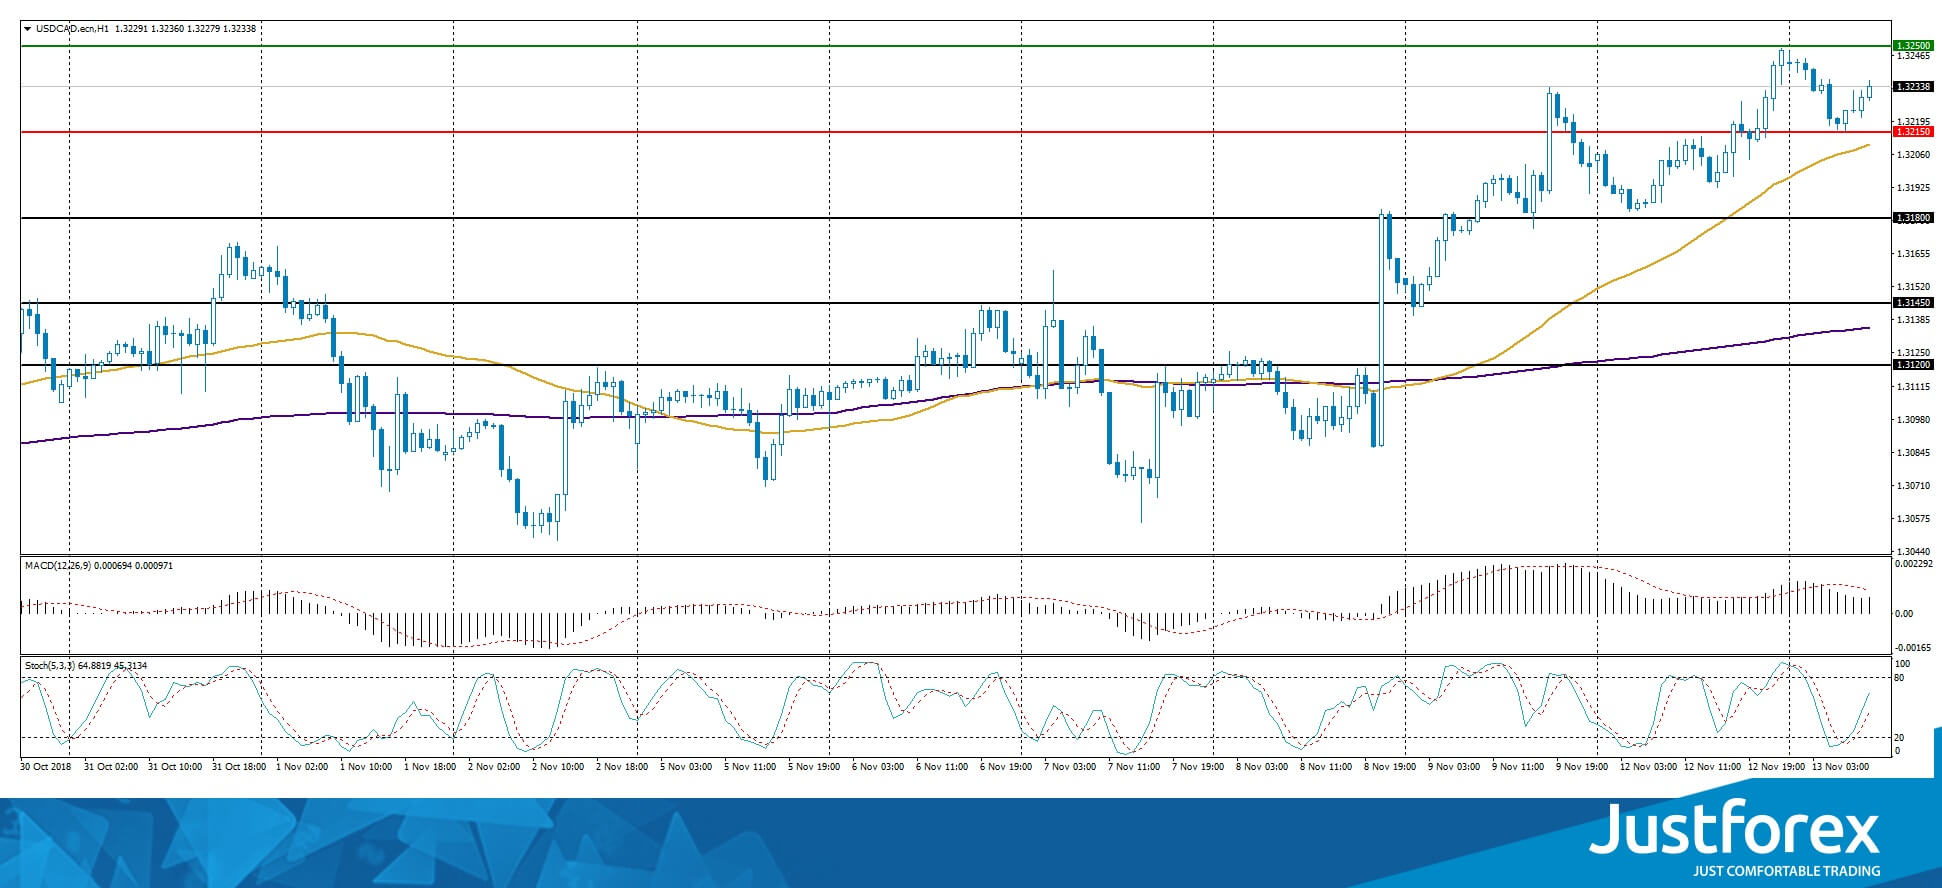
The indicators point towards the power of the buyers: the price fixed above 50 MA and 200 MA.
The MACD histogram is in the positive zone but below the signal line, which gives a weak signal towards the purchase of USD/CAD.
The Stochastic Oscillator is in the neutral zone, the %K line is above the %D line, which indicates a bullish sentiment.
Trading recommendations
Support levels: 1.32150, 1.31800, 1.31450
Resistance levels: 1.32500, 1.33000
If the price fixes above 1.32500 we recommend you to consider purchasing USD/CAD. The movement will tend toward the round 1.33000.
Alternatively, the currency pair can descend to 1.31800-1.31600.
The USD/JPY currency pair
Technical indicators of the currency pair:
Prev Open: 113.794
Open: 113.832
% chg. over the last day: -0.14
Day's range: 113.580 – 114.130
52 wk range: 104.56 – 114.74
The last couple of sessions have had rather active USD/JPY trading. At the same time, there is no singular trend. The market participants are waiting for additional drivers. At the moment, the local support and resistance levels are 113.850 and 114.200. Positions should be opened from these levels.
No important economic statistics are expected from Japan today.
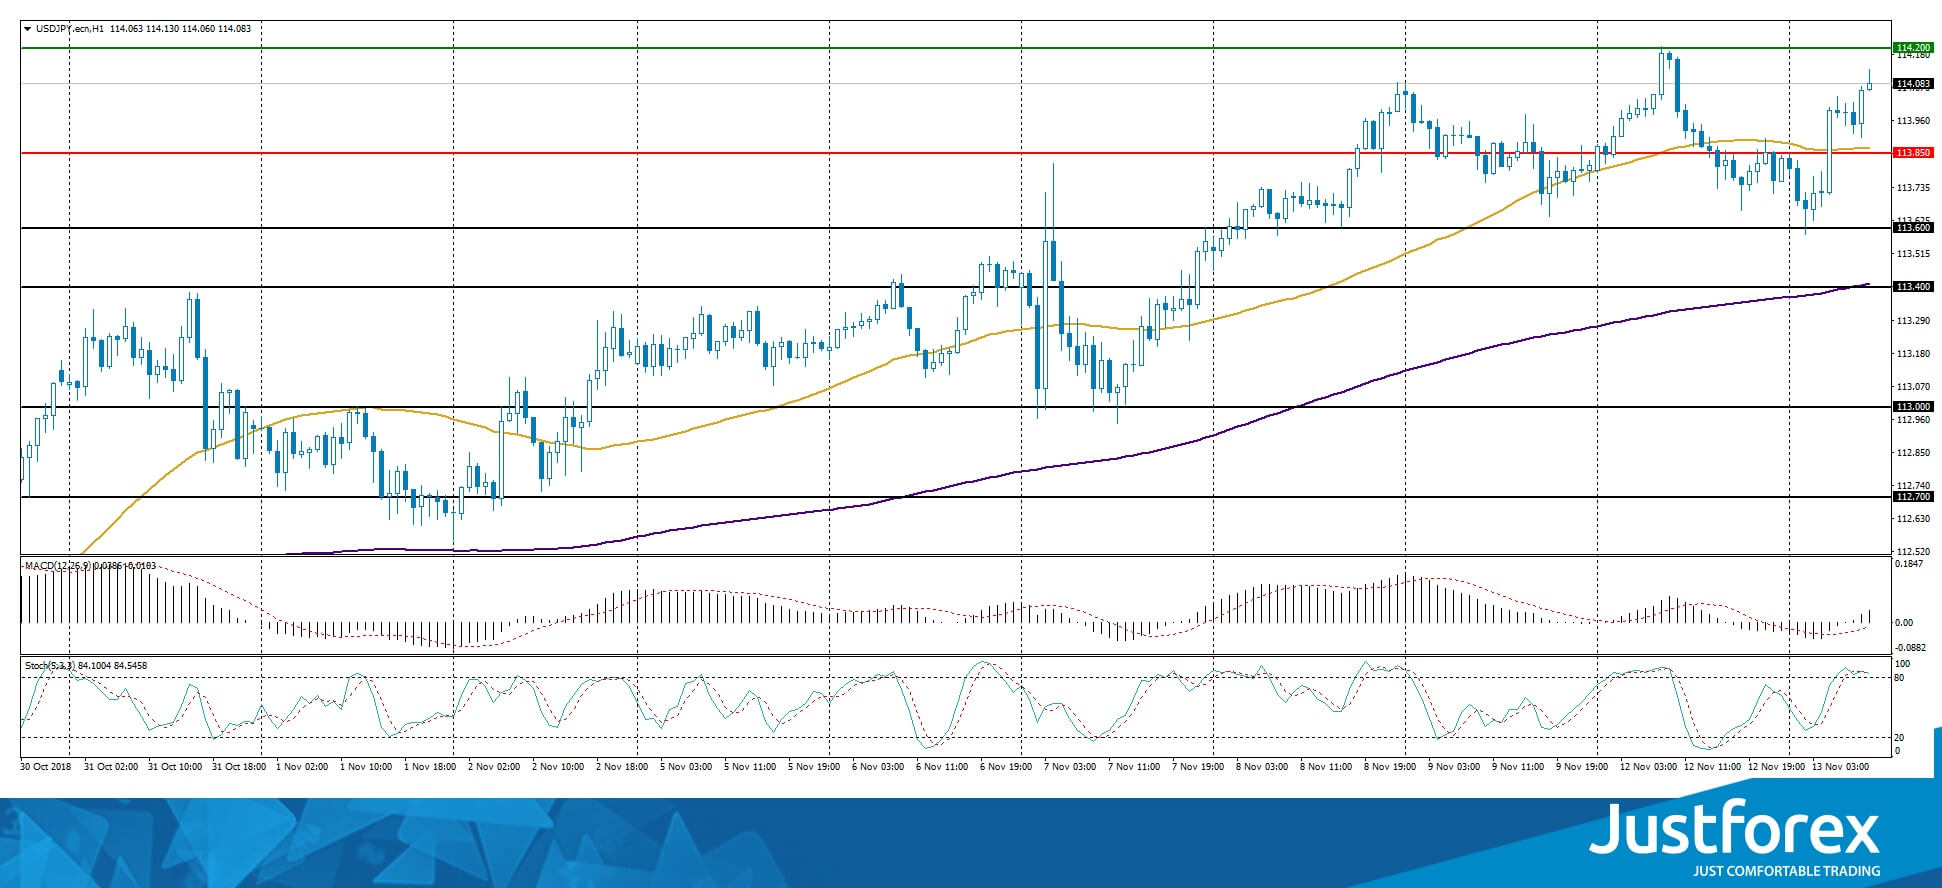
The price fixed above 50 MA and 200 MA, which indicates the power of the buyers.
The MACD histogram switched into the positive zone, which indicates a bullish sentiment.
The Stochastic Oscillator is in the neutral zone, the %K line has crossed the %D line. No signals are expected at the moment.
Trading recommendations
Support levels: 113.850, 113.600, 113.400
Resistance levels: 114.200, 114.500
If the price fixes above the resistance line 114.200 we can expect further growth towards 114.500-114750.
Alternatively the USD/JPY can descend towards 113.600-113.400.
Dollar Growth Has Pushed Down Stock Indices
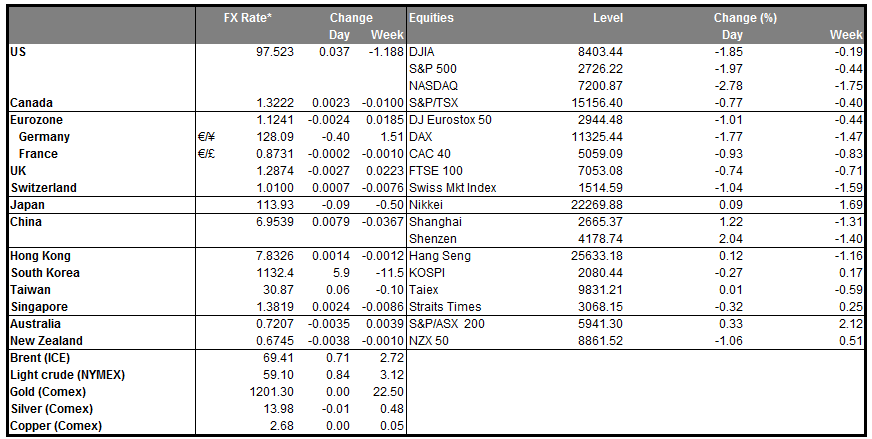
Monday was a hard day for the financial markets. American DJI lost more than 2.3% and S&P500 decreased by 2.0%. As in previous weeks, the main pressure was on the shares of high-tech companies. In the process when investors shift from growth-oriented stocks towards earning shares, previous market favorites are experiencing the heaviest blow. It is also not without unpleasant news, as for example, the decline in Apple shares by 5% was partly due to the sharp declines in forecasts for sales from analysts.
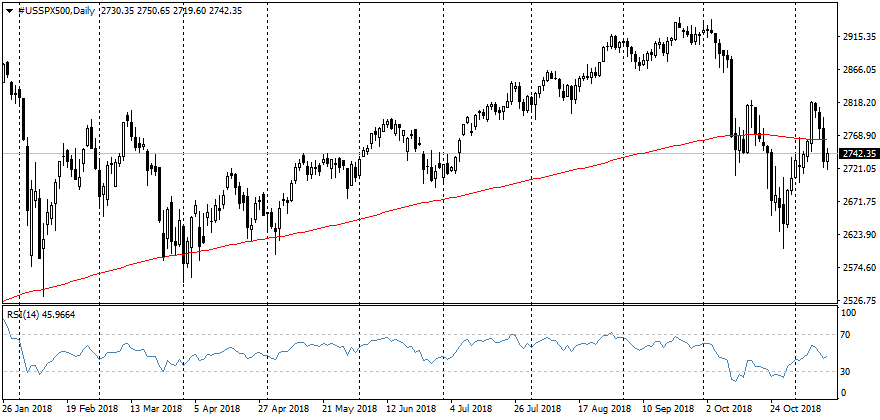
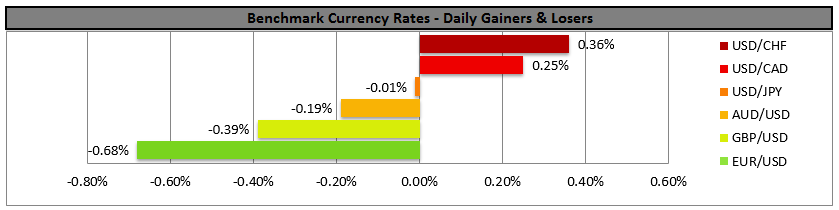
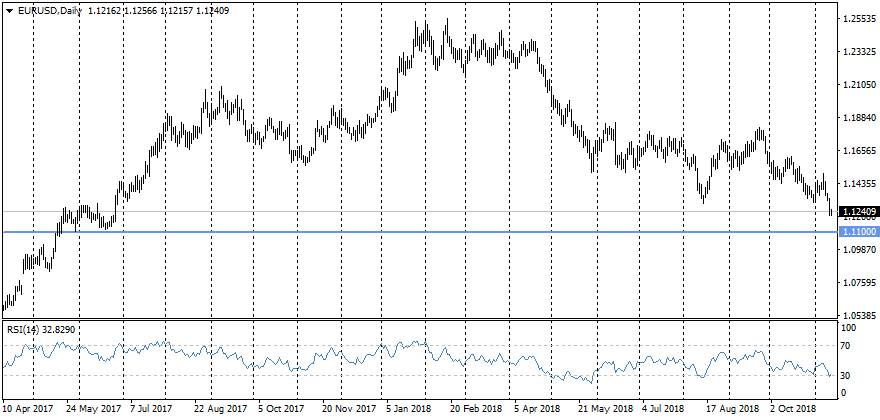
In this case, the demand for dollar as a protective asset has increased again, which further weighted the stocks. The dollar index increased by 0.8% on Monday and updated the highs from the middle of last year. Today morning, the dollar has departed from local highs, but such sharp movement on Monday allows us to assume serious support from the side of dollar bulls. The single currency yesterday lost 0.9% to the dollar, stopping one step from 1.1200 after the words of Macron (France President) that the euro is not yet a substitute for the dollar due to political problems, such as the ongoing standoff between Italy and the European Commission around the budget deficit.
The dollar may continue to receive support from the markets beyond the previous resistance area. Now the focus of the markets may shift to the following index extremums around 103. For a single currency, the persistence of alertness around Italy coupled with the increased demand for the dollar, is set to a decrease below the mark of 1.10.
The cautious trading tone of Asian grounds was replaced in the morning by a more positive attitude. Hopes for trade negotiations between China and the United States contributed to the growth. In addition, it is worth highlighting the sharp reversal of yuan to growth. In the previous month, the People’s Bank of China actively engaged in interventions in the foreign exchange market, protecting the rate from decline, although it did not interfere USDCNH’s from crawling up. 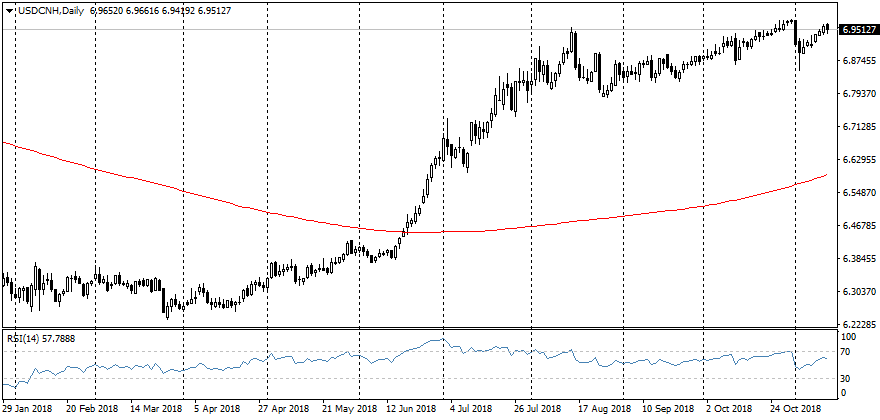
In November, we have already seen a couple of sharp kickbacks of the pair associated with good news from China, but the scale of the decline suggests that it was also the intervention of the PBC. However, such interventions do not fundamentally change the sentiment in the markets, and the moment of growth should be a quick return to the fundamental trend.
Forex Technical Analysis: EUR/USD, USD/JPY, GBP/USD
EUR/USD
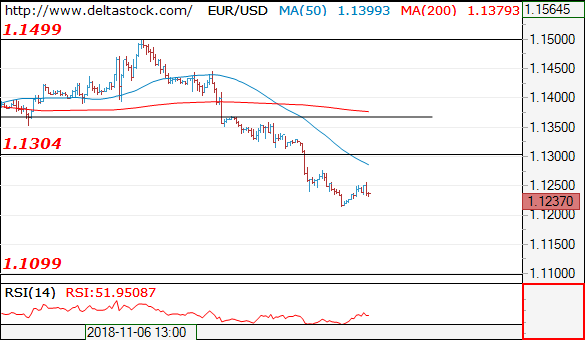
Current level - 1.1237
The downtrend remains intact and 112.80 minor hurdle should limit the upside, for a continuation towards 1.1100 area. Key static resistance lies at 1.1300 and crucial on the upside is 1.1360.
| Resistance | Support | ||
| intraday | intraweek | intraday | intraweek |
| 1.1300 | 1.1360 | 1.1200 | 1.1300 |
| 1.1360 | 1.1500 | 1.1100 | 1.1110 |
USD/JPY
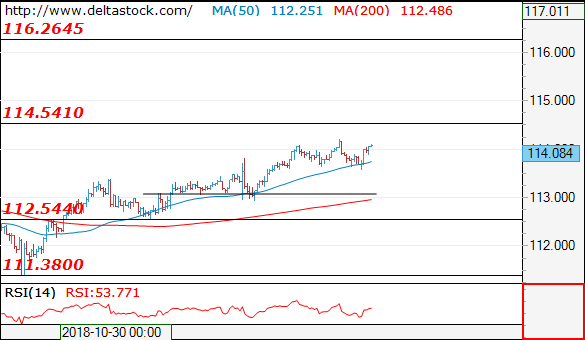
Current level - 114.08
The overall outlook remains positive, for a break through 114.50, en route to 116.20 area. Crucial on the downside is 112.90.
| Resistance | Support | ||
| intraday | intraweek | intraday | intraweek |
| 114.50 | 114.50 | 113.60 | 111.60 |
| 115.50 | 116.20 | 112.90 | 110.40 |
GBP/USD
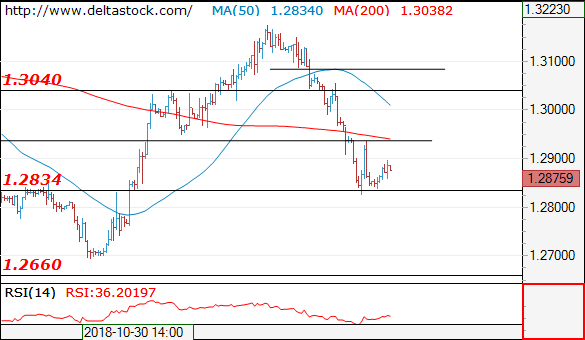
Current level - 1.2875
The rebound above 1.2830 is corrective and 1.2940 resistance is expected to limit the upside, for a continuation of the downtrend towards 1.2660 low.
| Resistance | Support | ||
| intraday | intraweek | intraday | intraweek |
| 1.2950 | 1.3250 | 1.2830 | 1.2660 |
| 1.3040 | 1.3440 | 1.2770 | 1.2570 |
USDJPY Outlook: Bulls Probe Again Above 114.00 Following Repeated Failure
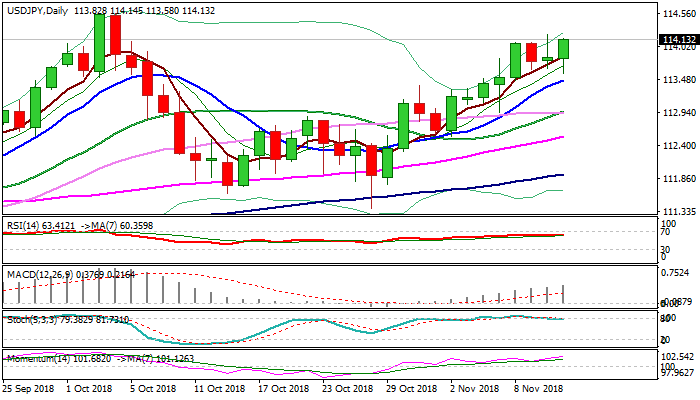
The pair maintains bullish tone and probes again above 114.00 barrier, where upside attempts were repeatedly rejected in previous sessions, keeping the price congested within 114.10/113.60 consolidation.
The dollar remains well supported on expectations that the Fed would raise interest rates once more this year and data that show the US economy is strong.
Daily techs maintain strong bullish momentum, with rising MA’s in full bullish setup, underpinning the advance.
Bulls focus key barrier at 114.54 (2018 high) break of which would complete 114.54/111.37 corrective phase and signal continuation of larger uptrend from 104.63 (2018 low) towards targets at 114.73 (06 Nov 2017 high) and 115.35 (Fibo 76.4% of 118.66/104.63 fall) in extension.
Bulls need sustained break above 114.10/20 highs to open way towards 114.54, but could be distracted again as slow stochastic is attempting to reverse from overbought territory and long upper shadow on Monday’s candle.
Bulls are expected to remain intact if current consolidation extends, but holds above rising 10SMA (113.47), while break here would sideline bulls and signal deeper pullback.
Res: 114.20, 114.54, 114.73, 115.35
Sup: 113.80, 113.47, 113.38, 113.01
WTI Crude Oil Futures Hover Near 9-Month Low, Bearish Bias In Short-Term
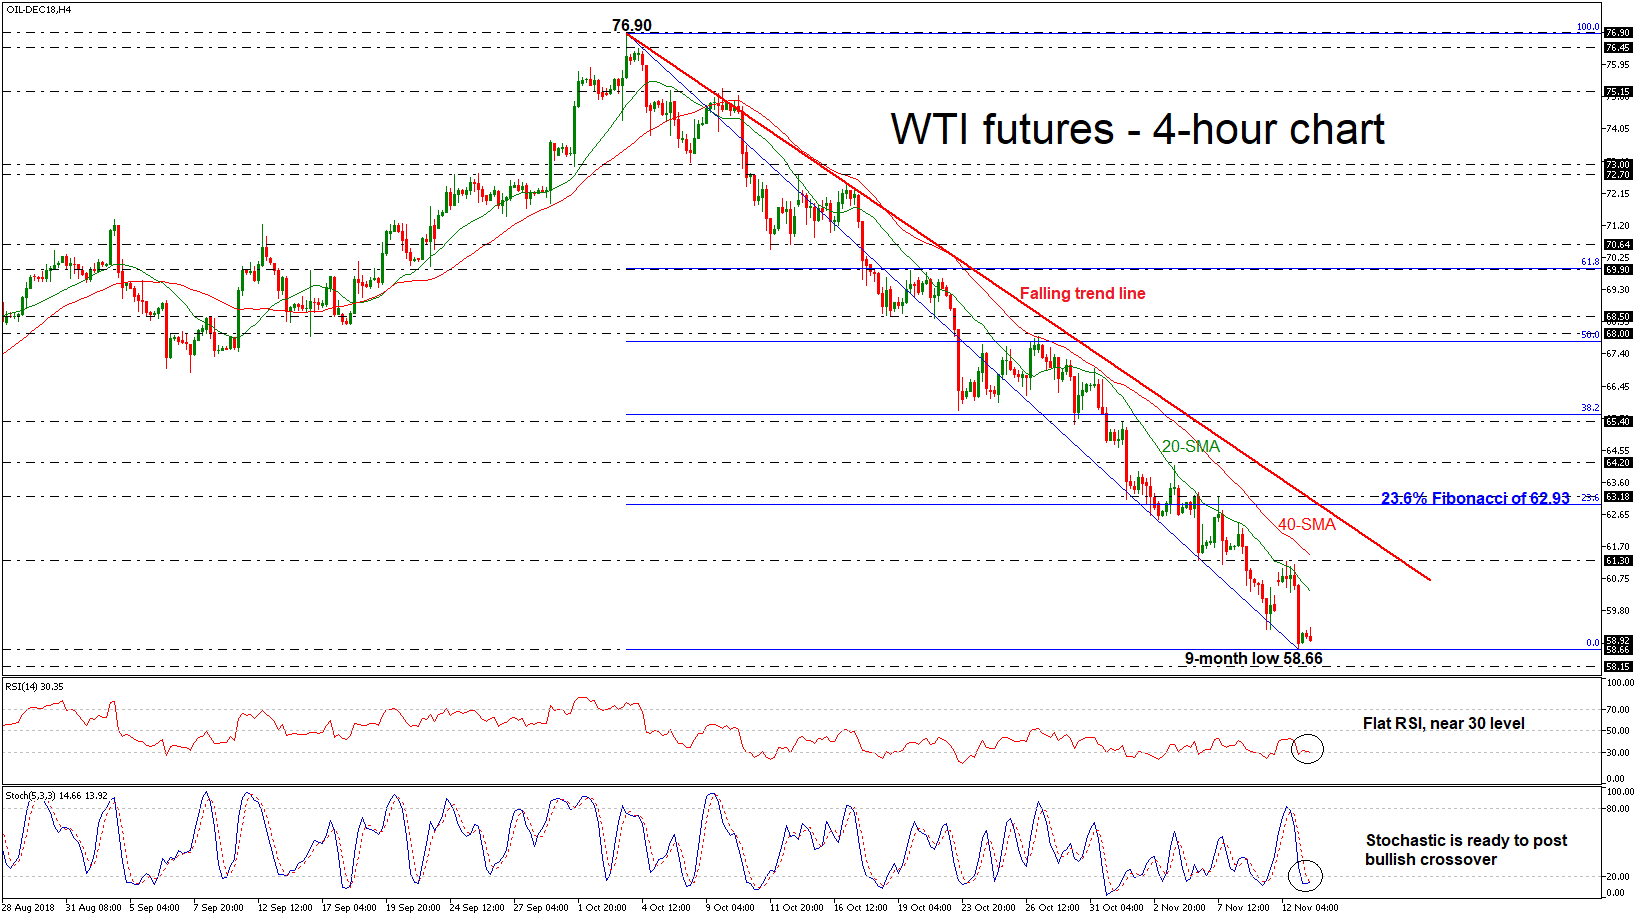
West Texas Intermediate (WTI) futures plummeted to a new nine-month low of 58.66 on Monday, creating the eleventh red day in a row. Prices remain below the simple moving averages (SMAs) in the 4-hour chart and are hovering slightly above the aforementioned low. According to the momentum indicators, the blue %K line of the stochastic oscillator is turning higher, ready to create a bullish crossover with the red %D line. The RSI indicator is flattening in the bearish territory. Both are suggesting an end to the downward movement.
However, should the price manage to strengthen its negative bias and post a significant leg below the nine-month low, the next support could come immediately at 58.15, taken from the low on February 9. A break below this area would shift the bias to an even more negative one and open the way towards the 56.00 handle, achieved on December 2017.
On the upside, if prices rebound from the recent low, they could touch the 20-SMA near 60.42 at the time of writing, before heading towards the 61.30 resistance level. Further improvement could drive oil prices until the 23.6% Fibonacci retracement level of the downleg from 76.90 to 58.66, around 62.93.
Overall, WTI crude shifted the bullish outlook to negative, especially after the slip below the 64.00 psychological level. In the short-term, the price has been mostly declining since October 3.
The Is Testing The Annual Maximums
During the yesterdays' trading, the USD has strengthened against the basket of major currencies once more. The USD index (#DX) set the new annual maximums and closed in the positive zone (+0.67%). Nonetheless, a technical correction is highly possible, since the investors can start fixing the positions. The financial market participants are waiting for the statement by the Head of the Federal Reserve and the publication of the important economic reports from the US.
A political conflict between the EU and Italy remains in the spotlight. On October 23, the EU refused to approve the Italian budget, and this week the official Rome will present a new one, which should fit better. The pound remains under pressure due to the uncertainty regarding Brexit. We are expecting important reports from Great Britain and Germany.
The oil market is showing an aggressive sell-off. The WTI futures are being traded at 59.25 USD/barrel.
Market Indicators
The US stock indices closed the trading session in the red: #SPY (-1,87%), #DIA (-2,26%), #QQQ (-3,03%).
The 10-year US government bonds yield is 3.18-3.19%.
The Economic News Feed for 13.11.2018:
Labour Market Report (GB) – 11:30 (GMT+2:00);
ZEW Indicator of Economic Sentiment (GER) – 12:00 (GMT+2:00).
Also keep an eye on the statements by the FOMC representatives.
Rome-Brussels Stand-Off Escalates
The EU Commission could be escalating its confrontation with Italy regarding Italy's budget deficit. Italy's deadline to deliver a revised budget, after the first draft was rejected by the commission, ends today. For the time being, there are no signs that the Italian government has any intentions to revise its current budget for 2019. EU officials state that, should Italy insist on maintaining the current level of deficit, it would be very difficult for the commission not to take any action, as it would undermine the credibility of the fiscal rules. It should be noted that there is still a long way for ultimate penalties to be imposed on Italy, however the first steps could be taken now. The implications of a confrontation between Rome and Brussels, could spill over to other issues and create a wider political instability in the Eurozone and the EU in general. As Europe braces for the escalation of the confrontation, the common currency may experience high volatility.
EUR/USD dropped breaking consecutively the 1.1305 (R2) and the 1.1250 (R1) support lines, now turned to resistance. We see the case for the pair to continue to trade in a bearish market today as the downward trendline incepted since the 7th of November remains intact. Please note that the RSI indicator in the 4 hour chart has fallen below the reading of 30, implying a rather overcrowded short position for the pair. Also note, that the pair showed some signs of stabilisation during the Asian session today. If the bears continue to dictate the pair's direction, we could see the pair breaking the 1.1200 (S1) support line and aim for lower grounds. Should the bulls take over, we could see the pair breaking the 1.1250(R1) resistance line and aim for the 1.1305(R2) resistance hurdle.
Choppy trading for pound as Brexit negotiations peak
The pound had a roller-coaster session yesterday against the USD, as Brexit negotiations defined the investor's sentiment. Cable initially rose as media reports cited EU's chief negotiator Michel Barnier as stating that the main elements of a deal were ready. However subsequently UK PM's spokesman denied such a development, sending the pair back into the lows. Analysts point out that despite EU officials being more optimistic about a possible deal, the market has become more sceptical. Theresa May's Brexit strategy has come under attack by all sides in the UK, including hard Brexiteers within her own party as well as the DUP, which provides for majority in parliament. The pound is expected to continue to be volatile as the Brexit negotiations are ongoing and a number of financial releases affecting it are due out.
Cable dropped further yesterday, breaking the 1.2920 (R1) support line (now turned to resistance) and bouncing on the 1.2850 (S1) support line. We see the case for the market to continue to favour the pair's short positions and for our opinion to change, we would require cable to break the downward trendline incepted since last week's heights. Should the pair continue to be under the market's selling interest we could see it breaking the 1.2850 (S1) support line and aiming for lower levels. Should the market start favouring the pair's long positions, we could see the pair breaking the 1.2920 (R1) resistance line and aim higher.
In today's other economic highlights:
In today's European session we get Germany's final release of its HICP rate for October and the ZEW economic sentiment indicator for November, while from the UK we get September's employment data. As for speakers, ECB's Peter Praet, Sabine Lautenschlager and Luis De Guindos as well as Fed's Lael Brainard and Philadelphia Fed President Patrick Harker, speak.
EUR/USD H4
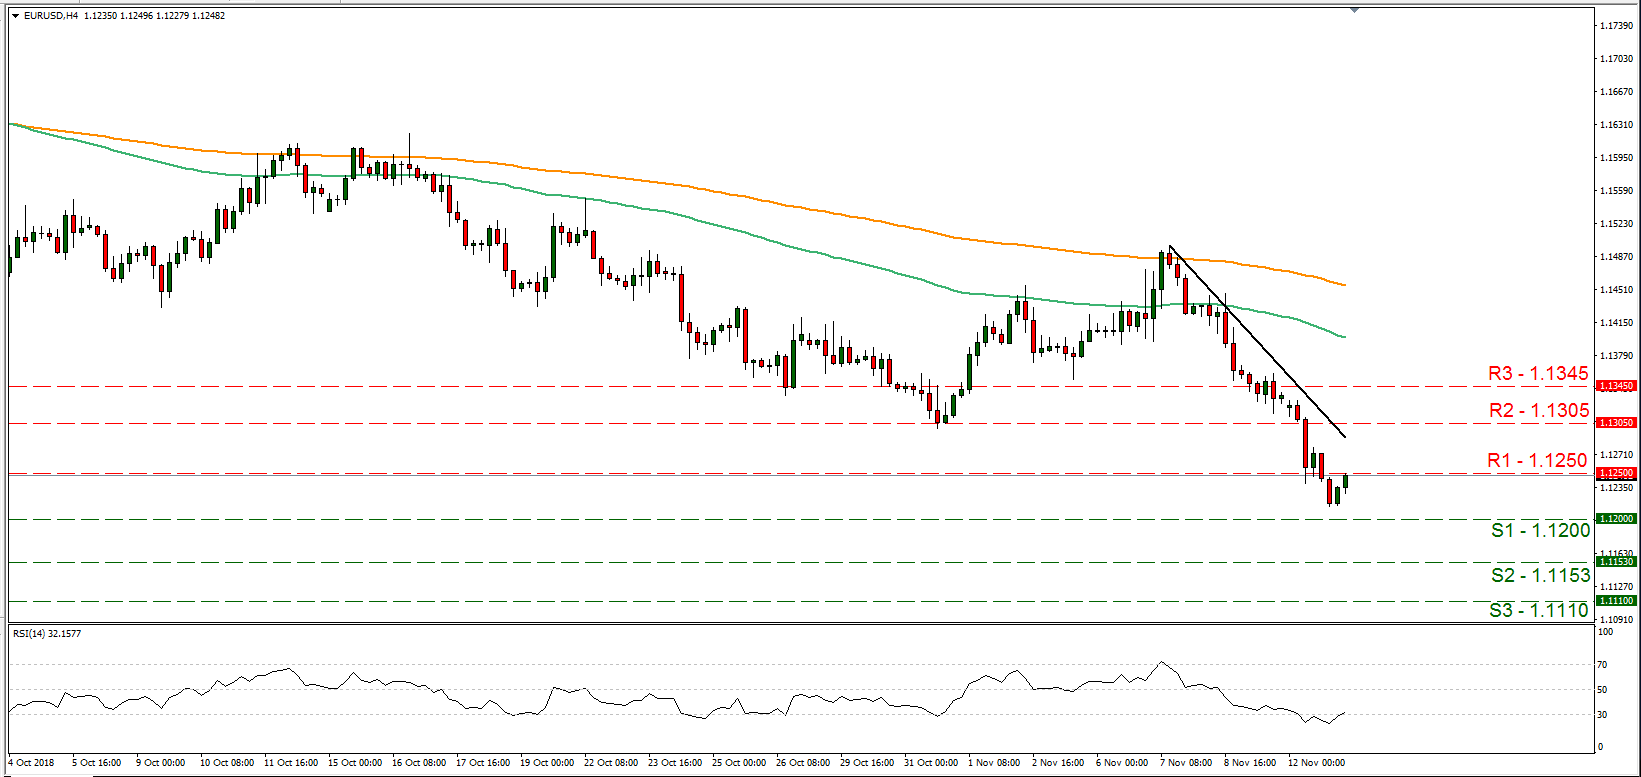
Support: 1.1200 (S1), 1.1153 (S2), 1.1110 (S3)
Resistance: 1.1250 (R1), 1.1305 (R2), 1.1345 (R3)
GBP/USD 4H
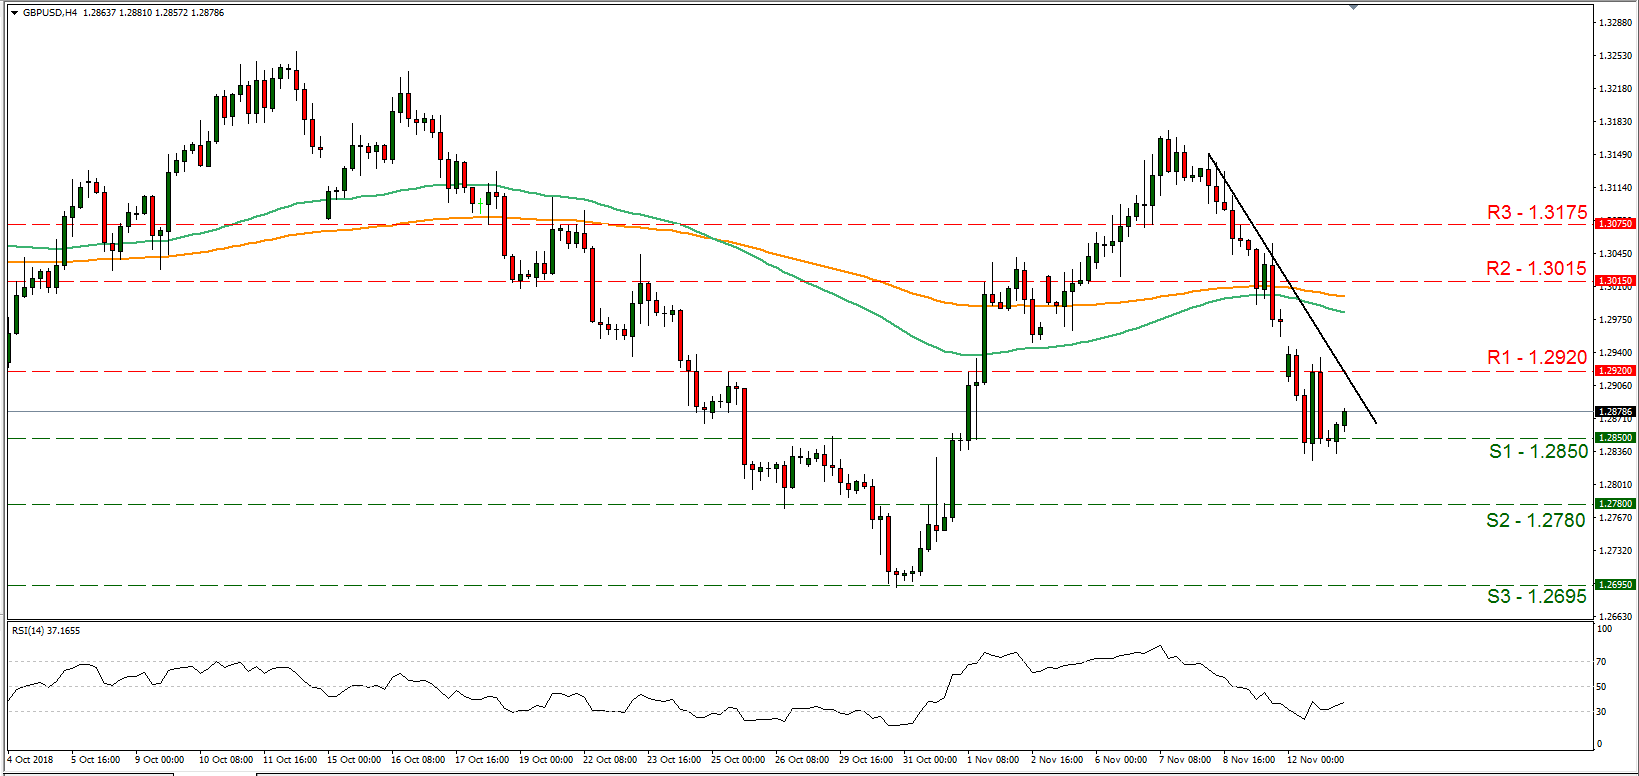
Support: 1.2850 (S1), 1.2780 (S2), 1.2695 (S3)
Resistance: 1.2920 (R1), 1.3015 (R2), 1.3175 (R3)