Sample Category Title
UK Wage Growth Expected To Rise For The Fourth Consecutive Time
The markets were seen trading reasonably quiet. Economic data on the day saw the release of Japan's producer price index. Data showed that PPI on the year rose to 2.9%, beating estimates of 2.8%. This was, however, slower compared to 3.0% increase seen the previous month.
The European trading session was relatively quiet. Industrial production in Italy fell 0.2% which comes after a 1.7% increase in the month before.
It is a busy day ahead starting with the release of the final inflation figures from Germany. The German final CPI is expected to show a 0.2% increase on the month.
Later in the day, the UK's ILO jobs report is due. The average earnings index in the three months to September is expected to advance 3.0%, rising from 2.7% previously. This would mark a fourth consecutive increase in wages. The unemployment rate is expected to remain steady at 4.0%.
The Eurozone and the German ZEW economic sentiment report is due later and is expected to show a decline on both counts. The declines reflect the weakening sentiment in the Eurozone.
Fed member, Brainard is scheduled to speak later in the day.
EURUSD 1.1216 Now Key Support
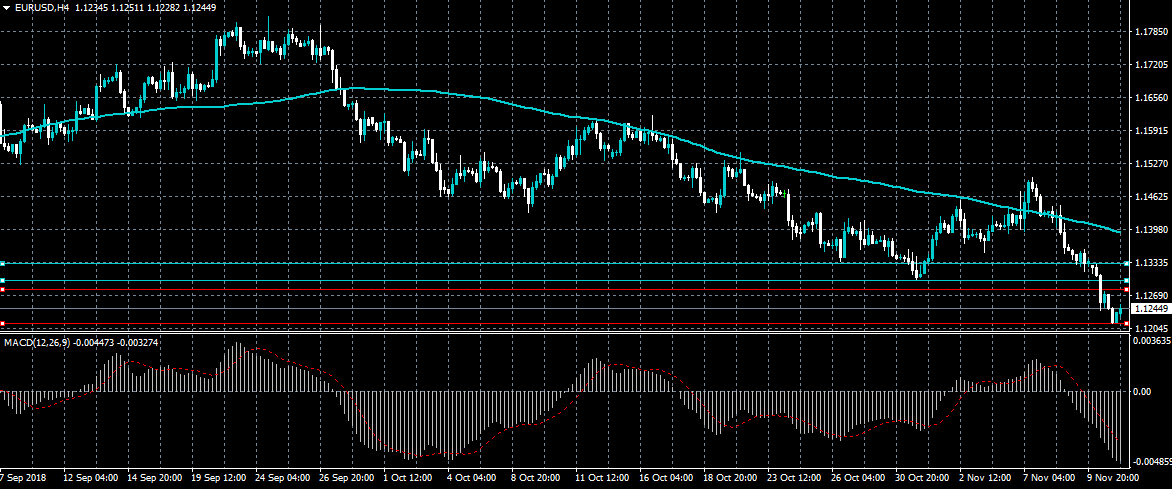
The euro has continued to move lower against the US dollar, as Italian political woes send the single currency towards the 1.1200 support level. The EURUSD pair remains heavily bearish and continues to create lower lows, only a strong move above the 1.1300 resistance level can negate short-term selling pressures. Traders now await key CPI inflation and ZEW survey data from the German economy during the European trading session.
The EURUSD pair remains strongly bearish while trading below the 1.1300 level, key technical support is now found at the 1.1216 and 1.1178 levels.
If the EURUSD pair moves above the 1.1280 level, buyers may test the 1.1300 and 1.1335 resistance levels.
GBPUSD UK Wage And Jobs Data In Focus
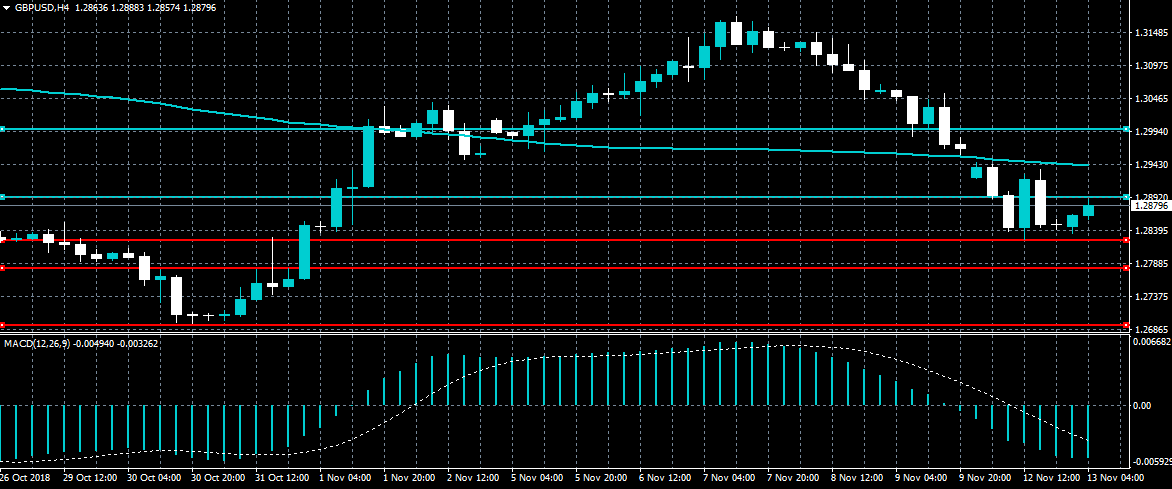
The British pound continues to trade below the 1.2900 level against the US dollar, despite a strong technical rebound from the 1.2826 level on Monday. The next large directional move from the GBPUSD pair will likely be driven by the release of key UK Wage and Jobs data later this morning. The intraday sentiment surrounding the GBPUSD pair remains bearish while price trades below the 1.2955 level.
The GBPUSD pair is strongly bearish while trading below the 1.2955 level, key technical support is now found at the 1.2826 and 1.2785 levels.
If the GBPUSD pair trades above the 1.2892 level, buyers may target the 1.2935 and 1.2955 resistance levels.
US Equites Decline Sharply As Investors Become Concerned About Apple
US equities declined sharply yesterday, erasing gains made last week. This was attributed mostly to Apple, which declined by more than 5%. Investors were concerned that the company’s growth had peaked. There were also other worries about Goldman Sachs and General Electric. Goldman suffered the biggest decline since 2011 after Malaysia said that it will ask for a refund worth more than $600 million from the company. Today, declines in the US will likely spread in Europe. The Stoxx futures are pointing to a lower open.
Yesterday, sterling dropped sharply as traders continued to fret about Brexit. Today, traders will continue to focus on any news relating to Brexit as time runs out for Theresa May. There are concerns that even if a deal is made with the EU, the Prime Minister will not be able to marshal the support of her party, with a good number of her Conservative members remaining opposed to the Chequers plan. Today, traders will also focus on employment numbers from the UK. Wages plus bonus are expected to rise by 3%.
The euro continued the declines started yesterday and reached an intraday low of 1.1212. This was the lowest level since June last year and followed investor concerns about the European Union economy, Italy, and Brexit.
EUR/USD
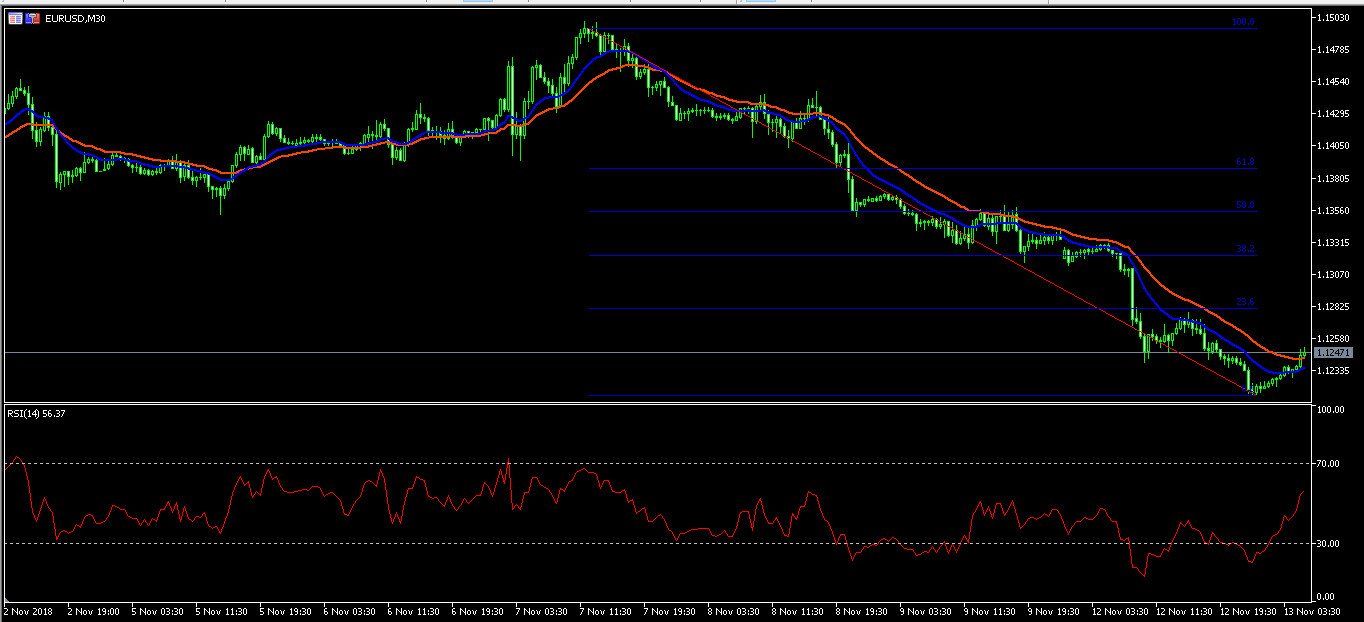
The EUR/USD pair is trading at 1.1250 at the time of writing, which is higher than the intraday low of 1.1212. On the 30-minute chart, the 15-day EMA appears to be crossing the longer 30-day EMA. If the crossover happens, it is an indication that the pair could continue moving higher in the short term. The upward trend is confirmed by the Relative Strength Index (RSI), which is currently at 57 and rising. If the trend continues, it will likely reach the important resistance level of 1.1280, which is the 23.6% Fibonacci Retracement level.
GBP/USD
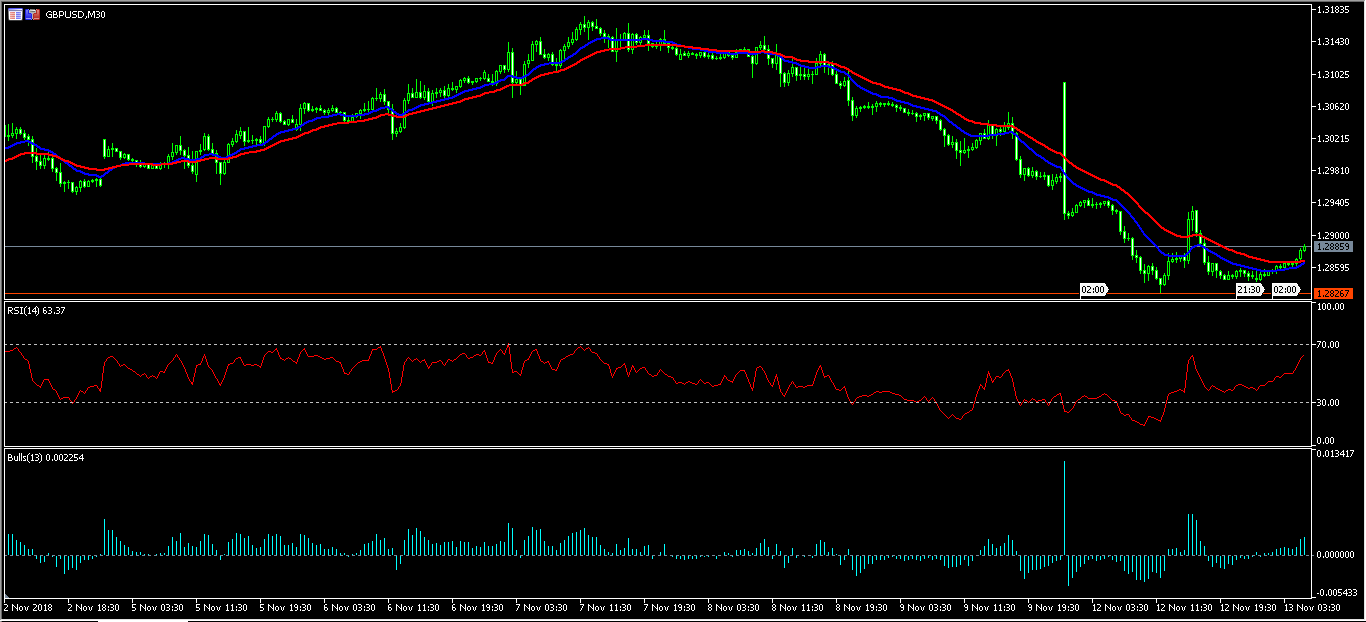
The GBP/USD pair moved up slightly to an intraday high of 1.2880. On the 30-minute chart, the pair’s 15-day EMA is crossing the 30-day EMA, which is a bullish signal. The RSI is at 63 and moving up, which is a bullish signal while the Bull’s Power indicator is rising too. The pair is likely to continue moving up in the short term and is likely to reach 1.2900, which is an important resistance level. However, this upward movement could be short-lived.
XTI/USD
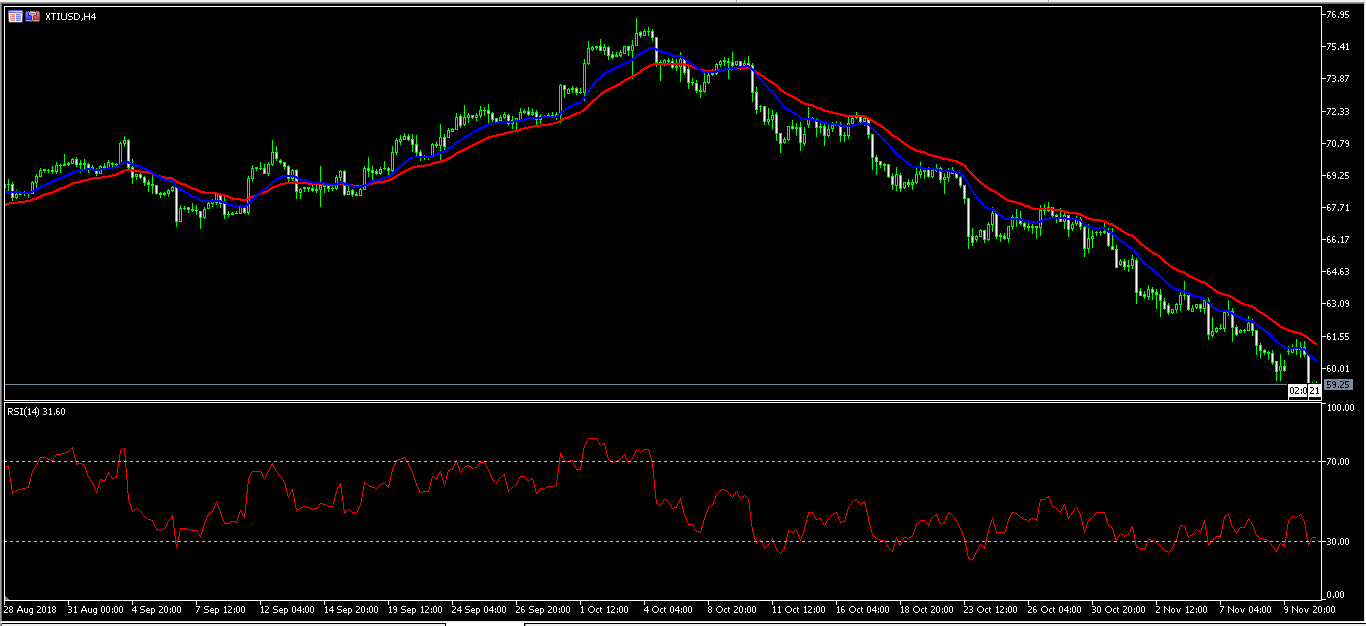
Crude oil resumed the declines after the US President added pressure to Saudi Arabia and OPEC about supply cuts. This is after Saudi Arabia emerged as a key supporter of supply cuts with the aim of reducing the probability of oversupplies in 2019. WTI crude declined to an intraday low of $58.75. This was the lowest level since February this year. On the four-hour chart, the XTI/USD pair’s double EMA continue to show that the downward trend will continue. Today, the main focus in the oil market will be the OPEC monthly report, which will be released at 11:20 GMT.
GBPUSD Falls Below 1.29, Could Attempt To Erase Losses
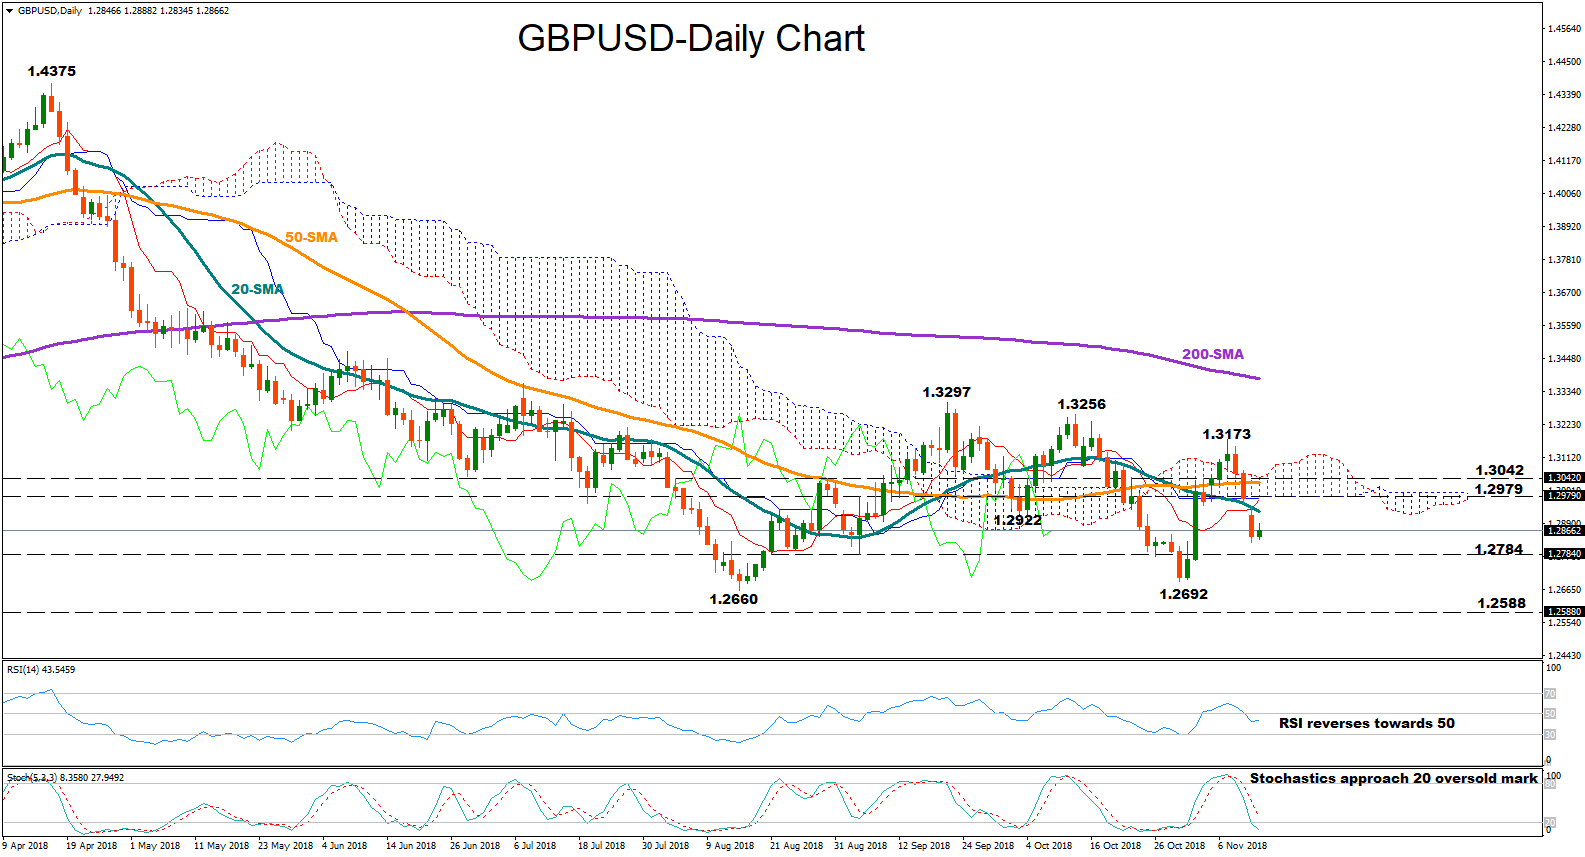
GBPUSD declined back below the Ichimoku cloud and the 1.2900 key level on Monday, erasing part of its recent strong rebound. Momentum indicators, however, signal that the market may attempt to retrace its losses in the short-term as the Stochastics are on track to create a bullish cross in the oversold territory, below 20, while the RSI looks to be changing direction to the upside and towards its 50 neutral mark. Yet, as long as the RSI holds below 50, negative corrections cannot be ruled out
A bounce up could see immediate resistance between 1.2922 and 1.2979 identified by the low on October 4 and the bottom of the Ichimoku cloud. Slightly higher, the area around 1.3042 which restricted both upside and downside movements in the past could stand as a barrier, while if this fails to hold, bullish actions may then try to overcome the previous peak at 1.3173.
On the downside, the focus will shift to 1.2784, a previous support region, before the 1.2692 trough comes under the radar. A decisive close lower and more importantly below the August 15’s low of 1.2660 may open the way towards 1.2580 where the pair registered a significant rebound on June 2017.
Looking at the medium-term picture, GBPUSD maintains a neutral outlook over the past three months, ranging between 1.2660 and 1.3297. Any violation of these boundaries would adjust the market sentiment accordingly; a leg above 1.3297 would bring the bullish picture back into play, while a step below 1.2660 would resume the long-term bearish phase off 1.4375.
EUR/JPY Daily Outlook
Daily Pivots: (S1) 127.16; (P) 128.18; (R1) 128.71; More....
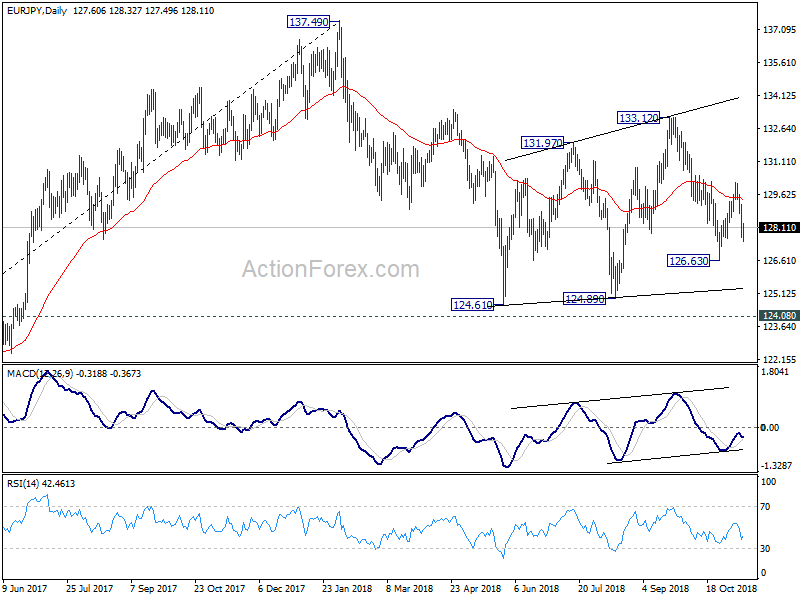
Intraday bias in EUR/JPY remains on the downside as this point. Rebound from 126.63 has completed at 130.14. Deeper fall should be see back to 124.61/89 support zone. On the upside, break of 130.14 resistance is now needed to confirm rise resumption. Otherwise, near term outlook will stay cautiously bearish in case of recovery.
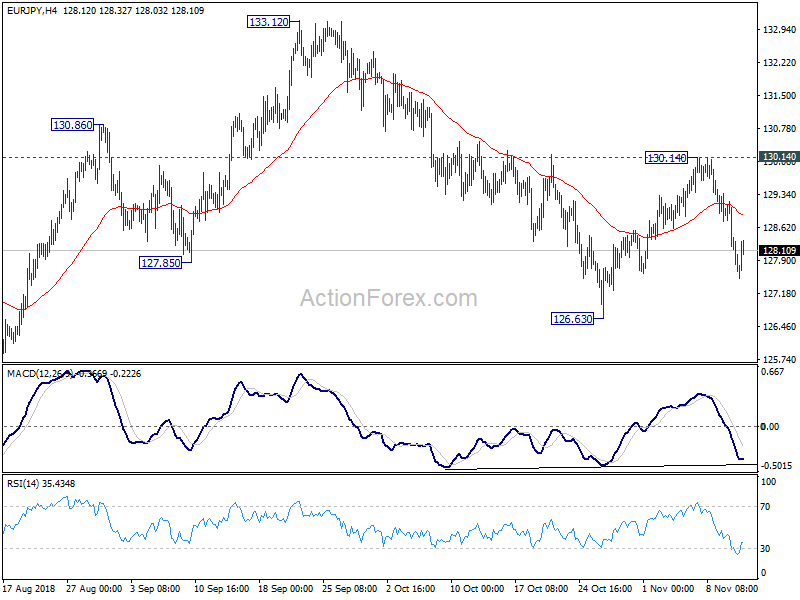
In the bigger picture, as long as 124.08 key resistance turn supported holds, larger up trend from 109.03 (2016 low) is still in progress. Firm break of 137.49 structural resistance will target 141.04/149.76 resistance zone next. However, decisive break of 124.08 will argue that such rise from 109.03 has completed and turn outlook bearish. In that case, deeper fall would be seen to 61.8% retracement of 109.03 to 137.49 at 119.90.
GBP/JPY Daily Outlook
Daily Pivots: (S1) 145.68; (P) 146.66; (R1) 147.25; More...
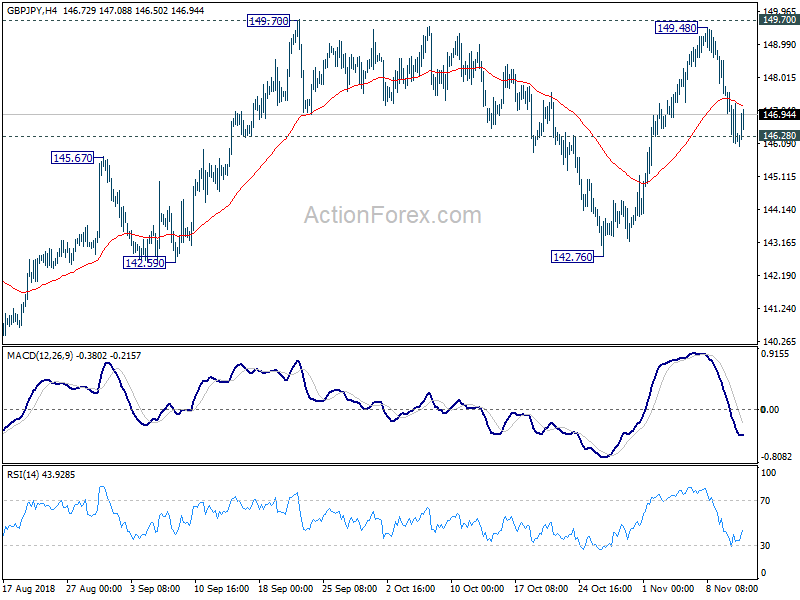
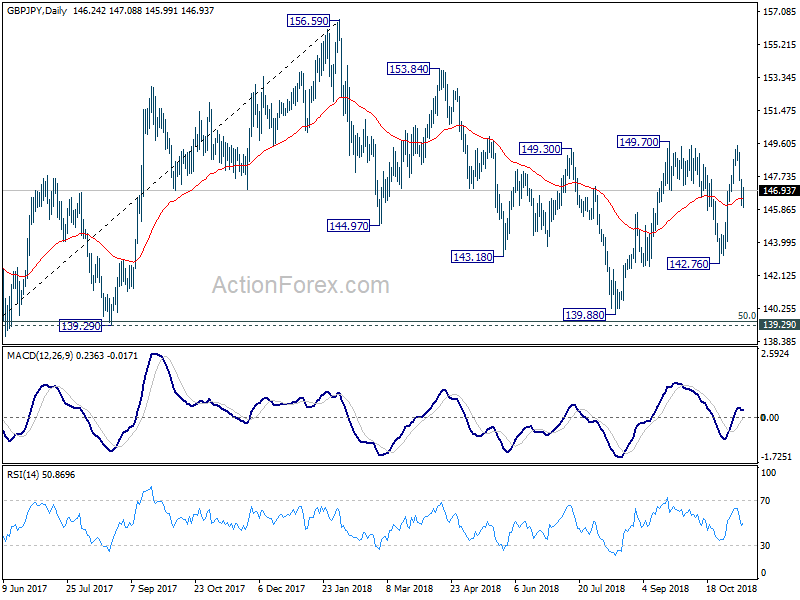
Despite breaching 146.28 briefly, GBP/JPY quickly recovered. Intraday bias stays neutral first. On the downside, sustained break of 146.28 will confirm completion of rebound from 142.76. And in that case, deeper fall should be seen back to 142.76 and possibly below. On the upside, decisive break of 149.70 will resume whole rise from 139.88 and target 153.84/156.59 resistance zone.
In the bigger picture, as long as 139.29 cluster support (50% retracement of 122.36 to 156.59 at 139.47) holds, up trend from 122.36 (2016 low) would still extend beyond 156.69 high. However, decisive break of 139.29/47 will suggest that such up trend is completed and turn outlook bearish. In that case, next target is 61.8% retracement at 135.43.
DAX 30 Bearish Breakout Starts Impulsive Wave C
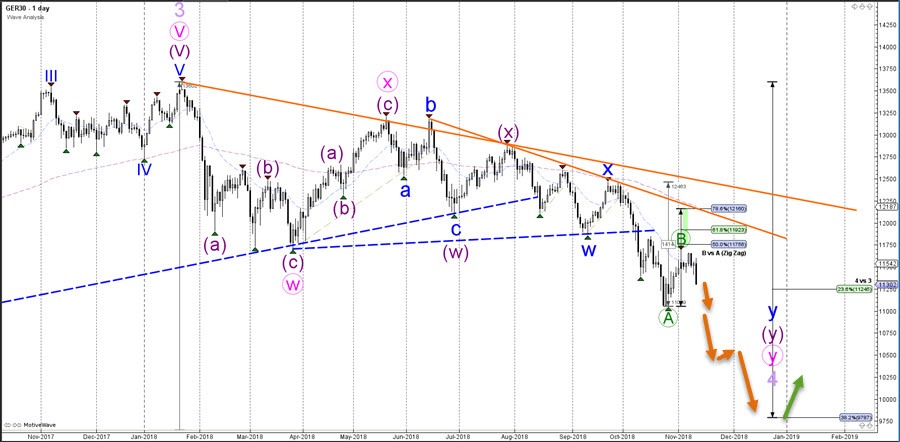
The German stock index DAX 30 is showing another bearish breakout as the downtrend continues full force. Price competed a bullish ABC (orange) zigzag pattern as part of a waveB (green) and now seems ready for a bearish decline in wave C (green).
The DAX 30 is expected to fall towards the 38.2% Fibonacci retracement level of wave C vs A at around 10,000. The bearish zigzag could complete a larger bearish correction as part of a wave 4 (purple)
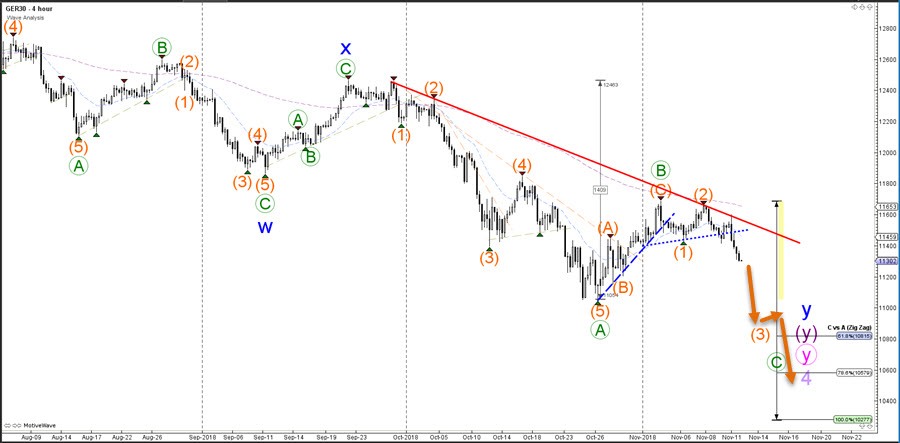
The DAX 30 seems to be building a large WXY (pink) correction within a wave 4 (purple). The 38.2% Fibonacci level is a key support zone as a bounce could confirm the wave 4 and the potential for a new uptrend and one more wave 5. A bearish break however could indicate a larger reversal and downtrend.
Have iPhone Sales Become The Modern Indicator For Global Economic Growth?
The recovery in U.S. stocks from October's slump evaporated on Monday with the Dow Jones Industrial Average falling more than 600 points, while the Nasdaq Composite and S&P 500 declined 2.78% and 1.97% respectively. Apple led the sharp selloff after Lumentum Holdings, a key supplier to Apple's iPhone, said one of its largest customers asked to reduce material shipments for previously placed orders. Although Lumentum, the optical equipment maker did not name the firm, investors jumped to the conclusion that Apple is the company which requested to reduce its shipments, supporting views that iPhone sales are beginning to experience a declining trend.
Such news should have only affected specific businesses and sectors, but instead, 414 out of the 504 companies on the S&P 500 declined on Monday, with only the defensive sectors managing to end the day in green. Markets in Asia followed Wall Street benchmarks lower today with Japan's Topix and Nikkei leading the decliners tumbling more than 2%.
The iPhone is just a little device that costs a lot and contributes a significant chunk to U.S. GDP growth. However, when looking from a global perspective, mobile technology and services are estimated to have added $3.6 trillion or 4.5% to 2017 global GDP according to the IMF. China exported $128 billion worth of smartphones representing 5.7% of its total exports. Meanwhile in Korea, semiconductors alone accounted for 17.1% of total exports. In Ireland where Apple's European operations are headquartered, iPhone exports are said to have amounted to a quarter of the country's economic growth. That's what makes the iPhone and other smartphone sales a vital indicator of global economic growth.
Adding to market anxieties are reports that the White House is circulating a draft on Auto Tariffs. This comes at a time when investors are already struggling with the U.S.-China trade tensions, Italy's problems and Brexit talks. Given all these uncertainties, bears may continue to control the market's direction for some time until positive news begin to flow.
In commodity markets, Brent Crude fell below $70 today after testing $71.88 yesterday. The fall in prices comes despite OPEC agreeing on the need to cut Oil supply by around 1 million barrels per day from October's level to prevent oversupplying the market. However, it seems -increasing supplies in the U.S., rising global inventories, and threats of a worldwide economic slowdown are having more influence on prices. Trump's Tweet on Monday, "Hopefully, Saudi Arabia and OPEC will not be cutting Oil production. Oil prices should be much lower based on supply!" also helped drag prices lower.
The Dollar declined slightly early Tuesday but remained close to its 16-months high reached yesterday. Unless the economy experiences significant deterioration in the following weeks and months, there's no valid justification for the Fed to end or slow down it's tightening cycle. For this reason, the Dollar may continue marching higher, especially if spread differentials between the U.S. and E.U. widen further.
USD/CAD Daily Outlook
Daily Pivots: (S1) 1.3204; (P) 1.3227; (R1) 1.3273; More...
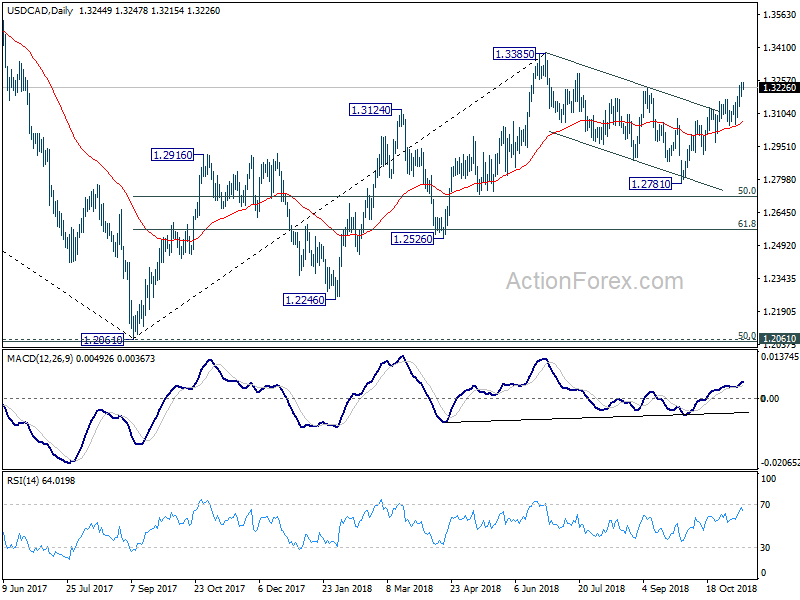
Intraday bias in USD/CAD remains on the upside at this point. Sustained trading above 1.3225 will confirm completion of choppy fall from 1.3385. Further rally should then be seen to retest 1.3385 high. On the downside, break of 1.3056 support is needed to indicate short term reversal. Otherwise, outlook will remain bullish in case of retreat.
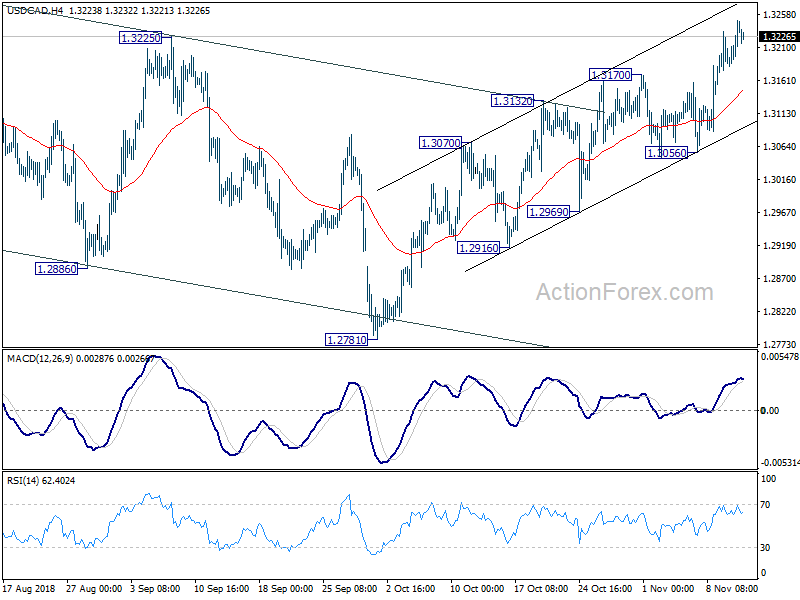
In the bigger picture, current development revives the case that corrective fall from 1.3385 has completed at 1.2781 already. And whole up trend from 1.2061 (2016 low) is ready to resume. Break of 1.3385 will target 61.8% retracement of 1.4689 (2016 high) to 1.2061 at 1.3685. This will now be the favored case as long as 1.2781 support holds.