Sample Category Title
NZD/USD Analysis: Brief Retracement Expected
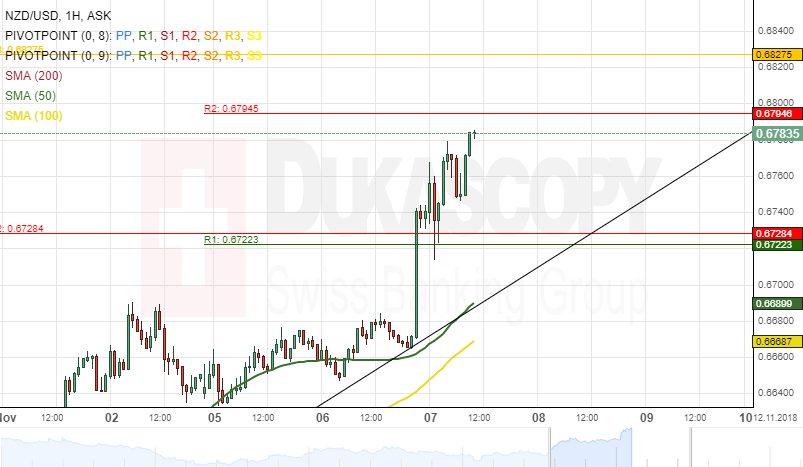
The New Zealand Dollar surged by 120 base points against the US Dollar on Tuesday. The currency pair breached a resistance cluster formed by the combination of the weekly and the monthly PPs near the 0.6728 region during the end of yesterday's trading session.
Given that the currency exchange rate has breached the resistance level as mentioned above, the next target for the pair will be at the weekly R2 at 0.6794 within this session.
However, it is expected that the NZD/USD exchange rate makes a brief retracement towards a support level ay 0.6728 today.
EUR/USD Eyeing Upside Break, USD/CHF Extended Slides
EUR/USD recovered recently and traded above the 1.1420 resistance. USD/CHF is currently under pressure and it could continue to move down towards 0.9990 or 0.9970.
Important Takeaways for EUR/USD and USD/CHF
- The Euro formed a decent support near 1.1360 and recovered recently against the US Dollar.
- There is a major bullish trend line in place with support at 1.1415 on the hourly chart of EUR/USD.
- USD/CHF is currently following a key bearish trend line with resistance at 1.0035 on the hourly chart.
- The pair may continue to decline towards the 0.9990 or 0.9970 support level.
EUR/USD Technical Analysis
The Euro found a strong support near the 1.1300-1.1310 zone this week against the US Dollar. The EUR/USD pair started an upward move and recovered above 1.1360 and 1.1400.
The recent recovered was convincing as there was a close above the 1.1360 resistance and the 50 hourly simple moving average. An intermediate swing low was formed at 1.1353 before the pair rallied above 1.1400.
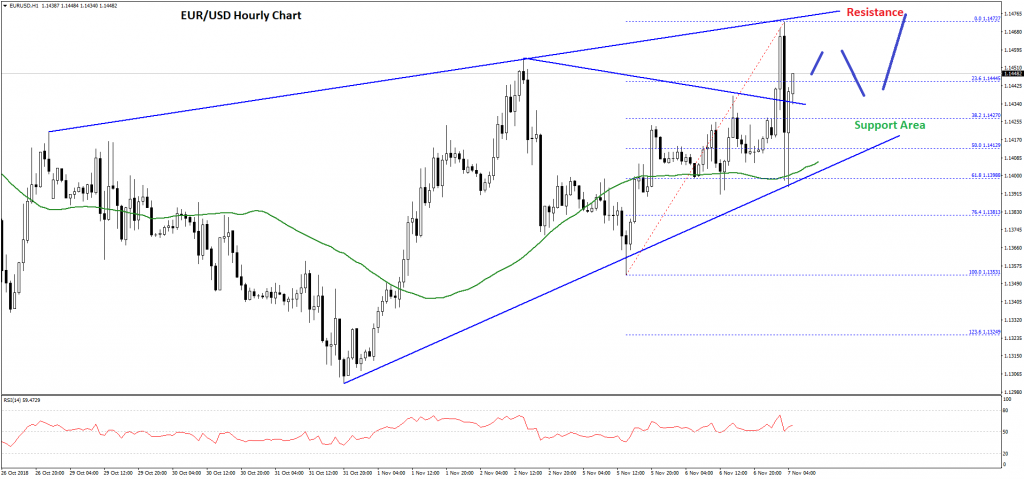
The pair recently traded as high as 1.1472 where sellers emerged, resulting in a sharp downside correction. Sellers pushed the pair below the 1.1420 level and the 50% Fib retracement level of the last wave from the 1.1353 low to 1.1472 high.
However, losses were contained near the 1.1400 handle and the 50 hourly simple moving average. Moreover, the 61.8% Fib retracement level of the last wave from the 1.1353 low to 1.1472 high also acted as a strong support.
Finally, there is a major bullish trend line in place with support at 1.1415 on the hourly chart, which is another strong support for buyers. Therefore, the pair may bounce back and it could soon break the 1.1472 swing high in the near term.
The next key resistance for buyers in near the 1.1500 zone, above which the pair may trade towards 1.1540. On the downside, the 1.1420 level is a solid support followed by the 1.1400 handle and the 50 hourly SMA.
USD/CHF Technical Analysis
The US Dollar started a bearish wave from the 1.0095 swing high against the Swiss franc. The USD/CHF pair declined and broke the 1.0050 and 1.0000 support levels.
The pair traded as low as 0.9969 and later recovered above 1.0040. However, the upside move was capped by the 1.0070 level and a key bearish trend line with current resistance at 1.0035 on the hourly chart.
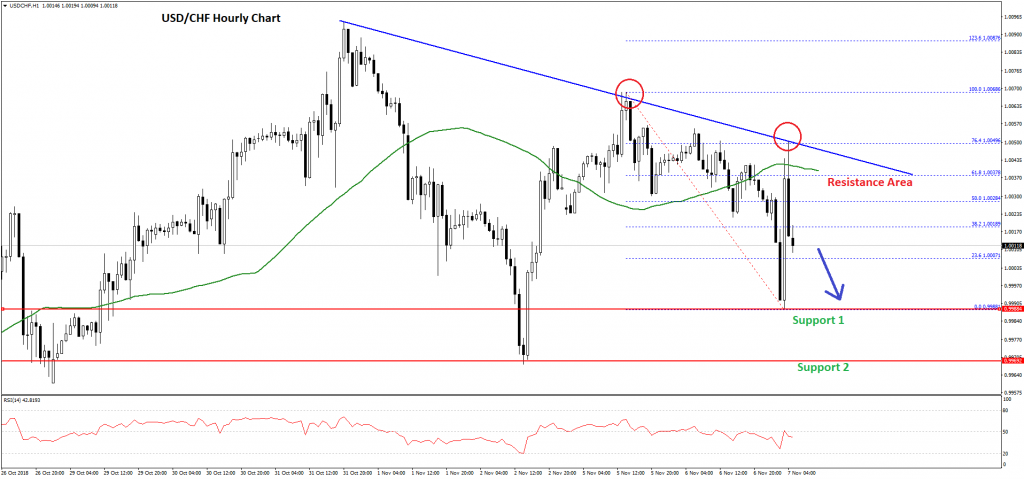
The pair was rejected, resulting in a fresh drop below 1.0020 and the 50 hourly simple moving average. Recently, the pair recovered above the 1.0010 level and the 50% Fib retracement level of the last decline from the 1.0068 high to 0.9988 low.
However, the same bearish trend line prevented gains along with the 50 hourly SMA. Besides, the 76.4% Fib retracement level of the last decline from the 1.0068 high to 0.9988 low also acted as a hurdle for buyers.
The pair is currently declining and it is trading near the 1.0000 support. It seems like sellers are in control and the pair may continue to move down towards the 0.9990 or 0.9970 support level.
On the other hand, if there is an upside correction, the pair could find a solid resistance near 1.0035 and the 50 hourly SMA. To move into a bullish zone, buyers need to push the pair above the 1.0050 resistance zone in the near term.
EURUSD Analysis: Surges To 50.00% Fibo
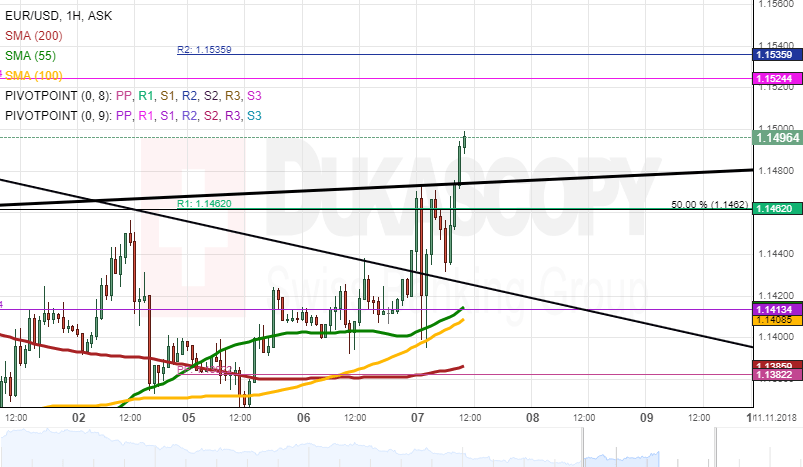
During Tuesday's trading session, the currency pair broke the resistance of the upper boundary of the small pattern line to end the trading day at the 1.1431 mark. During Wednesday morning hours, the European Single Currency was located near the 50.00 % the weekly R1 to trade at the 1.1456 mark.
In regards to the near-term future, most likely, the currency exchange rate will be retraced by the bottom boundary of the medium ascending pattern line at 1.1480 to pass through the monthly pivot point at the 1.1413 mark.
However, the rate could break the resistance of the medium pattern line at 1.1480 due to the support of the SMAs to push the rate to trade at the 1.1500 level.
GBPUSD Analysis: Trades Above Monthly R1 At 1.3117
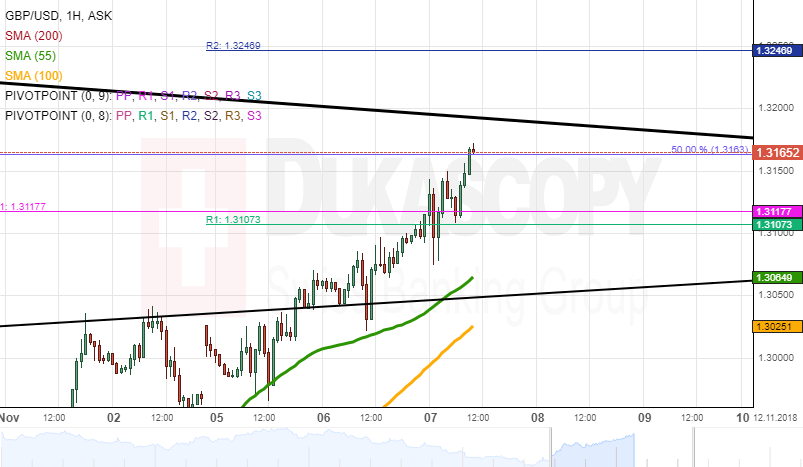
During Tuesday's trading session, the British Pound broke the resistance of the medium ascending pattern line to end the trading session at the 1.3105 mark. On Wednesday morning, the British pound was located between the 50.00% Fibo and the monthly R1 to trade at the 1.3143 mark.
In regards to the near-term future, most likely, the British Pound will get resisted by the dominant pattern line at 1.3160 mark. It is expected that the rate will be trading at the 1.3120 level during the trading session on Wednesday.
On the other side, the 50.00% Fibo at 1.3163 mark could support the rate to break the resistance of the dominant pattern line at the 1.3160 mark to trade at the 1.3200 level during the day.
USDJPY Analysis: Resisted By 55-Hour SMA
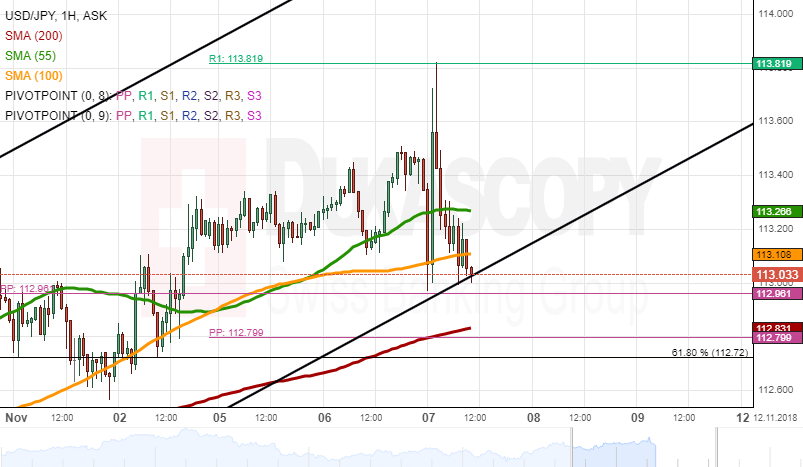
During Tuesday's trading session, the currency exchange pair passed through the medium ascending pattern line to end the trading session at the 112.97 mark. On Wednesday morning, the US Dollar reached the resistance of the weekly R1 at 113.81 but was retraced to the 113.15 mark.
In regards to the near-term future, most likely, the US Dollar will be supported by the 100-hour SMA to break the resistance of the 55-hour SMA at 113.27 to surge upwards towards the 113.40 level during Wednesday's trading session.
On the other side, the 55-hour SMA could resist the currency exchange pair to decline the rate to trade near the monthly pivot point at 112.96 mark.
EUR/JPY Analysis: Breaches Weekly R1 At 129.76
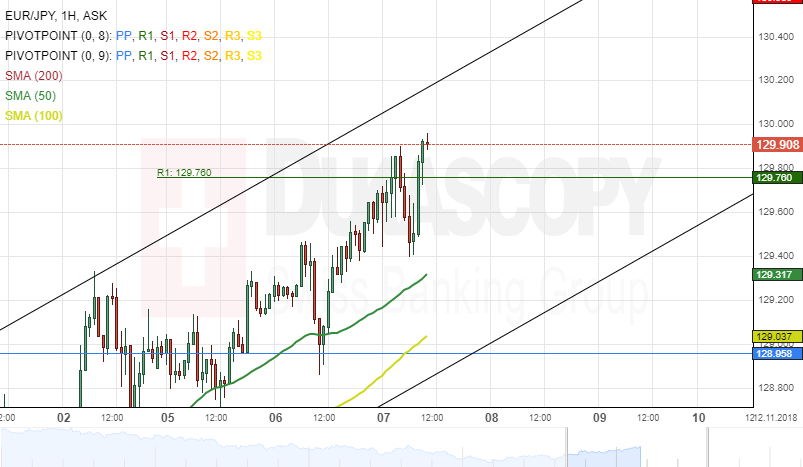
The common European currency appreciated about 90 base points against the Japanese Yen on Tuesday. This appreciation was temporary stopped by the weekly R1 at 129.76.
However, the exchange rate breached the weekly resistance level at 129.76 during the Asian session on Wednesday.
Given that the three SMAs is below the price level, it is likely that the EUR/JPY currency exchange rate continues its upside movement during the following trading session.
The potential target for the pair could be a swing high of 130.18 within this trading day.
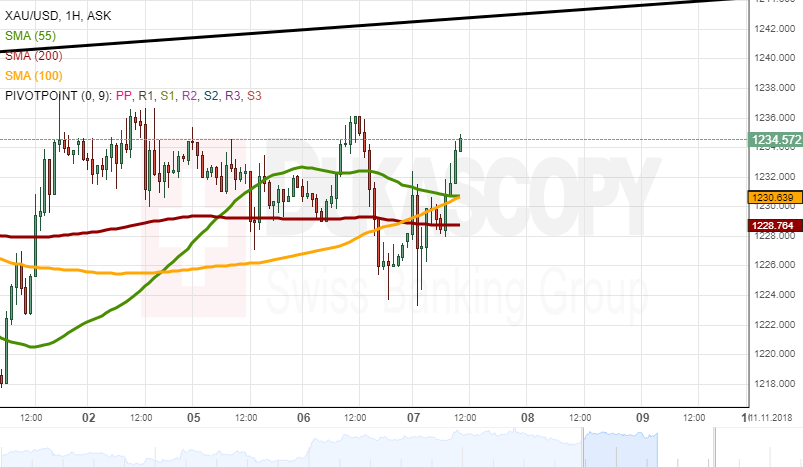
XAUUSD Analysis: Trades At 1,230.00
During Tuesday's trading session, the yellow metal was supported by the 200-hour simple moving average to end the trading day at the 1,230.28 mark. On Wednesday morning, the gold was supported by the 55-hour and the 100-hour simple moving averages to trade at the 1,231.93 mark.
In regards to the near-term future, most likely, the gold will keep trading sideways to trade at the 1,235.00 level during the day. The 200-hour simple moving average should support the rate from a decline during Wednesday's trading session.
However, the yellow metal could depreciate during today's US Crude Oil Inventories data release at 15:30 GMT to trade at the 1,225.00 level.
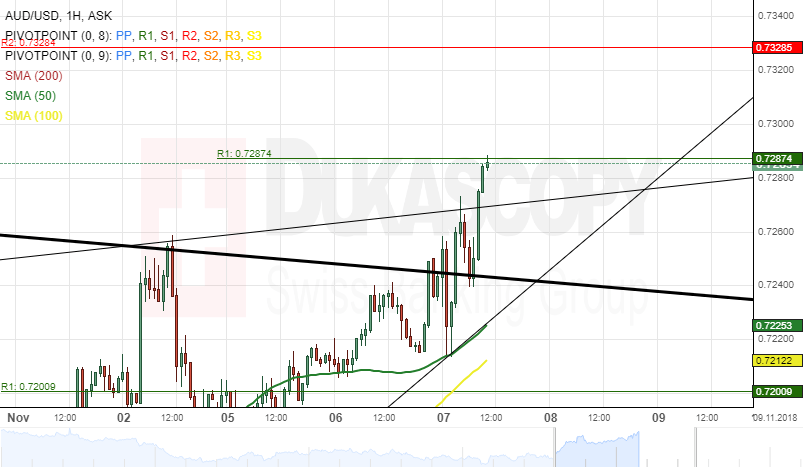
AUD/USD Analysis: Faces Resistance Level
The Australian Dollar appreciated about 50 base points against the US Dollar on Tuesday. The currency pair breached the upper boundary of a dominant descending channel at 0.7250 during the end of the previous trading session.
Today's session begins with a bullish momentum, and by the middle of the European trading session, the exchange rate has also breached the upper border of an ascending triangle pattern at 0.7272.
Everything being equal, it is likely that the bullish traders could push the currency exchange rate towards the weekly R2 at 0.7328.
However, it is important to note that the weekly resistance level at 0.7287 could hinder that surge from happening today.
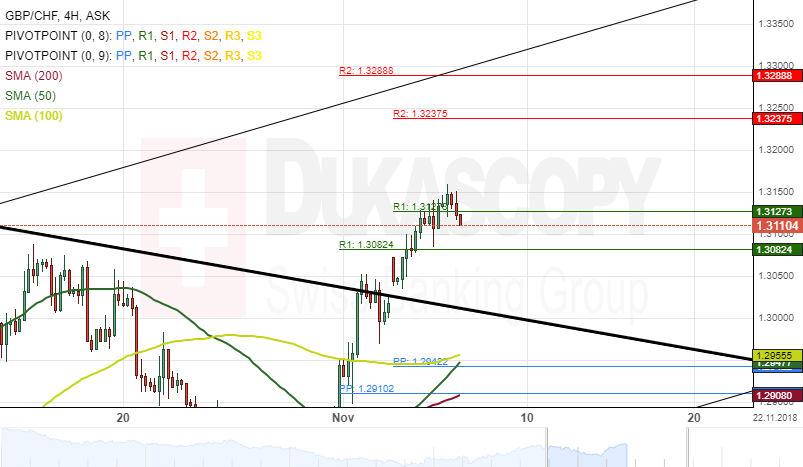
GBP/CHF 4H Chart: Decline In Sight
The British Pound has increased its trading range significantly against the Swiss Franc. This movement has been bounced by a two-month ascending channel pattern.
The exchange rate breached a long-term descending channel a few days ago, and by the Asian session on Wednesday, the pair had reached a four-month high mark at 1.3150. his wave pushed the currency pair towards the overbought zone.
By and large, it is likely that bearish sentiment could drive the GBP/CHF currency exchange rate towards a support cluster formed by the weekly PP and the 100-hour simple moving average at 1.2952 during significant following trading sessions.
CAD/CHF 4H Chart: Possible Breakout
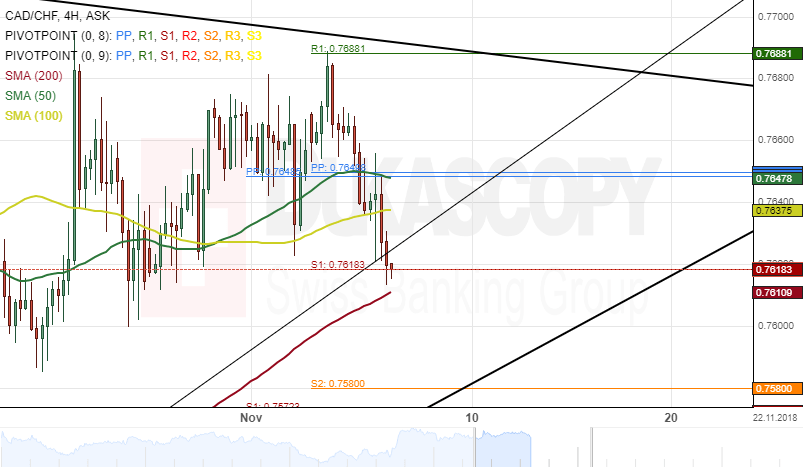
The Canadian Dollar is trading in an ascending triangle pattern against the Swiss Franc. The currency pair bounced off its lower boundary at 0.7320 on September 8 and reached the upper border a few days ago.
Currently, the exchange rate is trading near the bottom border of the triangle pattern at 0.7629 and could be set for a breakout.
If this breakout occurs, the CAD/CHF currency pair could aim at a support cluster formed by the combination of the weekly and the monthly PPs near the 0.7580 during the coming trading sessions.
However, it is important to note that the 200-hour SMA at 0.7609 could provide support for the currency exchange rate from falling.