Sample Category Title
What Are the Best Strategies for Short-Term Forex Trading?
Short-term trading can be very profitable. However, it is also connected with high risk. Such kind of trading attracts traders with the possibility of quick money. Unlike medium-term and long-term trading, short-term trading focuses mainly on fast decisions to buy or sell. In this article JustForex team evaluates all nuances of this type of trading activity.
While short-term trading, orders are opened in a short period, from several minutes to several days. Traders make a profit by conducting trades on lower timeframes. Short-term trading usually takes place during the most volatile periods. Trades are mainly driven by technical analysis. At the same time, you should never forget about fundamental analysis.
The following styles can be referred to short-term trading:
- Scalping - this method is considered to be the most aggressive. Scalpers earn on short price movements, the duration of the transaction ranges from a few seconds to minutes. They mainly trade on M1 to M15 timeframes and execute up to several dozens and even hundreds of orders per trading session.
- Day trading - this method is used by traders who prefer trading within one day and hold a position for up to several hours. Day traders choose charts of M5 to H1 timeframes. Day trading is less risky and stressful compared to scalping. Profit is usually fixed at the end of the day.
To use scalping and day trading, it is necessary to have time in order to spend in front of the computer all day long. Short-term trading, as a rule, requires increased attention and a high tolerance for stress.
Short-term forex strategies
There are several forex strategies which are used for profitable short-term trading. Let’s consider the most popular.
1 - Support and Resistance
First, you need to determine the support and resistance levels on higher timeframes (M30-H1). At such intervals, significant support or resistance levels are formed. Therefore, you should identify such levels the first. Then it is necessary to switch to lower timeframes (M5-M15). Trading is conducted either on the breakdown of these levels or on a rebound from them.
The breakdown of the channel, resistance or support lines is a good option of trading signal. It is useful to stick to this strategy, especially for traders who are just starting trading.
2 - Moving Averages
Moving Averages is one of the frequently used technical indicators in the Forex market. MAs are indicators that help to forecast the direction of price movement, as well as determine dynamic support and resistance levels. Moving averages are referred to trend indicators: if prices are above the MA, the prices follow a bullish trend and vice versa.
Simple Moving Average (SMA) and Exponential Moving Average (EMA) are the main types of MA. The SMA is formed by calculating the average price for a certain period. It allows traders to confirm the trend. Compared to the Moving Average, EMA has a smaller lag effect and reveals a trend more likely.
For trading on short-term trends, JustForex team recommends using short curves. Forex traders often use a moving average crossover system to enter trades. It is formed with a slow MA and a fast MA. When the slow MA breaks above the long one, prices are likely to reverse and increase.
Experts also recommend using moving averages when there is a pronounced trend in the market.
3 - Moving Average Convergence Divergence (MACD)
The MACD indicator is an oscillator that allows traders to identify trends and to look for signals. Two moving averages and histogram forms it. MACD calculates the difference between fast and slow moving averages.
If the histogram crosses the zero level, it is necessary to consider a signal to enter the market. The MACD indicator gives a sell signal when it crosses the zero level from top to bottom.
4 - Candlestick Patterns
Traders look for reversal candlestick patterns and enter the market in the direction indicated by a particular candlestick pattern. The signal appears when the price breaks through the level of the candlestick pattern. Every trade should be protected by stop loss. The following technical analysis and Price Action patterns are the most popular among traders: Triangle, Flag, Pennant, Double Top/Bottom, Inside Bar, Outside Bar, Pin Bar, and others.
Conclusion
To succeed in short-term trading, the trader should adhere to money management rules. Short-term trading is associated with risk, so don’t forget to use stop losses.
RBNZ Interest Rate Decision
RBNZ is to release its interest rate decision in the American session (20:00, GMT) today and is widely expected to remain on hold at +1.75%. Currently NZD OIS imply a probability of 98.45% for the bank to remain on hold and the bank’s past guidance also supports such a notion. Market focus could turn to the accompanying statement and following press conference (21:00, GMT), if RBNZ keeps interest rates at the same level. The recent acceleration of the inflation rate for Q3, along with one of the lowest unemployment rates in a number of years, could provide arguments for the existence of more hawkish elements in the accompanying statement. We could see the Kiwi strengthening ahead of RBNZ’s interest rate decision, as expectations were boosted by yesterday’s release of the employment data for Q3 and as the RBNZ has a dual mandate for inflation and unemployment.
NZD/USD rallied yesterday and during today’s Asian session by breaking the 0.6675 (S2), the 0.6725 (S1) resistance levels (now turned to support) and tested the 0.6780 (R1) resistance line. We could see the pair continuing to trade in a bullish market ahead of RBNZ’s interest rate decision, however it should be noted that the RSI indicator in the 4 hour chart has surpassed the reading of 70, implying a rather overcrowded long position. Should the pair find fresh buying orders along its path we could see it breaking the 0.6780 (R1) resistance line and aim for the 0.6825 (R2) resistance hurdle. Should it on the other hand, come under the selling interest of the market, we could see it breaking the 0.6725 (S1) support line and aim for the 0.6675 (S2) support barrier.
Choppy trading for USD upon results of midterms
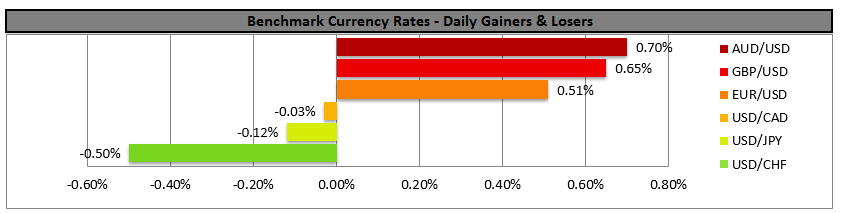
The USD experienced some choppy trading against the EUR and the JPY yesterday as the early results of the midterms pointed to a gridlock in the US Congress. The Democrats are expected to win majority in the House of Representatives while the Republicans seem to keep the seat majority in the Senate. Analysts point out that if Congress is split, it will be difficult for new policies of the US President to pass in order to boost the economy and such a scenario, could prove negative for the US Dollar. Volatility for USD pairs is expected to continue in the aftermath of the elections and ahead of the FOMC interest rate decision on Thursday.
EUR/USD rose during the Asian session, clearly breaking the 1.1430 (S1) resistance line (now turned to support).We could see the pair continuing to trade in a bullish market as the financial releases could favour it, while the aftermath of the US midterm elections may weaken the USD somewhat further. Should the pair’s direction be dictated by the bulls, we could see it breaking the 1.1480 (R1) resistance line and aim for the 1.1520 (R2) resistance level. Should the bears take over, we could see it breaking the 1.1430 (S1) support line and aim for the 1.1385 (S2) support zone.
In today’s other economic highlights:
In the European session today we get Germany’s industrial output growth rate for September, UK’s Halifax house price growth rate for October and Eurozone’s retail sales growth rate for September. In the American session, Canada’s Ivey PMI for October and from the US the EIA weekly crude oil inventories figure will be released. Please be advised that the ECB will be holding a non-monetary meeting today and some comments for Italy’s budget could slip out.
NZD/USD H4
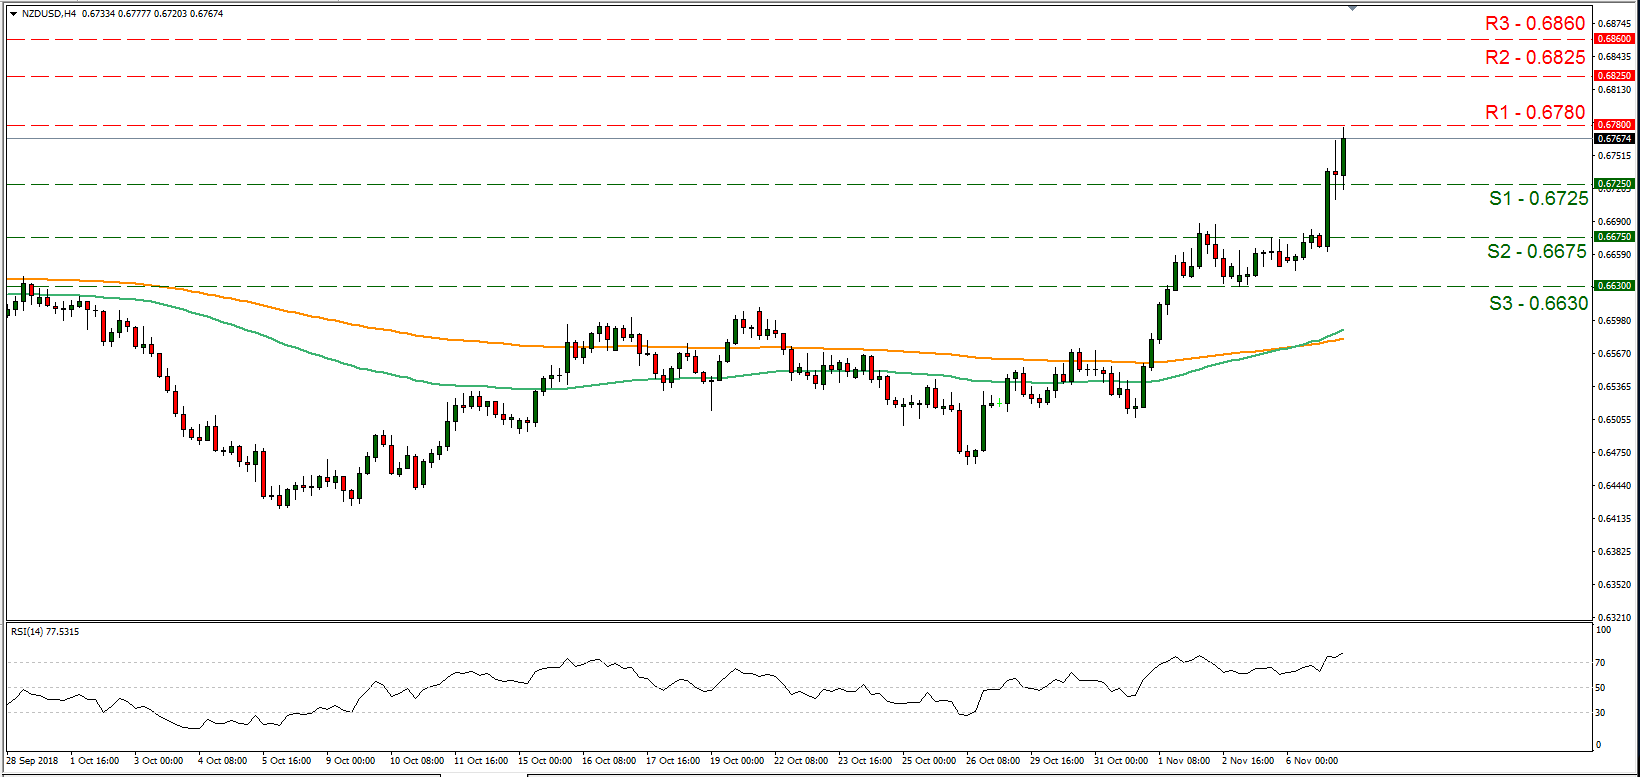
Support: 0.0.6725 (S1), 0.6675 (S2), 0.6630 (S3)
Resistance: 0.6780 (R1), 0.6825 (R2), 0.6860 (R3)
EUR/USD 4H
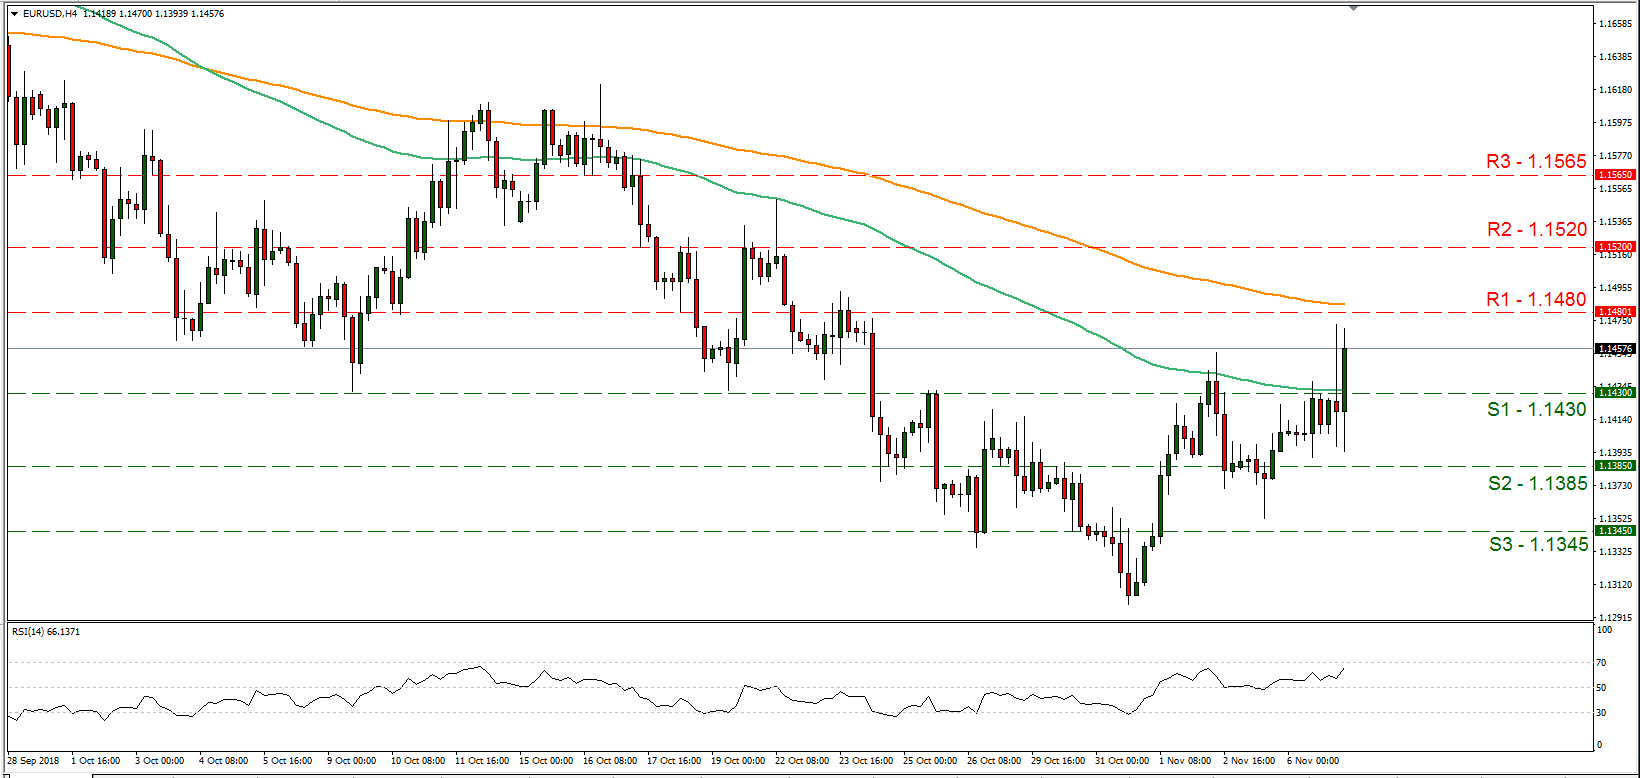
Support: 1.1430 (S1), 1.1385 (S2), 1.1345 (S3)
Resistance: 1.1480 (R1), 1.1520 (R2), 1.1565 (R3)
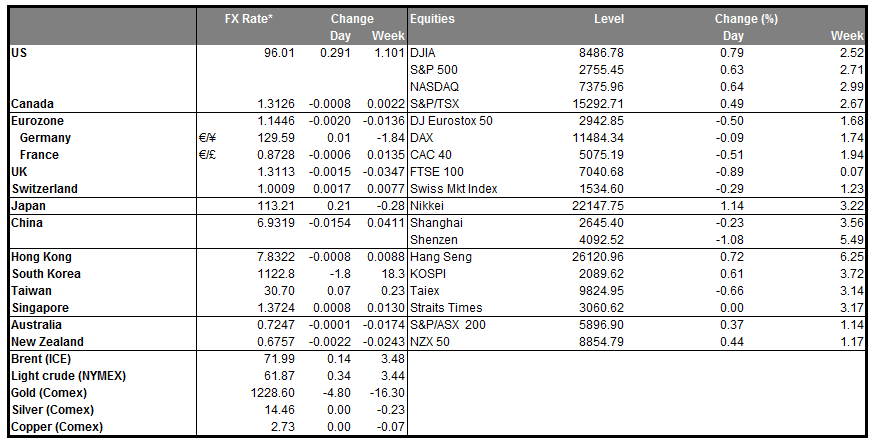
USDJPY Outlook: Pullback From One-Month High Seen As Positioning For Fresh Advance
The pair dipped below 113 handle in early Europe, retesting Asian low in overnight’s roller-coaster ride which started after the announcement of US midterm elections.
The pair spiked to one-month high at 113.81 on acceleration from session low at 112.96, but reversed quickly on rising concerns about US election results which pressure dollar.
Pullback faces strong supports at 112.90 zone (30SMA / daily Kijun-sen / top of rising daily cloud) which is expected to hold and keep bulls intact.
Meanwhile, further easing cannot be ruled out as daily slow stochastic reversed from overbought territory, however, momentum is still firm and suggest limited downside.
Daily close above 112.90 would be positive signal for fresh attempts higher as overnight’s advance cracked barrier at 113.80 (Fibo 76.4% of 114.54/113.37).
The notion is supported by remarks from BoJ official who confirmed that the central bank sticks to its ultra-easy policy, as inflation remains weak despite tight labor market and signs of economic recovery, which could keep yen at the back foot.
Res: 113.33, 113.50, 113.80, 114.10
Sup: 112.88, 112.57, 112.33, 112.12
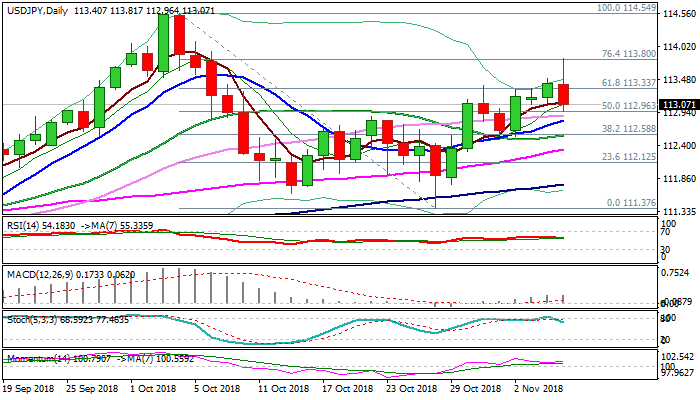
GBPUSD Outlook: Sterling At Three-Week High As Brexit-Optimism And Fresh Dollar’s Weakness Underpin
Cable continues to trend higher, driven by strong Brexit optimism, with additional boost from weaker dollar from US election split.
Sterling hit new three-week high in early European session on Wednesday, in extension of strong rally from 1.2695 (30 Oct low), which generated bullish signal on Tuesday's close above daily cloud.
Impressive near-term performance of British pound which advanced over 3% on strong bullish acceleration from 1.2695 low, could extend further as today's rally broke above barrier at 1.3125 (Fibo 76.4% of 1.3257/1.2695 / weekly 100SMA) and momentum broke into positive territory.
Bulls eye next barrier at 1.3187 (falling weekly 30SMA) where strong headwinds could be expected as daily slow stochastic is strongly overbought and signal that rally may be paused for consolidative / corrective action.
Broken Fibo 61.8% barrier at 1.3043 (reinforced by 5/10SMA bull-cross) is expected to hold dips and keep bulls in play.
Res: 1.3155, 1.3187, 1.3235, 1.3257
Sup: 1.3125, 1.3073, 1.3043, 1.3016
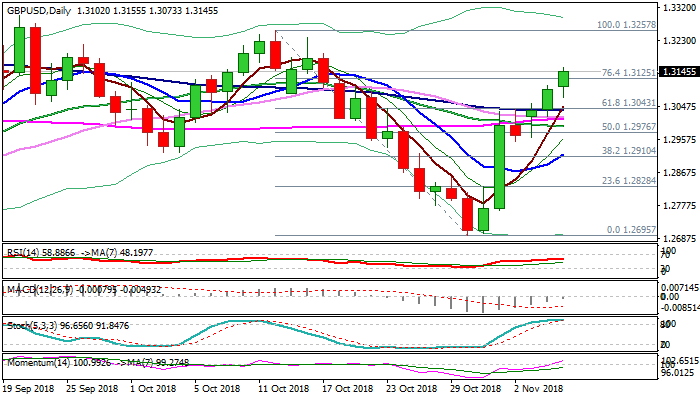
EURUSD Outlook: The Euro Rallies After Split US Election Results Weaken The Greenback
The Euro holds positive tone and probes above upper boundary of overnight's 1.1472/1.1394 range at the beginning of European session on Wednesday, following bumpy ride in Asia on announcement of results of US midterm election.
The single currency could benefit from election split which causes increased uncertainty in the market and could push traders to reduce dollar longs. The US Democratic party won the control of the House of Representatives while Republicans remain majority in the Senate, with split Congress likely to delay or block President Trump's agenda (boosting corporate growth and tax cut for the middle class) that could have negative impact on the greenback.
The Euro hit new two-week high in early European trading, pressuring initial resistance at 1.1479 (falling 30SMA) and focusing at more significant double-Fibo barrier at 1.1498/99 (38.2% of 1.1815/1.1302/61.8% of 1.1621/1.1302).
The pair extends rally from 1.1353 trough into third straight day with sustained break above 1.1498/99 pivots to generate strong bullish signal for extension of recovery phase from 1.1302 (31 Oct low) towards 1.1458 (daily cloud base).
North-heading momentum is entering positive territory on daily chart and supports the advance, with thinning daily cloud also expected to attract. Bulls may show hesitation at 1.1498/99 pivots on overbought conditions but positive sentiment keeps focus at the upside, with corrective dips expected to offer better buying opportunities. North-turning 10SMA marks pivotal support at 1.1390, loss of which would weaken near-term structure.
Res: 1.1479, 1.1499, 1.1545, 1.1558
Sup: 1.1450, 1.1424, 1.1390, 1.1353
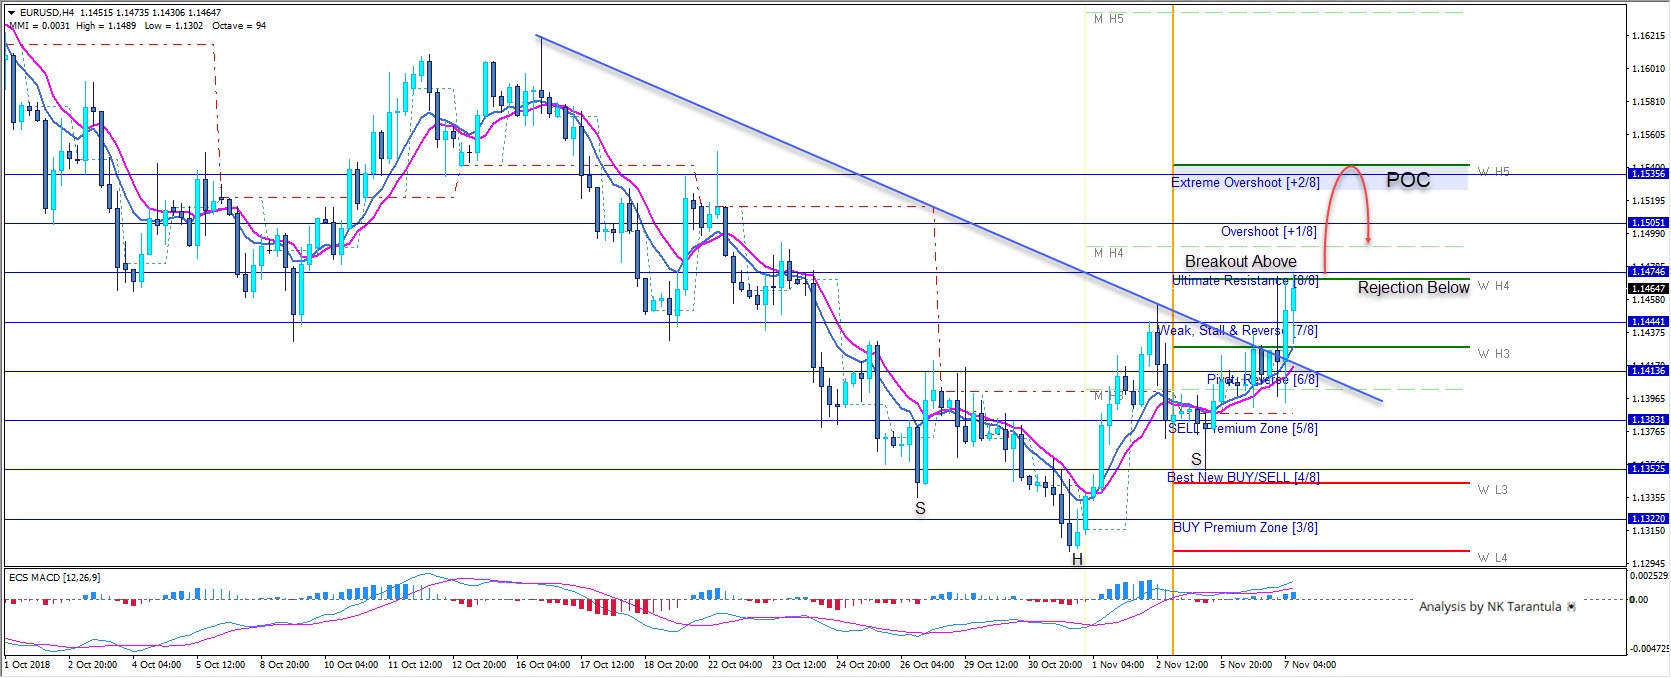
EURUSD Should Reject If 1.1535 Is Reached
The EUR/USD has bounced after breaking out from bullish SHS pattern. At this point its at 0/8 Murrey Math strong resistance which is in confluence with M H4 camarilla pivot.
If the price closes above 1.1474 we should see a continuation towards 1.1505 and 1.1535 zone. W H5 and +2/8 should provide enough resistance for the pair and I think fresh selling or profit taking could happen within 1.1535-50. If that happened we should see a retest of 1.1505 and eventually 1.1474. However, If 1.1474 holds we might see a rejection further towards 1.1430 zone.
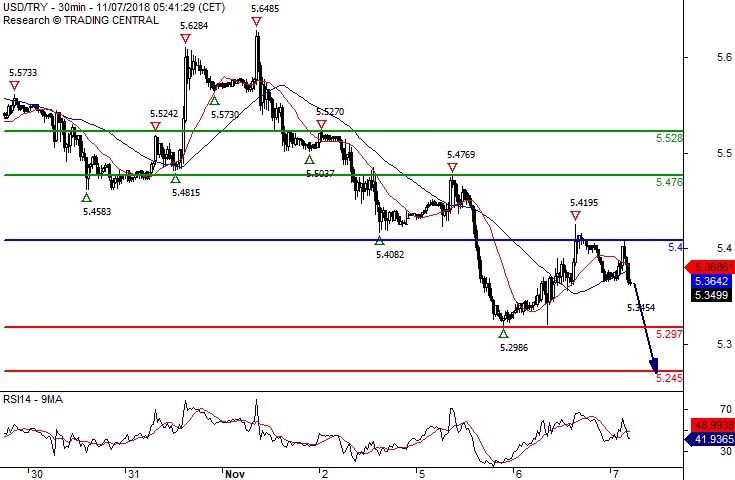
USD/TRY Under Pressure
Pivot (invalidation): 5.4000
Our preference Short positions below 5.4000 with targets at 5.2970 & 5.2450 in extension.
Alternative scenario Above 5.4000 look for further upside with 5.4760 & 5.5280 as targets.
Comment The RSI lacks upward momentum.
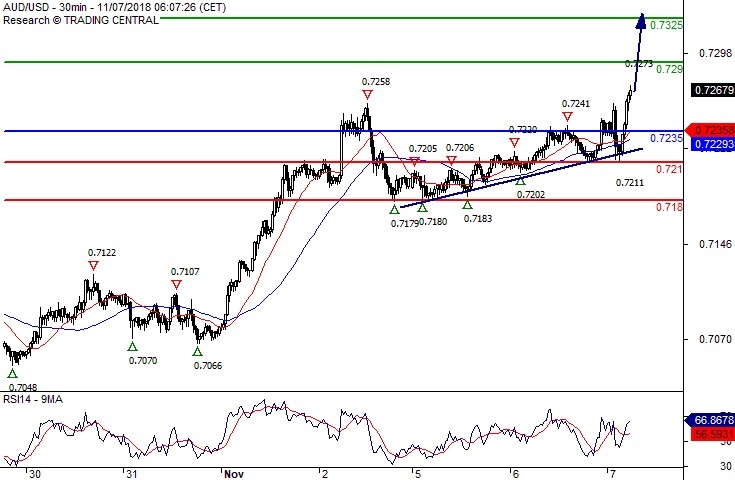
AUD/USD Target 0.7325
Pivot (invalidation): 0.7235
Our preference Long positions above 0.7235 with targets at 0.7290 & 0.7325 in extension.
Alternative scenario Below 0.7235 look for further downside with 0.7210 & 0.7180 as targets
Comment The RSI calls for a new upleg.
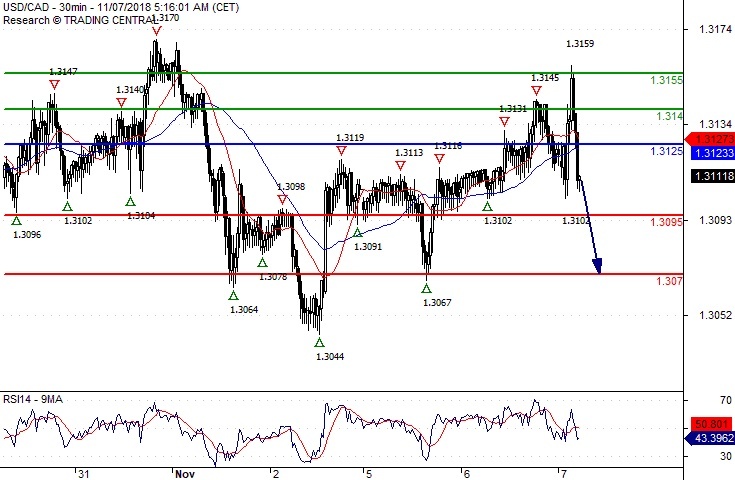
USD/CAD Turning Down
Pivot (invalidation): 1.3125
Our preference Short positions below 1.3125 with targets at 1.3095 & 1.3070 in extension.
Alternative scenario Above 1.3125 look for further upside with 1.3140 & 1.3155 as targets.
Comment The RSI calls for a drop.
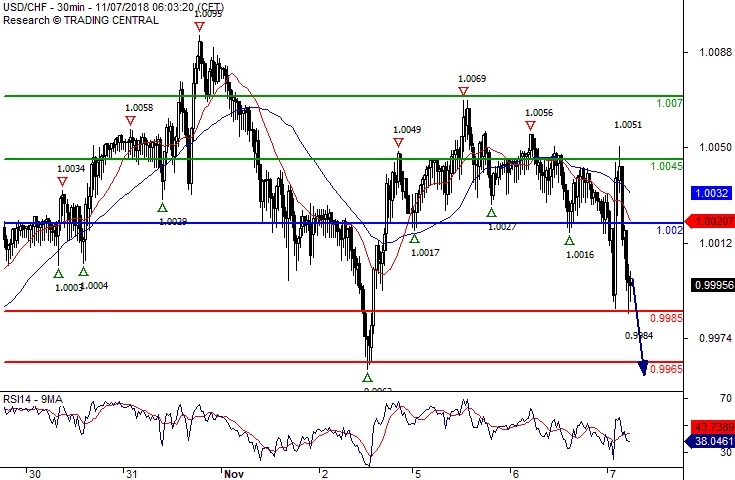
USD/CHF Watch 0.9965
Pivot (invalidation): 1.0020
Our preference Short positions below 1.0020 with targets at 0.9985 & 0.9965 in extension.
Alternative scenario Above 1.0020 look for further upside with 1.0045 & 1.0070 as targets.
Comment A break below 0.9985 would trigger a drop towards 0.9965.