Sample Category Title
Oil Lower As Iranian Sanctions Come Into Force
Election uncertainty leaves investors on the fence
It's been a mixed start to trading at the start of the week, with stocks in Europe looking a little flat and US futures slightly in the red as traders await the results of the midterm elections.
I think we've entered wait and see mode which, given the volatility of recent weeks, isn't the worst thing. I think a couple of steady days will be welcomed by investors after what was a largely positive week just gone. The midterms may generate more volatility in the middle of the week as we see the knee-jerk reactions to the result but at this stage it's tough to judge how markets would respond.
Much of Trump's pro-growth, pro-markets agenda has arguably been enacted in the first two years of his Presidency while he's had the backing of both the House and Senate. If the Democrats take control of the House, for example, it may inhibit his final two years which investors may not be particularly upset about given his determination to engage in a trade war with China and the EU.
Will Fed signal slower interest rate hikes on Thursday?
The other event of note this week will be the Fed decision on Thursday. While I don't buy into Trump's claims that the Fed is to blame for the market sell-off, it is clear that the trigger was Powell's comments a month ago when he stated that we're not close to the neutral rate yet and could go beyond. Given how markets have responded since then, I do wonder whether they will signal a slight softening on the outlook for interest rates on Thursday.
I doubt this will get in the way of a rate hike next month but they may be encouraged to take a slightly more cautious approach next year and even a nod to this on Thursday could put investors' fears at ease. Today, it's the ISM non-manufacturing PMI that traders will be focused on and its expected to drop back below 60 following last month's huge and unexpected jump.
Oil lower as Iranian sanctions come into force
Oil prices are continuing to slip at the start of the week as the US sanctions against Iran come into force. WTI and Brent have fallen almost 20% since peaking a month ago when sanctions and the prospect of a tight oil market had traders talking about $100 a barrel oil again. Sentiment has very quickly shifted and inventory builds over the last couple of weeks along with global growth fears have sparked a dramatic change in sentiment towards oil which is now trading back at the levels it stabilised around earlier in the summer.
Is there a bullish case for Gold into year end?
Gold is also relatively stable at the start of the week having roughly settled in a range between $1,220 and $1,240 over the last few weeks. While any improvement in risk appetite could be seen as being negative for Gold prices, I wonder whether if this is accompanied by a softer dollar if the opposite will be true. Positive progress on Brexit and Italy are two scenarios that could trigger this and both could feasibly happen in the coming weeks.
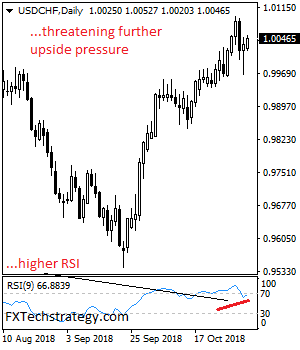
USDCHF: Bullish Risk Builds Up Towards Key Resistance
USDCHF bullish risk builds up towards key resistance located at 1.0052 zone. On the upside, resistance resides at the 1.0100 level where a break will clear the way for more strength to occur towards the 1.0150 level. Further out, resistance comes in at the 1.0200 level. Above here if seen will turn attention to 1.0250. Its daily RSI is bullish and pointing higher suggesting further strength. On the downside, support lies at the 1.0000 level. A turn below here will open the door for more weakness towards the 0.9950 level and then the 0.9900 level. All in all, USDCHF faces further price strength towards its key resistance.
EUR/USD Analysis: Will Surge To 1.1420
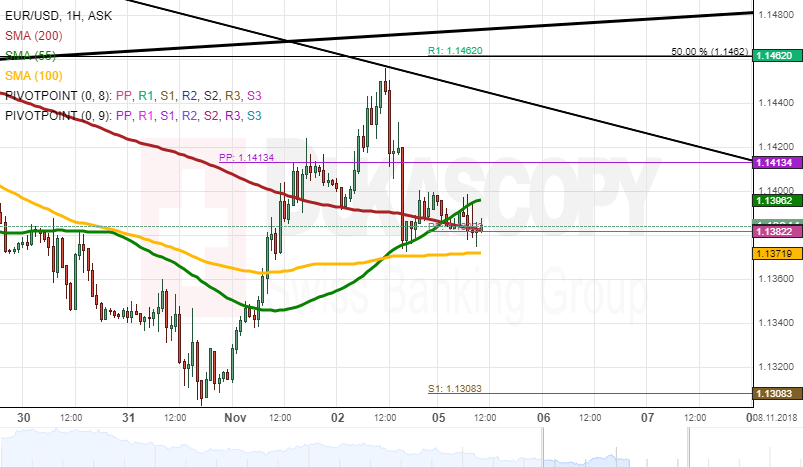
During Friday's session, the rate broke the resistance of the monthly PP at 1.1413 but was diminished to end the trading day at the 1.1388 mark. During Monday morning hours, the European Single Currency was supported by the 200-hour SMA near the weekly PP at the 1.1390 mark.
In regards to the near-term future, the currency exchange pair will trade upwards due to the support of the weekly PP at 1.1382 and the support of the 200-hour SMA. It is expected that the rate will trade near the 1.1420 mark during the day.
On the other side, the rate might get resisted by the monthly PP at 1.1413 to trade at 1.1360 after the US ISM Non-Manufacturing PMI data release at 15:00 GMT.
GBP/USD Analysis: Supported By 55-Hour SMA
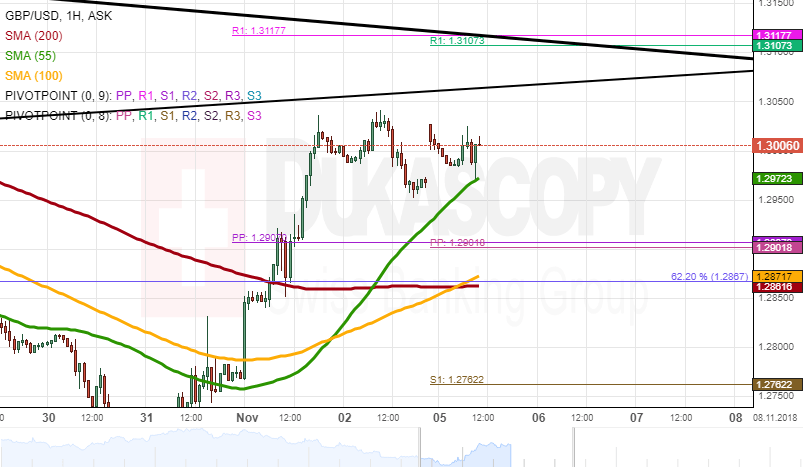
During Friday's trading session, the British Pound was trading sideways to end the trading session at the 1.3000 mark. On Monday morning, the British pound was supported by the 55– hour simple moving average to trade at the 1.2995 mark.
In regards to the near-term future, the British Pound will keep moving sideways to stay at the 1.3000 level. The 55-hour simple moving average will support the British Pound during the trading session on Monday.
On the other side, the British Pound could trade downside towards the monthly pivot point at the 1.2901 mark after today's UK Services PMI data release at 9:30 GMT.
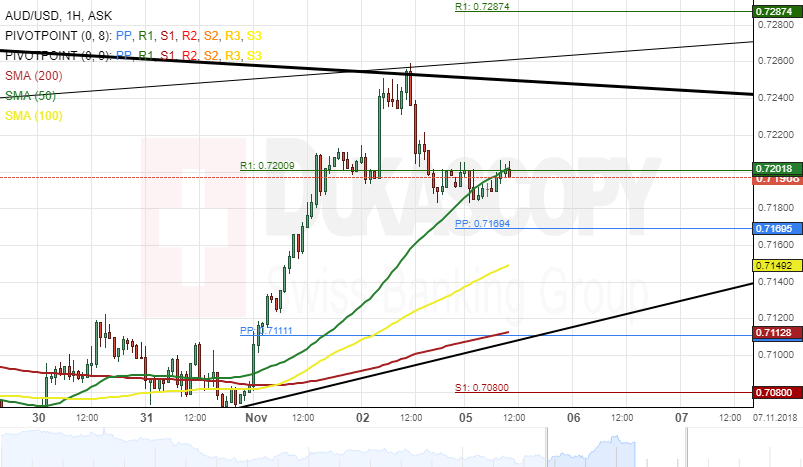
AUDUSD Analysis: Targets At 0.7250
The Australian Dollar has been trading in an uptrend line against the US Dollar. This surged began after the currency pair bounced off its bottom border of the trendline 0.7024 on October 26.
The exchange rate breached the 50-hour simple moving average at 0.7190 during the morning hours of Monday's session.
Everything being equal, it is likely that the AUD/USD currency pair aim for a re-tests of the upper boundary of a dominant descending channel at 0.7250 within this session.
Although, a resistance level formed by the weekly R1 at 0.7200 could hinder the currency exchange rate from reaching the target today.
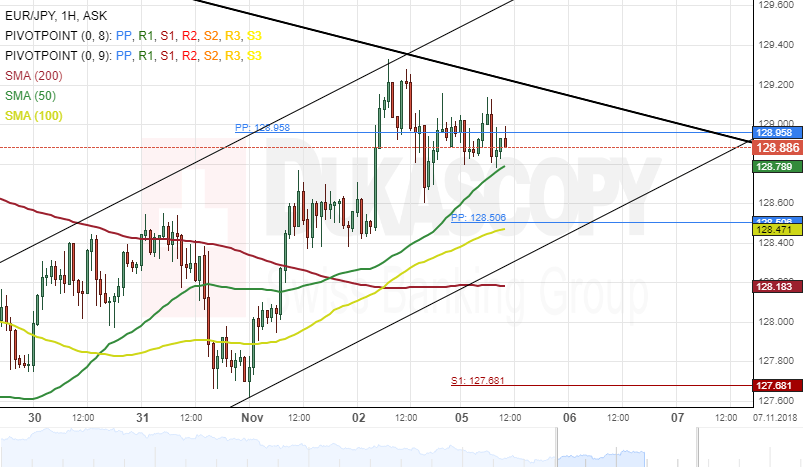
EURJPY Analysis: Potential Breakout
The common European currency has been appreciating against the Japanese Yen after the currency pair reversed from the lower boundary of a dominant descending channel at 126.69.
Currently, the exchange rate is trading near the upper border of the dominant channel; at 128.95 and could be set for a breakout.
If this breakout occurs, the next target for the currency exchange rate will be at a swing high of 130.17.
However, if the resistance level formed by the upper boundary of the channel holds, the EUR/JPY exchange rate could aim at a support line formed by the weekly PP at 128.50 within this session.
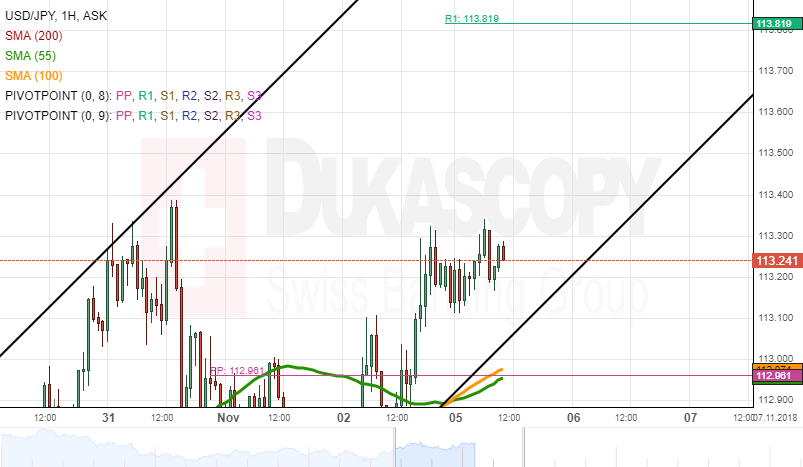
USD/JPY Analysis: Trades At 113.20
During Friday's trading session, the currency exchange pair was trading sideways to end the trading day at the 113.16 mark. On Monday morning, the US Dollar was trading at the 113.27 mark.
In regards to the near-term future, most likely, the US Dollar will trade towards the 113.40 level during the day. None of the technical indicators could prevent the rate from the surge. Besides, the 55-hour and the 100-hour SMAs will try to catch up the rate during the trading session to give additional support for the surge.
On the other side, the rate could trade towards the bottom boundary of the ascending medium channel at 113.10 if the US Dollar will depreciate during the day.
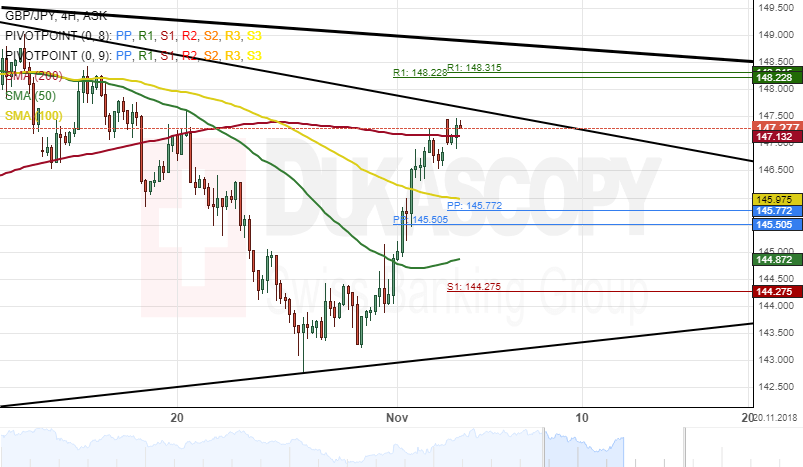
GBP/JPY 4H Chart: Targets At 149.00
The British Pound has been appreciating against the Japanese Yen after the exchange rate bounced off the lower boundary of an ascending trendline at 142.77 on October 26.
The currency pair was trading near the upper boundary of a downtrend line at 147.13 during the Asian session on Monday and could be set for a potential breakout.
If this breakout occurs, the GBP/JPY currency pair will aim at the upper border of a dominant descending channel at 148.22 during the following trading sessions.
Moreover, technical indicators suggest that the expected advance might occur in the next 24hrs.
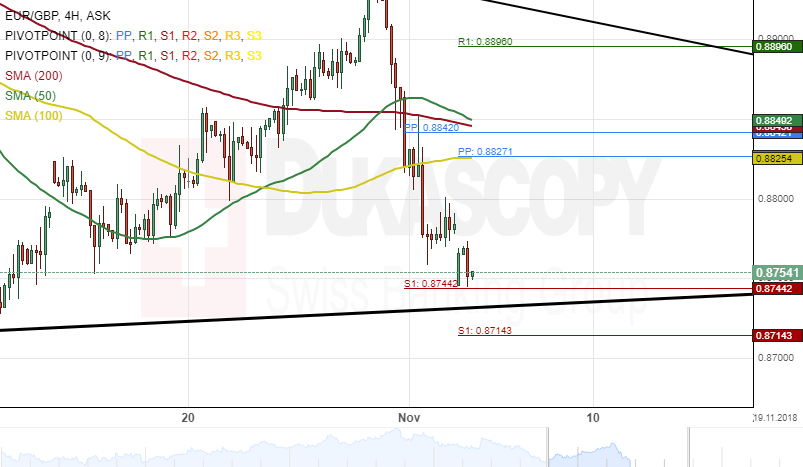
EUR/GBP 4H Chart: Potential Breakout
The common European currency has depreciated massively against the British Pound. This decline began on October 31, after the currency pair hit the upper boundary of a downtrend line at 0.8937.
The exchange rate was trading near the bottom border of an ascending trendline at 0.8744 during the morning hours of Monday's session and could be set for a breakout.
If this breakout occurs, the currency exchange rate could aim at April 13 swing low of 0.8622 during the following sessions.
However, a support cluster formed by the combination of the weekly and the monthly PPs near the 0.8645 area could hinder such decline to occur.
AUDUSD Outlook: Aussie Maintains Positive Tone But Key Fibo Barrier Still Holds, RBA And US Elections In Focus
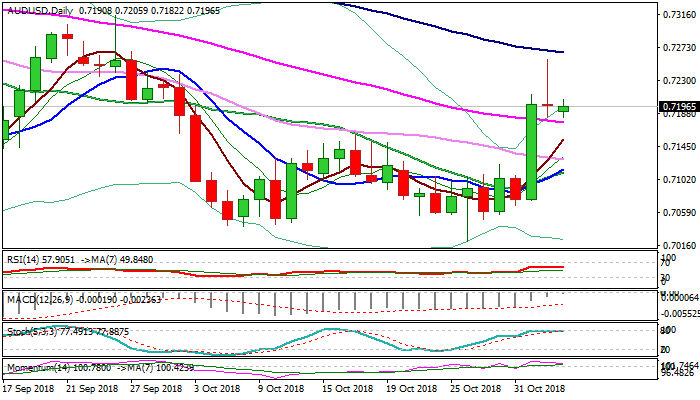
The Australian dollar remains constructive on Monday and attacks again key Fibo barrier at 0.7202 (Fibo 61.8% of 0.7314/0.7020) after two consecutive attempts last week failed to close above.
Friday's spike to 0.7258 (the highest since 27 Sep) was short-lived as subsequent quick pullback lest daily Doji candle with very long upper shadow, but negative signal from this had so far little impact on bulls, as last Thursday's massive bullish daily candle continues to underpin.
Bulls need close above 0.7202 pivot to generate bullish signal, with penetration of daily cloud (base lays at 0.7226) and extension above falling 100SMA (0.7267) to confirm bullish scenario.
On the other side, weakening momentum and neutral daily RSI/slow stochastic, warn that bulls may run out of steam, with repeated close below 0.7202 to add to negative signals. Broken falling 55SMA (0.7176) marks pivotal support, loss of which would weaken near-term structure, while extension below 0.7128 (broken 30SMA) would confirm reversal. The pair may hold in extended directionless mode and awaiting firmer signals from key events- RBA rate decision and US midterm elections tomorrow.
Res: 0.7202, 0.7226, 0.7258, 0.7267
Sup: 0.7176, 0.7154, 0.7128, 0.7110