

Sample Category Title
US Dollar Unchanged Ahead Of The Mid-Term Elections
The US dollar was unmoved during the Asian session ahead of the US mid-term elections that are scheduled for tomorrow. These elections are being viewed as the most important mid-term elections in history. This is because they will help determine the influence of Donald Trump in American politics. A win by the Republican Party will be an indication of the strength of the US President. A defeat will likely mean a halt of his agenda, more departures from the White House and further congressional investigations on Trump and his administration.
The price of crude oil was unchanged in the Asian session. This is as traders prepare for the Iranian sanctions that will start today. Iran is the third biggest oil producer in the OPEC producing almost 4 million barrels every day. When the sanctions kick in, the country will not be able to trade in the crude oil market which relies extensively on the dollar. Most western firms will avoid the country with the goal of avoiding US sanctions and fines. The reason why there was no major movement in the price was that these effects were already factored in during the trading session.
Sterling rose slightly against the USD ahead of the important services PMI numbers. These numbers show the purchasing activity of the purchasing managers in the services sector. An increase in the activity is a sign that the industry is doing well while a reduction is a bad sign for the economy. Today’s numbers are expected to show the PMIs at 53.3. This will be lower than the September’s 53.9. An improvement in the number will be a positive indicator for sterling.
EUR/USD
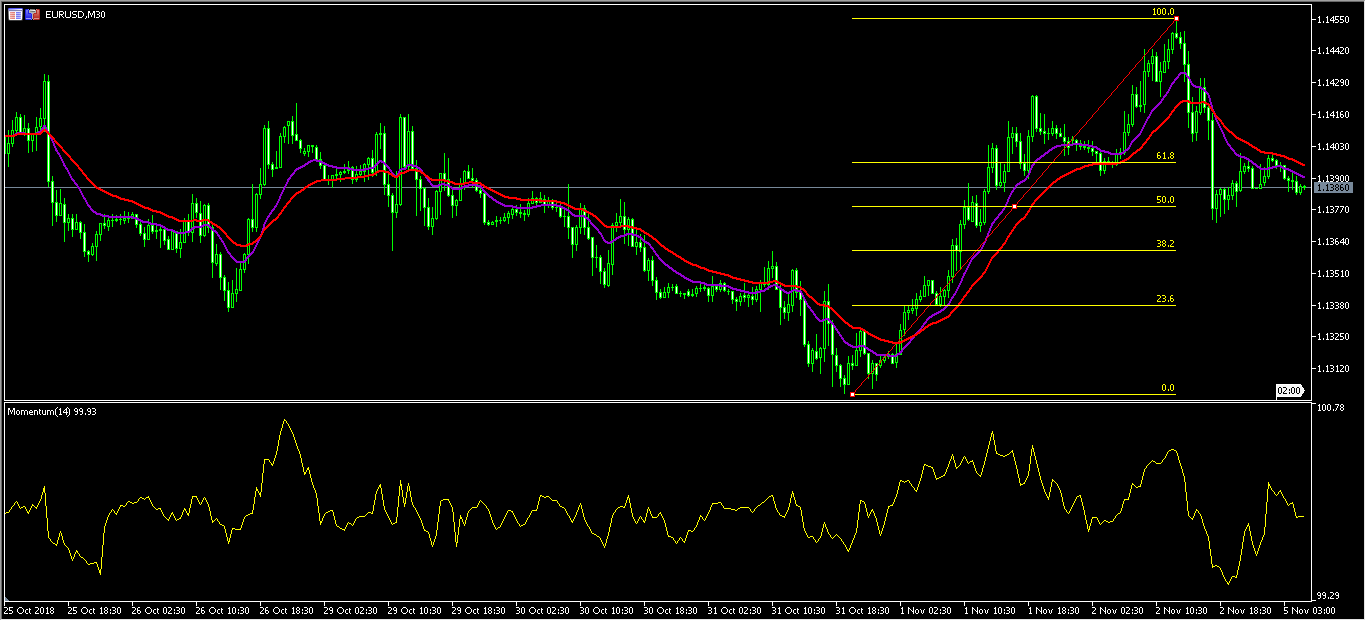
The EUR/USD pair is trading at 1.1386. This is at almost the same level that it ended the day at on Friday. It is also sharply lower than Friday’s high of 1.1455 and along the 50% Fibonacci Retracement level. The double EMA on the 30-minute chart is almost neutral while the momentum indicator shows that the pair’s downward momentum has eased. Therefore, it is likely that the pair will resume the upward movement as traders wait for the decision by the Fed later this week.
GBP/USD
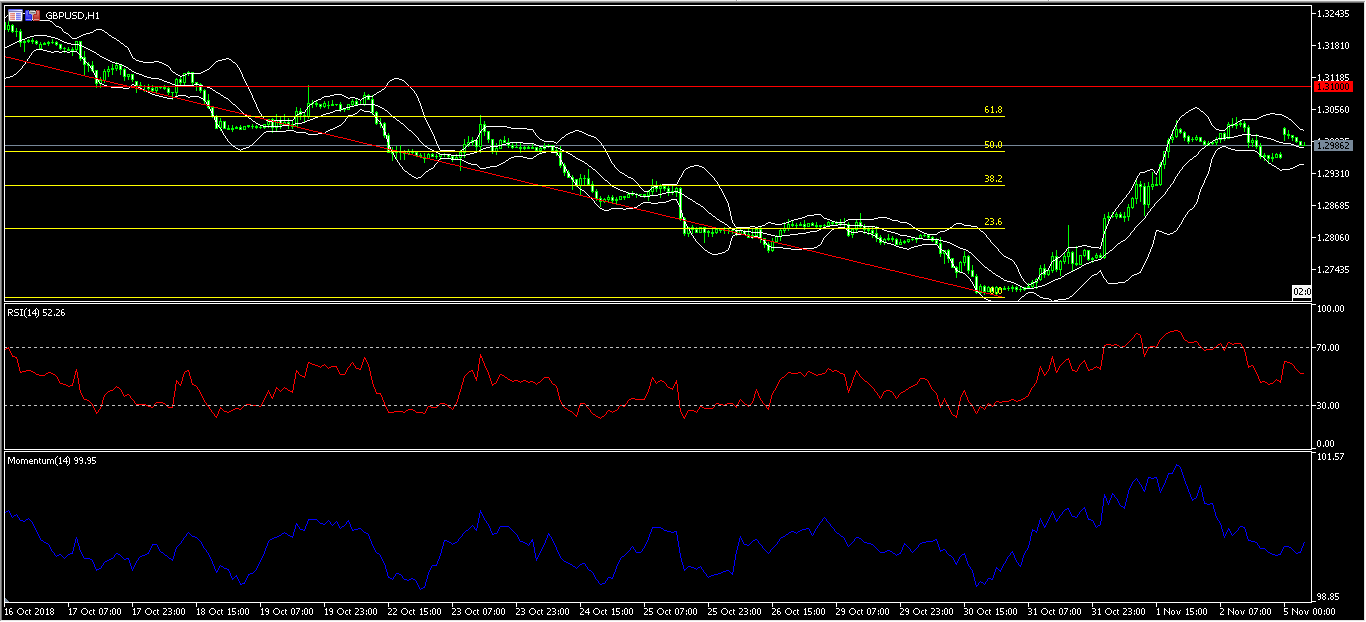
The GBP/USD pair rose in the Asian session to an intraday high of 1.3020. The current price of 1.2987 is almost along the 50% Fibonacci Retracement level. It is also along the middle line of the Bollinger Bands. The RSI is currently at 52 while the momentum indicator shows weak downward momentum as shown below. Therefore, it’s likely that the pair will resume the upward movement. If it does, it will test the important resistance level of 1.3100.
XBR/USD
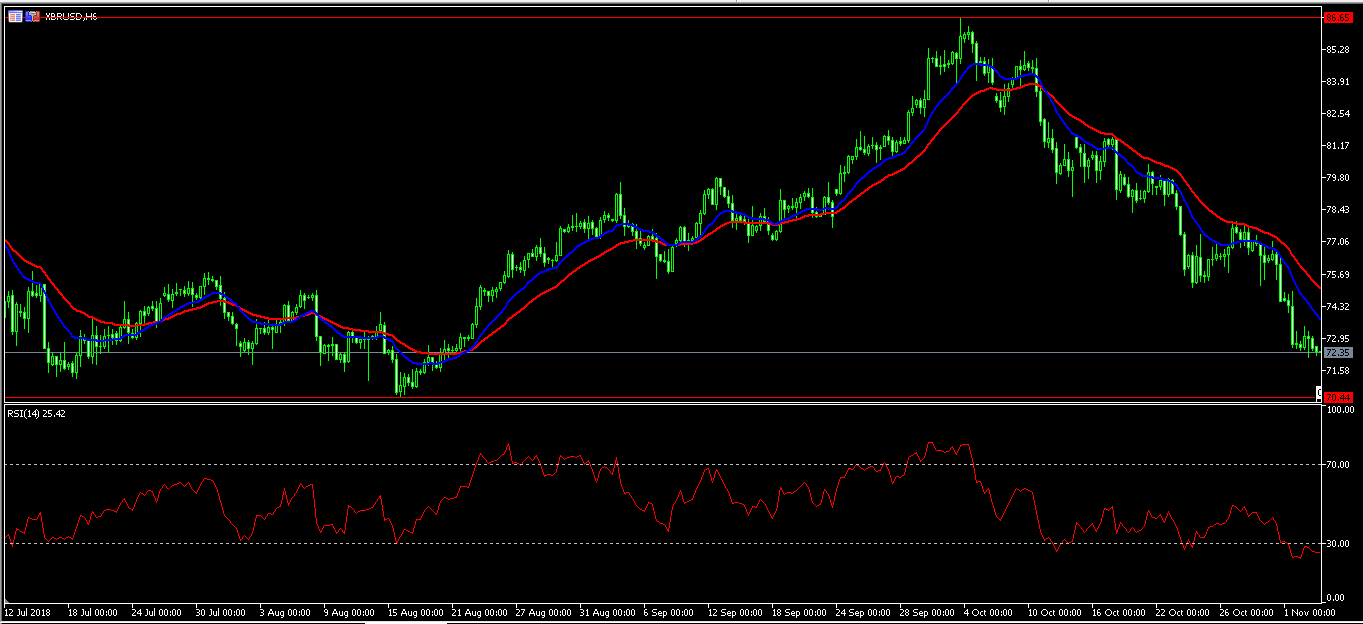
The price of Brent crude was unchanged today ahead of the Iran sanctions. The XBR/USD pair traded at 72.36. This was near to Friday’s low of 72.30, which was the lowest level since August 27. The double EMA of the pair shows that the downward trend is likely to continue as traders start looking at the effects of Iranian sanctions. The RSI is currently at 25. While this is the oversold level, it is also an indication of the strength of the downward trend. If the downward momentum continues, it will likely hit the 70 level.
EURGBP Opens With A Gap Down, Approaches Oversold Area
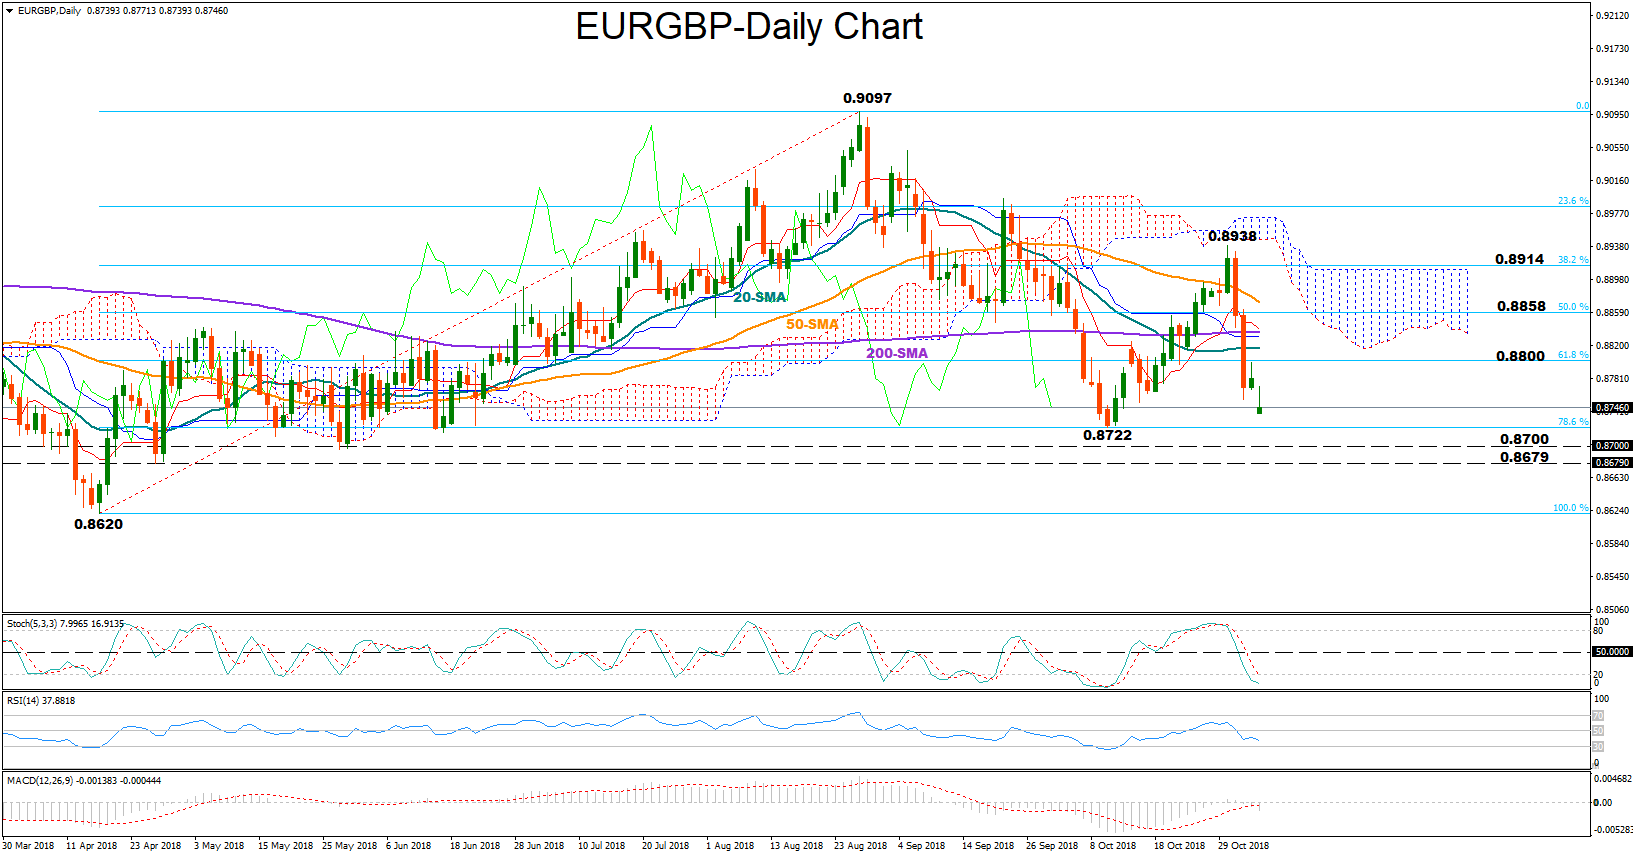
EURGBP opened with a gap down on Monday near one-month lows and is currently trying to restore its losses. Negative risks however remain in the background as the MACD increases momentum to the downside and below its red signal line. The RSI is also in bearish territory but is close to its 30 oversold threshold, hinting that an upside correction is possible. The latter is also supported by the Stochastics which are heading for a bullish cross below 20.
Should the market stretch north, immediate resistance is expected to come from the 61.8% Fibonacci of the upleg from 0.8620 to 0.9097, near 0.8800. A break higher would shift focus to the 50% Fibonacci of 0.8858, which tried to halt both downside and upside movements several times in the past. Above that, investors would be interested to see whether bullish dynamics can overcome the previous peak of 0.8938 which is located slightly above the 38.2% Fibonacci of 0.8914.
On the other hand, a decline in the price may retest 0.8722, the low on October 10 and the 78.6% Fibonacci before meeting support between 0.8700 and 0.8678. Further down, the next stop could be at the 0.8620 bottom, where any violation would resume the downleg off 0.9097.
Turning to the medium-term picture, the market continues to trade in a downtrend since August 28. But hopes for a bull market are weakening as the 50-day moving average is moving downwards to drop below the 200-day MA, while the 20-day MA has already crossed below it.
Untimely Hawkishness Of The Largest Central Banks
Despite the rebound of last week, which allowed key indices to bounce off the recent lows, the financial markets remain cautious. A new wave of pressure on Friday was spurred by the U.S. labour market report.
The data for October showed growth of employment by 250K and acceleration of wage growth up to 3.1% yoy (highest since 2009), as well as the persistence of unemployment at the level of 3.7%, which is the minimum since 1969. Strong data heightened the fears that the Fed will actively raise rates in the coming months to prevent overheating of the economy and not to push inflation out of control.
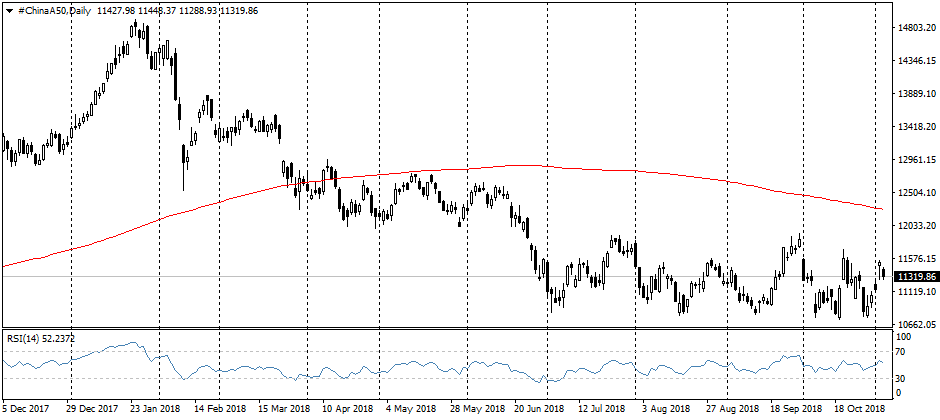
The trend of folding incentives was supported on Monday morning by the head of the Bank of Japan comments. In his speech, Kuroda noted that the strengthening of the economy allows to abandon excessively soft monetary policy, although leaving the stimulation of the economy by soft policy.
A little over a week ago, the ECB head pointed to the continuation of plans to winding down the QE programme by the end of the year and repeat stance to increase the rates in less than a year.
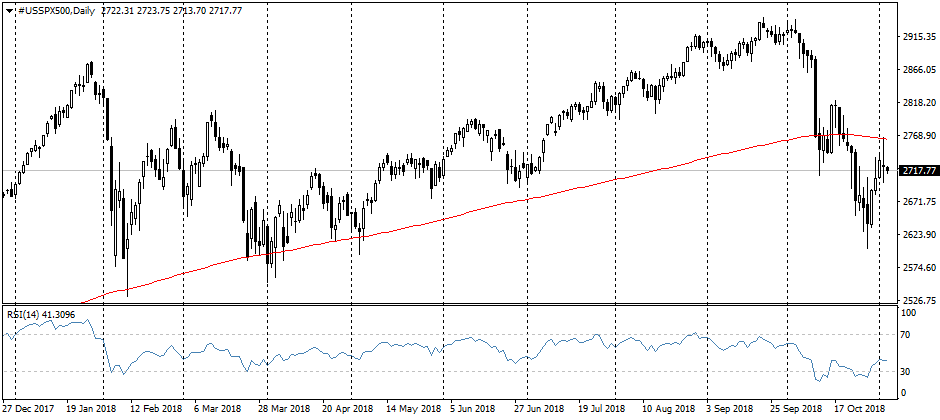
Their intention to raise the stakes more decisively if Brexit will go smoothly, last week was hinted by the Bank of England.
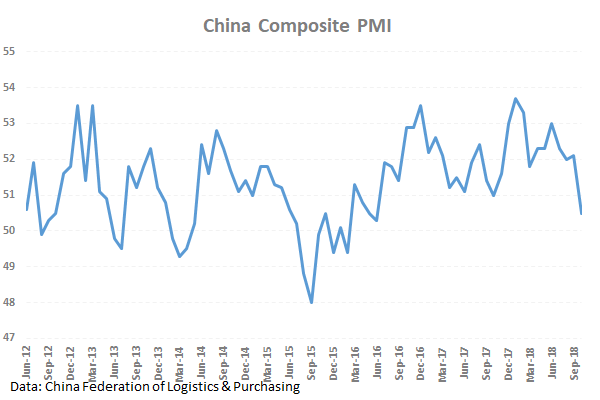
Such a tone from large and influential central banks is developing fears in the markets about the lack of liquidity in the markets. Previously, in early 2016, the easing from the ECB and the Bank of Japan and a pause in promotions from the Fed helped to keep markets from collapsing in the wake of fears around China. This time the situation looks different. Although the Chinese economy now feels better than it did three years ago, the decline in activity brings back the memories of that time. Published in the morning, Services PMI has been falling to lows for a year. And composite index fell to 50.5 mark, which is the lowest level in two years and shows growth rates close to zero.
The determination of the developed countries’ central Bank in the phasing out of incentives can provoke the outflow of funds from the markets of developing countries and even create a new wave of flight from risks, as it happened in the episodes in 2014 and 2015. Then the markets managed to reassure promises not to tighten the policy without regard to financial stability in foreign markets. But it seems that the epidemic of the concentration only on the internal situation had already covered the central banks.
Currencies: USD Holding Strong, But Rally To Take A Breather Ahead Of US Elections
Rates: Stellar payrolls lift US yields
The US 10-yr yield closes in on the 3.26% cycle high following Friday’s stellar payrolls. Wage growth accelerated to 3.1% Y/Y. Heavy US and EMU supply are negative for core bonds this week. Main events this week are US mid-term elections, the FOMC Meeting and new EC forecasts. We start the week with a downward bias for bonds.
Currencies: USD holding strong, but rally to take a breather ahead of US elections
At the end of last week, the dollar remained well bid, supported by solid US payrolls. However, a test of the EUR/USD 1.13 support area was rejected earlier last week. Interest rate differentials remain a big support for the US currency. However, investors might take a wait-and-see approach going into the US mid-term elections.
The Sunrise Headlines
- US equity markets lost ground on Friday with tech shares (Nasdaq -1.04%) underperforming. Asian markets opened this week’s session with losses. Hong Kong (-2%) underperforms, followed by Japan and China.
- The US have re-imposed sanctions on Iran. Eight countries are expected to be given temporary exemptions to ensure crude oil prices are not destabilized. Iran’s Rouhani said Iran will break the US sanctions and continue to sell oil.
- Brexit secretary Raab urges PM May to back a plan that gives the UK the right to pull out of any ‘backstop’ plan with just 3 months’ notice. This follows on rumours that May wants to keep the UK in a customs union after Brexit.
- Chinese president Xi Jinping announced that China will cut tariffs and continue to reduce investment barriers. His comments come after positive talks with US President Trump last week, saying negotiations are moving in the right direction.
- The Chinese Caixin services PMI unexpectedly fell from 53.1 to 50.8. New business dropped to the lowest since November 2008, despite staying in expansionary territory, indicating an obviously weakening demand for services.
- Japanese PMI’s rebounded from a weather-related dip in September, rising to a six-month high in both the services (52.4) and manufacturing sector (52.5). November data will be important to assess the resilience of the economy.
- Today’s eco calendar contains the ISM Non-Manufacturing Index for October in the US. The Markit/CIPS Services/Composite PMI’s are released for the UK. ECB’s Vice President Guindos speaks in Brussels and the US taps the market
Currencies: USD Holding Strong, But Rally To Take A Breather Ahead Of US Elections
USD rally to take a breather going into US election
On Friday, EUR/USD initially extended the technical rebound that started on Wednesday. At that time, a test to break below the year low in the 1.13 area failed. Some positive noise on the US-China trade talks might have been a slightly euro positive, too. However, fortunes for EUR/USD changed again Friday afternoon. US payrolls were solid as expected. Later in the session, the euro suffered from press reports that the ECB was pondering the options to replace maturing TLTROs by a new source of cheap funding. EUR/USD declined came off the intraday peak in the mid 1.14 area and closed at 1.1388. USD/JPY also profited from the rise in US yields and finished the session at 113.20 (from 112.70).
This morning, investors in Asia take a defensive approach with indices across the region drifting into negative territory. There is no concrete positive news from the US-China trade talks. China’s (Caixin) PMI’s showed an unconvincing picture, too. The prospect of a likely further rise in US yields is no help for regional markets. The outcome of the US mid-term elections is also a source of uncertainty. The dollar is holding relatively strong. EUR/USD trades just below 1.14. USD/JPY remains well bid even as BOJ’s Kuroda questioned the effectiveness of large scale monetary easing. Later today, the eco calendar in the EMU is thin. The US non-manufacturing ISM is expected to ease from 61.6 to 59.1. A relatively soft figure is possible. Any market reaction might be subdued, as markets await the outcome of the US elections. We start the week with a neutral bias on EUR/USD. The USD continues to enjoy ample interest rate support, but last week’s rejected rest of the low 1.13 area/2018 low suggests that more positive news is needed to trigger further USD gains beyond important technical levels. Positive Brexit headlines might be slightly euro supportive, but we don’t expect this to be a game-changer for the euro. More sideways trading in the 1.13/1.16 range might be on the cards. Within this range, a sell-on-upticks approach remains favoured.
At the end of last week (and this weekend) the news flow turned more GBP-supportive (rather hawkish BoE speak, positive Brexit headlines). EUR/GBP spiked lower at the start of Asian trading this morning, but sterling gains could not be sustained. Sentiment on sterling improved, but we assume that concrete progress is needed for sterling to strengthen beyond the EUR/GBP 0.8723/0.8696 intermediate support.
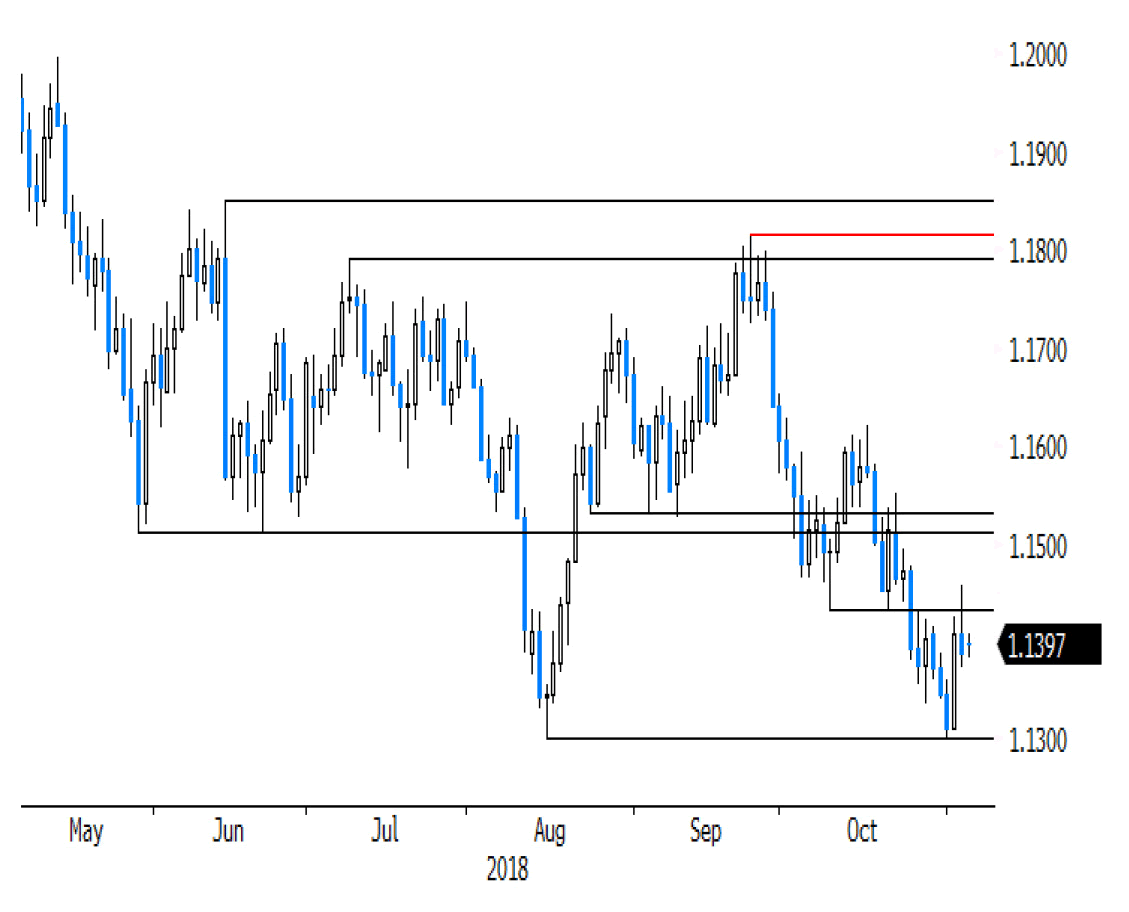
EUR/USD: dollar holiding strong, but EUR/USD 2018 low proves to be tough support
Stocks Back In The Red
President Trump’s tweet on Thursday that he had a “long and very good conversation with President Jinping of China” didn’t serve the markets for long. Stocks in Hong Kong, Shanghai, Tokyo, SouthKorea,and Australia were all in red today including U.S. futures after White House economic advisor Larry Kudlow said on Friday that President Trump had not asked his Cabinet to draw up a trade deal with China. Such conflicting reports make investors more nervous, especially seeing that bears seem to have taken control over the past several weeks.
Strong economic data from the U.S. is not helping either. Non-farm payrolls grew by 250,000 in October, much better than the anticipated 190,000. More importantly, wages advanced 3.1% year-on-year, the highest in almost a decade. For those investors hoping that the Federal Reserve may slow down the tightening of monetary policy, the non-farm payrolls report just doesn’t help.
The Fed will be meeting on Wednesday and will likely confirm that a December rate hike is a done deal, ignoring October’s steep selloff in the financial markets. So, if rising interest rates were the primary concern of investors, nothing willchange this week.
The results of Tuesday’s U.S. mid-term elections will decide which party controls the House and Senate. According to most polling data the Democrats are likely to take control over the House with the Republicans retaining the majority in the Senate. Such an outcome would limit Trump’s power in passing policies, whether it’s fiscal or trade, but this outcome seems to have already been pricedin. Market’s worst-case scenario would be the Democrats controlling both houses as future fiscal policy trajectory becomes uncertain, and the probability of Trump’s impeachment intensifies.
In commodity markets,Oil fell as U.S. sanctions on Iran proved to be less severe than previously anticipated. Exempting eight countries from the U.S. sanctions means Iranian Oil will continue to flow and there’s no longer risk of a supply shortage. However, Brent’s 16% drop from October’s high has more to do with the demand side, which seems to be falling as global economic growth continues to send negative signals. The break below the 100 and 200 days moving averages suggests that Brent prices may continue to fall and we’re currently looking for a test of the $70.
GBP/JPY Daily Outlook
Daily Pivots: (S1) 146.28; (P) 146.77; (R1) 147.28; More...
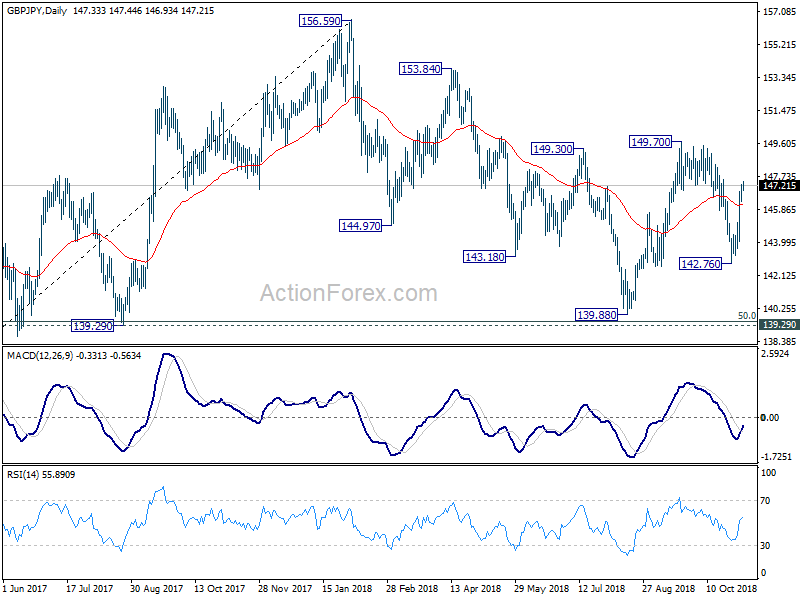
Intraday bias in GBP/JPY remains on the upside as rebound from 142.76 is in progress for 149.70 first. Break will resume the rise from 139.88 and target 153.84/156.59 resistance zone. On the downside, below 145.43 minor support will turn bias back to the downside for 142.76 again.
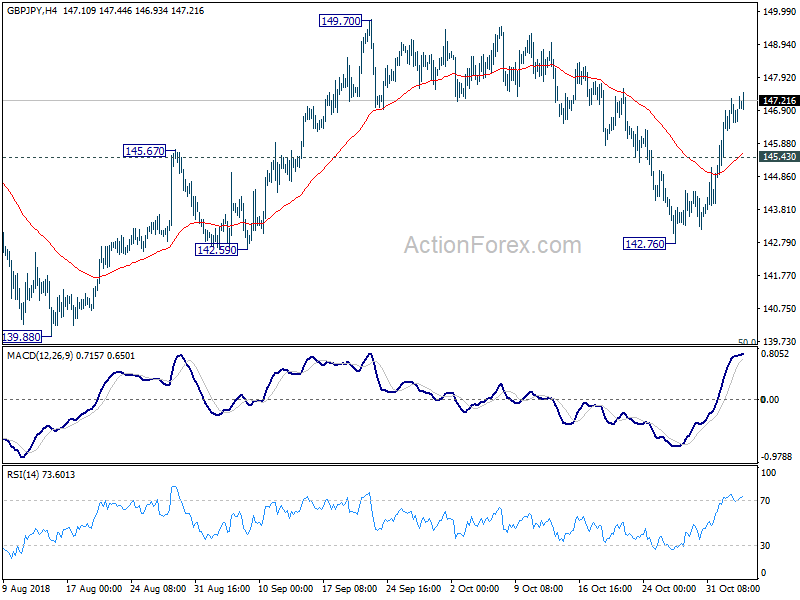
In the bigger picture, as long as 139.29 cluster support (50% retracement of 122.36 to 156.59 at 139.47) holds, up trend from 122.36 (2016 low) would still extend beyond 156.69 high. However, decisive break of 139.29/47 will suggest that such up trend is completed and turn outlook bearish. In that case, next target is 61.8% retracement at 135.43.
GBP/USD Massive Bullish Impulse Creates Wave-3 Pattern
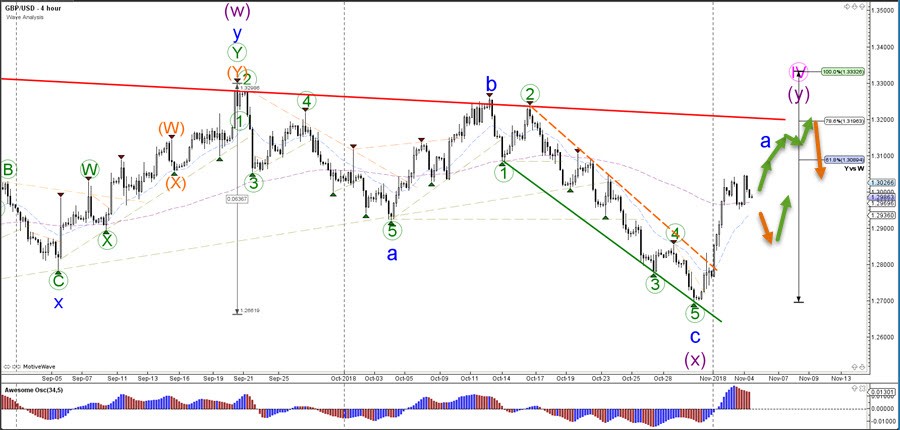
The GBP/USD is showing a strong bullish momentum after breaking the resistance trend line (dotted orange) of the downtrend channel. Price is expected to move up towards the Fibonacci retracement levels of wave Y vs W.
If the GBP/USD is indeed in awaveA (blue), then price will make a bearish bounce at the Fibonacci retracement levels and continue for a lower low for a wave B.
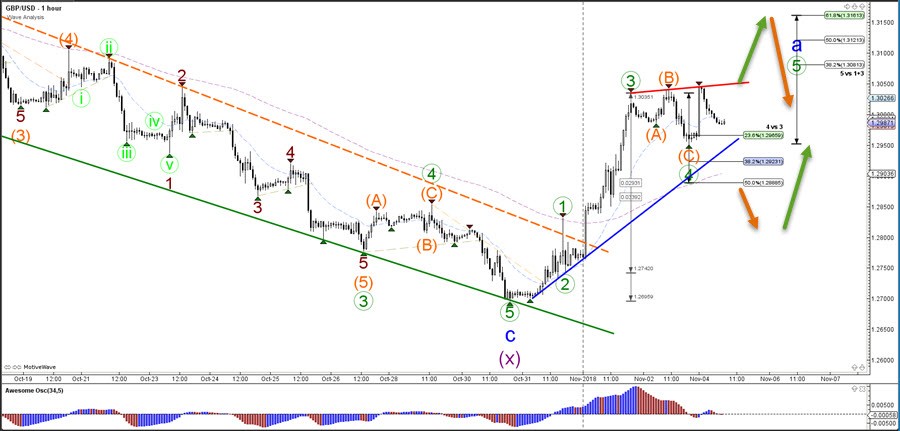
The GBP/USD is probably building a wave 345 (green) pattern in wave A (blue). A break above the resistance trend line (red) could see price make a new high as part of wave 5 (green) of wave A (blue) whereas a break below the support trend line (blue) and 50% Fib of wave 4 vs 3 could see price make a wave B.
EUR/JPY Daily Outlook
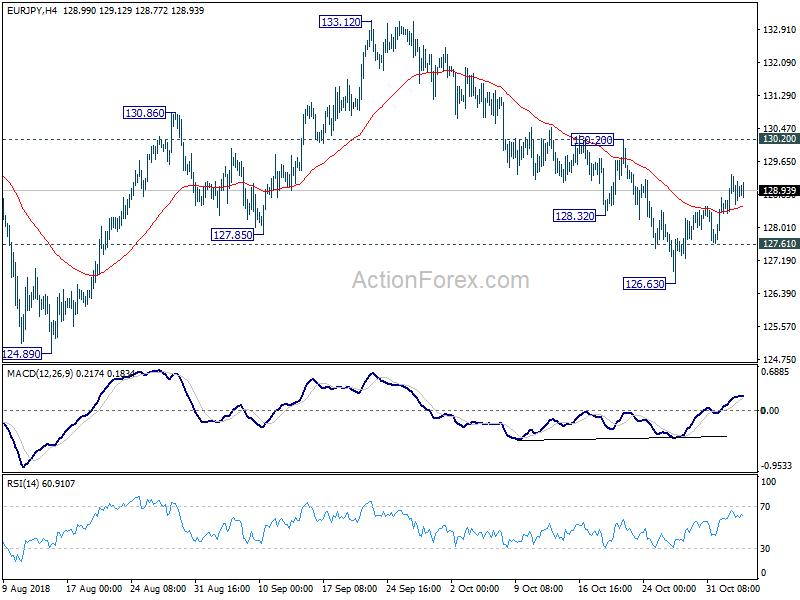
Daily Pivots: (S1) 128.40; (P) 128.86; (R1) 129.36; More....
Intraday bias in EUR/JPY remains mildly on the upside as rebound from 126.63 is in progress for 130.20 resistance. Though, strong resistance from there might be seen to limit upside to resume the decline from 133.12. On the downside, break of 127.61 minor support will turn bias to the downside. Break of 126.63 will extend the fall from 133.12 to retest 124.89 low. Nonetheless, sustained break of 130.20 will pave the way back to 133.12 high instead.
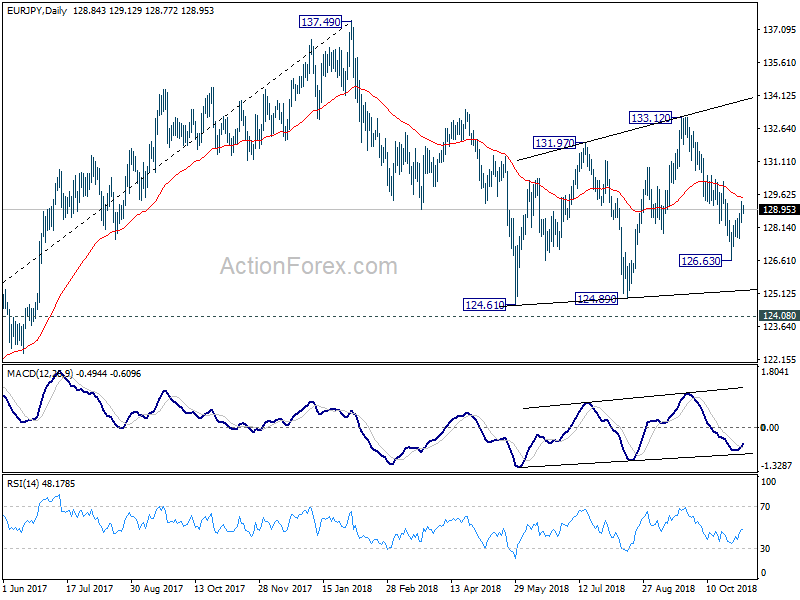
In the bigger picture, as long as 124.08 key resistance turn supported holds, larger up trend from 109.03 (2016 low) is still in progress. Firm break of 137.49 structural resistance will target 141.04/149.76 resistance zone next. However, decisive break of 124.08 will argue that such rise from 109.03 has completed and turn outlook bearish. In that case, deeper fall would be seen to 61.8% retracement of 109.03 to 137.49 at 119.90.
Pound Gaps Higher On Brexit Report
Brexit news gives GBP another boost
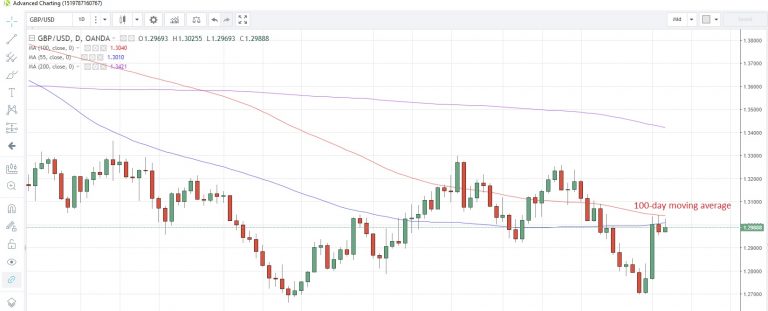
The pound traded higher in early trading Monday following weekend news reports that an all-UK customs deal would be written into Brexit terms. GBP/USD touched 1.3026, just shy of Friday's 10-day high of 1.3041, and still holding below the 100-day moving average at 1.3040. That moving average has capped the pair on a closing basis since October 17.
Dollar holds on to gains
Elsewhere, USD/JPY clung on to Friday's gains above 113 as 10-year US yields held steady at 3.2%, after jumping the most in a month after the US jobs report on Friday. EUR/USD also posted gains on the back of the Brexit news, and the gains in both GBP and EUR, which combined make up about 70% of the dollar index, pushed the index marginally lower.
China pledges to open up markets
Speaking at an imports Expo, China's President Xi reiterated the government's pledges to open up local markets, widening access to financial markets and services, accelerate opening the education, telecom and cultural sectors and further open the agricultural and manufacturing sectors. It wants to accelerate trade talks with Europe, Japan and South Korea (though no mention of the US).
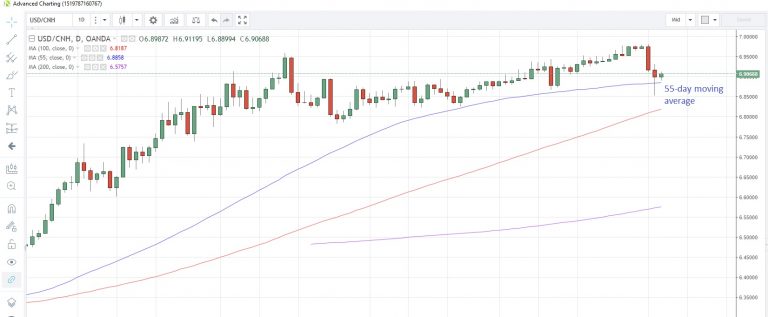
China's goods imports is expected to top $30 trillion in the next 15 years, while services imports are seen exceeding $10 trillion in the same period. There was muted reaction in markets to the comments, though the US dollar firmed up slightly. USD/CNH rose for the first time in three days and is keeping its foothold above the 55-day moving average at 6.8859.
Services PMI readings on tap
The Europe data slate is relatively barren, with just UK Markit services PMI and Euro-zone Sentix investor confidence on tap. The US ISM non-manufacturing PMI is expected to show a similar direction to the manufacturing one, namely a lower reading to 59.5 from 61.6. The Markit services PMI is also scheduled, and seen holding steady at 54.7.
Daily Markets Broadcast
Wall Street drops despite strong jobs report
Wall Street fell Friday despite the US adding the most jobs in eight months. Fast wages growth pushed US yields higher while Apple suffered on slowing iPhone sales.
We will pause the Daily Market Broadcast tomorrow 6 Nov and 7 Nov 2018, resuming our service on 8 Nov 2018.
US30USD Daily Chart
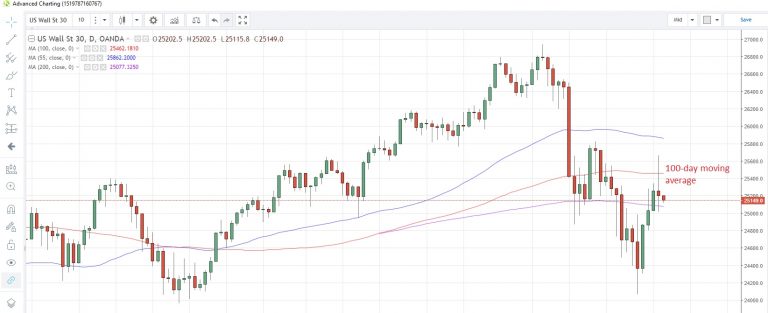
The US30 index fell for the first time in four days after earlier touching a two-week high
The index failed to hold above the 100-day moving average at 25,462 on Friday. A weaker start is pressing the index toward the 200-day moving average at 25,077
Today we see the ISM non-manufacturing reading for October and, like its manufacturing counterpart, is seen sliding to 59.5 from 61.6. A lower number could be negative for the index.
DE30EUR Daily Chart
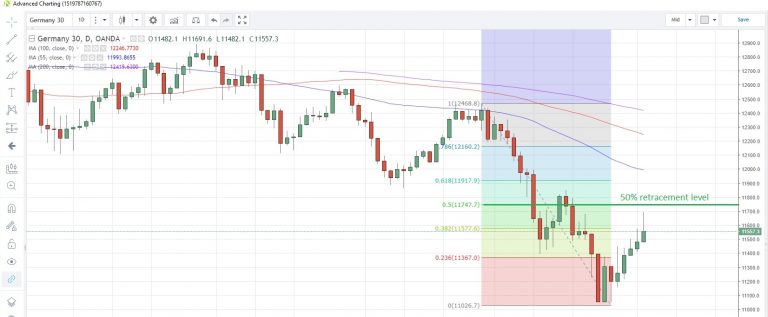
The Germany30 index extended gains to a fifth straight day, the longest bullish streak since mid-July, reaching the highest level in two weeks
The index is rising toward the 50% retracement of the Sep27 to Oct 26 drop at 11,748. However, negative sentiment across global equity markets suggests a test of this level may be postponed
Euro-zone investor confidence probably slipped in November, data to be released today may show. The Sentix index is seen falling to 10.1 from 11.4.
WTICOUSD Weekly Chart
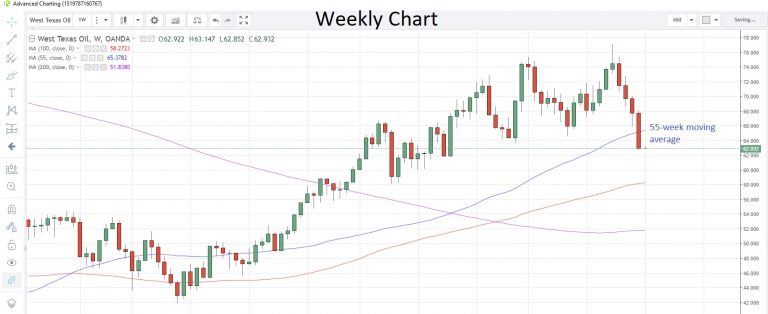
WTI slumped to a six month low on Friday after the US confirmed that eight importers had been exempted temporarily from the Iran sanctions
The commodity had its worst down-week since February last week, closing below the 55-week moving average for the first time since September 2017. The moving average is at $65.378 today
API weekly crude stocks data are due tomorrow. Last week saw inventories rise for a second week, with 5.7 million barrels added.