Sample Category Title
GBPJPY Rally Keeps Broader Bias Higher Towards 147.57 Area
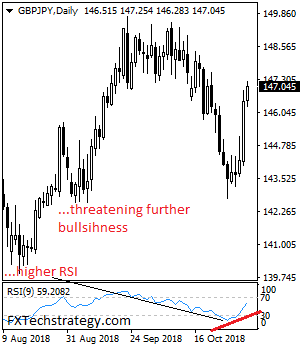
GBPJPY rally keeps broader bias higher with more strength towards the 147.57 level. Further out, resistance resides at the 148.00 level followed by the 148.50 level. A cut through that level will open the door towards the 149.00 level. Above here will aim at resistance the 14.950 level. Its daily RSI is bullish and pointing higher suggesting more strength. On the downside, support comes in at the 147.00 level where a violation will aim at the 146.50 level. A break below here will target the 146.00 level followed by the 145.50 level. All in all, GBPJPY faces further upside pressure with eyes on its key resistance.
EURUSD Outlook: Strong Recovery Extends Ahead Of US Jobs Data
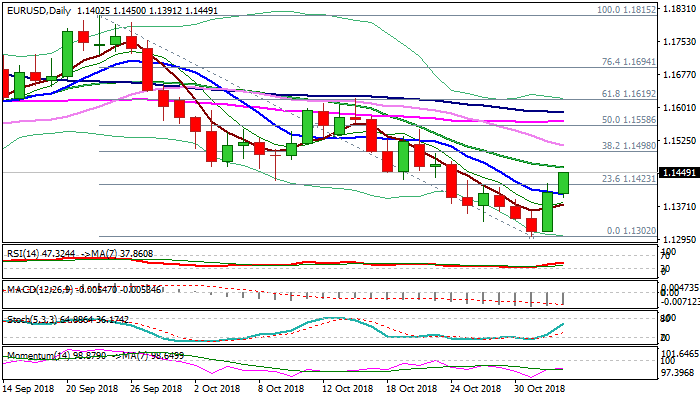
The Euro holds strong bullish tone on Friday and extends recovery rally from 1.1302 low into second day.
After falling 10SMA, which limited Thursday's action, was taken out, bulls generated fresh signal on break above double-Fibo pivot at 1.1423 (38.2% of 1.1621/1.1302 bear-leg/23.6% of 1.1815/1.1302) and threatening of extension above falling 20SMA (1.1462), in extended short squeeze.
Strengthening momentum and fresh risk appetite on signals of easing US/China trade tensions are supportive factors for the single currency.
Weekly close above 1.1423 is needed to confirm fresh bullish stance for extended recovery action after bears failed at key 1.1300 support.
US jobs data are expected to provide fresh signals, with any miss expected to keep the dollar under pressure and spark recovery extension.
Break above 20SMA would expose next strong barriers marked by double-Fibo barriers at 1.1499 (38.2% of 1.1815/1.1302/Fibo 61.8% of 1.1621/1.1302) and falling 30SMA at 1.1512.
Conversely, the Euro could come under pressure on upbeat US labor data and reverse the biggest part of recovery rally.
Res: 1.1462, 1.1499, 1.1512, 1.1567
Sup: 1.1423, 1.1398, 1.1335, 1.1314
EUR/USD Analysis: Breaks Technical Indicators
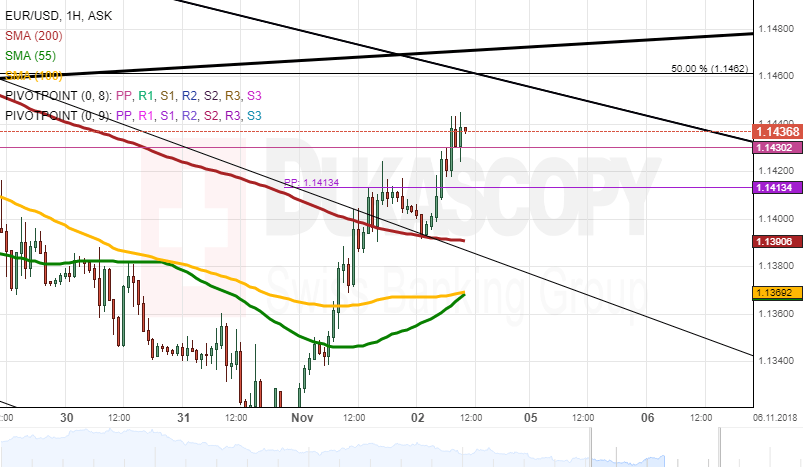
During Thursday's session, the currency rate passed through the resistances of the simple moving averages to end the trading day at the 1.1400 mark. On Friday morning, the European Single Currency broke the resistance of the weekly pivot point at 1.1413 to trade at the 1.1434 mark. In regards to the near-term future, the currency rate will bounce off the upper boundary of the small pattern line due to the resistances of the 50.00% Fibo and the 100-hour SMA. Most likely, the rate will trade at 1.1400 level during the day. On the other side, the rate might break the medium pattern line at 1.1465 during today's US Employment data sets release at 12:30 GMT. Watch out for the news!
GBP/USD Analysis: Keeps To Surge
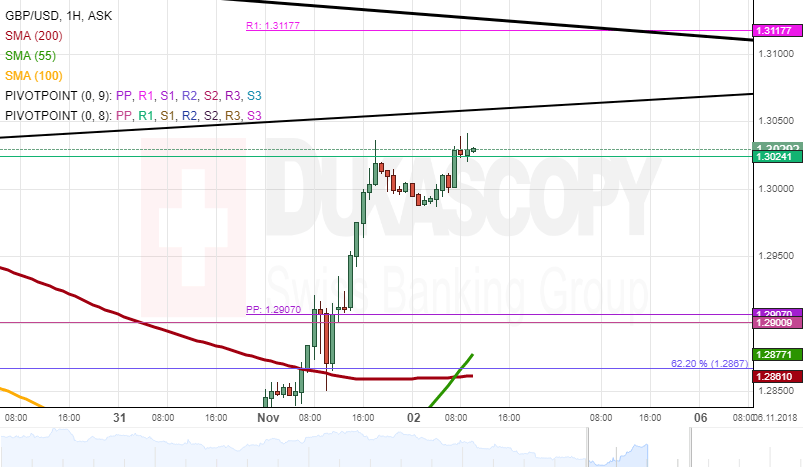
During Thursday's trading session, the British Pound broke the resistance of the monthly pivot point at 1.2907 to end the trading day at the 1.3000 mark. On Friday morning, the British pound broke the resistance of the weekly R1 at 1.3024 to trade at the 1.3023 mark.
In regards to the near-term future, the British Pound will bounce off the bottom boundary of the small pattern line at the 1.3055 mark. Most likely, the currency exchange rate will be retraced to trade sideways at the 1.2950 level during the day.
On the other side, the British Pound could break through the small pattern line during the UK Construction PMI data release at 9:30 GMT to trade at 1.3050 level.
XAU/USD Analysis: Will Meet Dominant Pattern Line
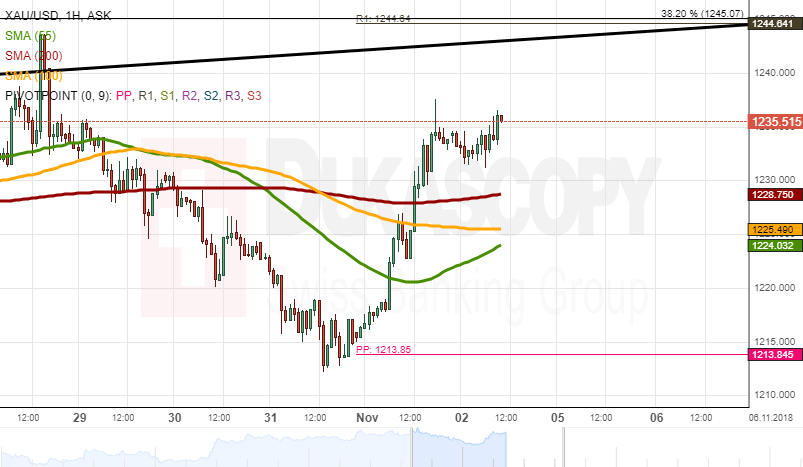
During Thursday's trading session, the yellow metal broke the resistances of the simple moving averages to end the trading day at the 1,232.46 mark. On Friday morning, the gold was trading sideways at the 1,232.00 mark.
In regards to the near-term future, most likely, the gold will surge upwards to bounce off the upper boundary of the dominant pattern line at the 1,240.00 mark. The simple moving averages should support the surge during the trading session.
On the other side, the gold could trade downwards if the US Dollar will appreciate during today's US Employment data sets release at 12:30 GMT. The 200-hour SMA should stop the yellow metal from depreciation to keep the rate at 1,230.00 level.
NZD/CHF 4H Chart: Breaches Resistance Cluster
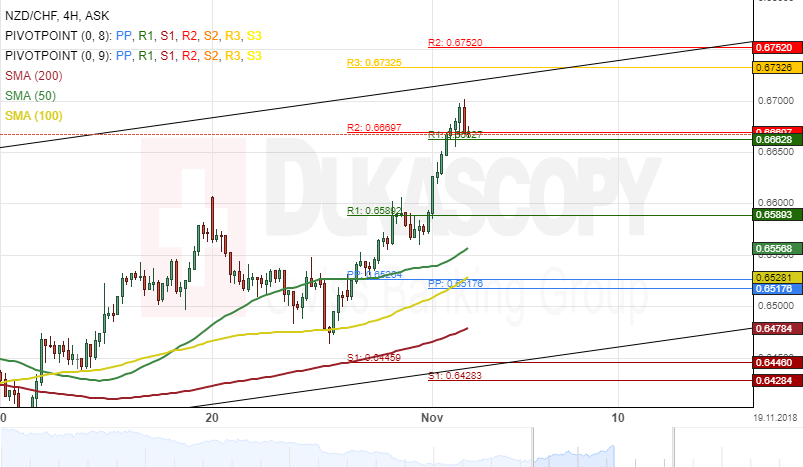
The NZD/CHF currency pair has been moving in an ascending channel after the it reversed from the bottom border of a dominant descending channel pattern on September 19.
Currently, the exchange rate is trading near the upper boundary of an ascending channel at 0.6681 during the morning hours of Friday's trading session. Moreover, the pair breached a resistance cluster formed by the combination of the weekly and the monthly PPs near the 0.6682 region.
Everything being equal, it is likely that the currency exchange rate makes a brief retracement south towards the weekly R1 at 0.6589 during the following trading sessions.
NZD/JPY 4H Chart: Bullish Sentiment Likely To Continue
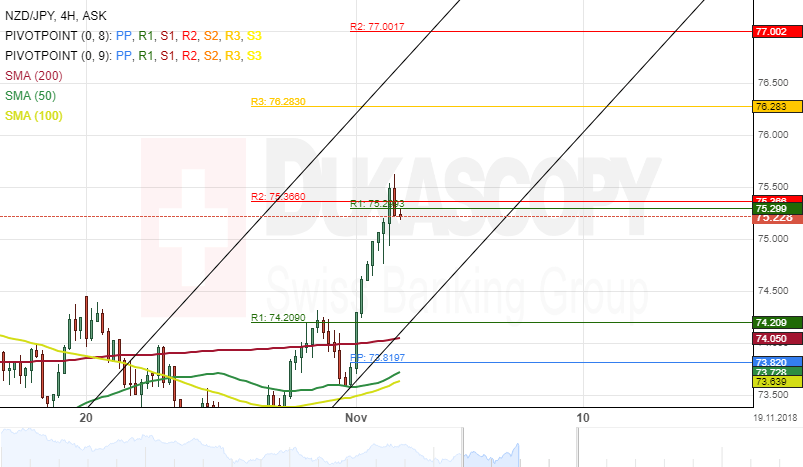
Bullish momentum has been dominating the New Zealand Dollar against the Japanese since the end of October. This sentiment began on October 26 and had since driven the currency pair towards September swing high of 75.50.
The exchange rate tested a resistance cluster formed by the combination of the weekly and the monthly PPs near the 75.29 area during the morning hours of Friday's session.
Given that the NZD/JPY currency exchange rate has breached the resistance cluster as mentioned above, the next target for bullish traders will be near the upper boundary of an ascending channel at 76.28 during the following trading sessions.
Elliott Wave Analysis: GBPUSD Update
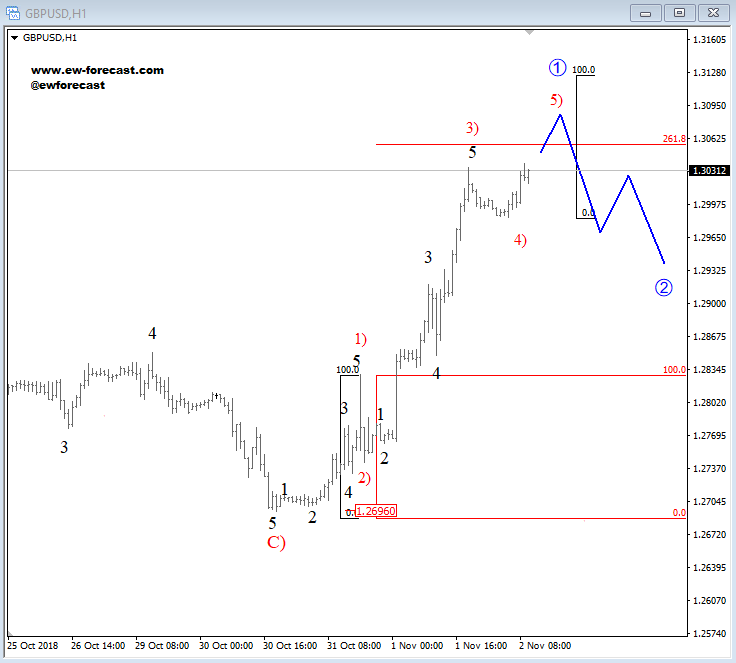
If you are bearish USD for the mid-term view, then cable can be one your watch-list since it has a very strong recovery from COt 30 low. I see an impulse in progress so more upside after a pullback will be expected. I will definitely be looking for wave 2 for possible longs, ideally from around 1.2900 area... if we get there. Short-term resistance is at 1.3060-1.3130.
GBPUSD, 1h
USD Tumbles As Investors Reload On Risk
Risk-reload will boost Euro
Over the past few months, it seems that employment-growth has lost its importance, as the equity sell-off and stronger US yields encourage investors to take a more balanced allocation. Today’s announcement of non-farm-payrolls (NFPs) will be no exception, as investors continue to reload on risk. In the longer-term, we maintain our long EUR view.
The greenback spent most of October rallying, with the dollar index rising more than 2% from 95.13 to 97.12. Even though US economic came in soft, global risk-off sentiment encouraged investors to maintain long USD bias. Data were even disappointing: August’s final Durable Goods Orders came in at 4.4% monthly, down from 4.6% in the previous month. The measure bounced back in September, up 0.8% versus a -1.5% median forecast. September’s NFPs printed well below median forecast (134,000 versus 185,000 expected), while inflation eased to 2.33% annually from 2.7% in August. Retail sales tumbled in September, but an upside surprise in GDP, 3.5% versus 3.3% expected, cheered investors.
Game theory says buy China
The Hang Seng and Shanghai composite rose 4.21% and 2.70%, capping for a strong week. The surge is due to reports that US President Donald Trump is looking to reach an agreement with China’s President Xi Jinping about their trade dispute. We believe dealmaker Trump has over-played his hand. He has threatened tariffs on the balance of China’s USD 500 billion-plus exports to the USA and so painted himself in the corner. By executing the full tariff, he will have no more firepower to negotiate: any dealmaker knows this position is unacceptable. The high probability is that Trump and Xi will reach an agreement at the Argentina G20 Summit in late November. This will suit both presidents’ need for showmanship.
Given this expectation, we are positive on Chinese assets. Just a glimpse of a US-China trade agreement has driven traders back into BRL, ZAR, TRY and INR high beta/high rerate correlated currencies. The rapid returns based only on media headlines indicates how critical this issue has become.
Forex Technical Analysis: EUR/USD, USD/JPY, GBP/USD
EUR/USD
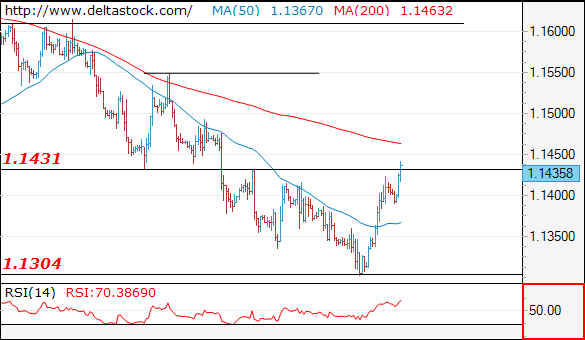
Current level - 1.1435
The outlook is positive after the minor consolidation pattern below 1.1430, for a rise towards 1.1550 and 1.1610. Crucial on the downside is 1.1390 low.
| Resistance | Support | ||
| intraday | intraweek | intraday | intraweek |
| 1.1550 | 1.1835 | 1.1390 | 1.1430 |
| 1.1610 | 1.2010 | 1.1300 | 1.1300 |
USD/JPY
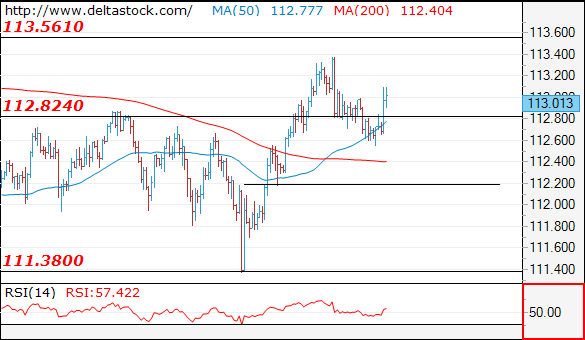
Current level - 113.01
My outlook is bearish again, for a break through 112.60 minor support, towards 112.20 zone.
| Resistance | Support | ||
| intraday | intraweek | intraday | intraweek |
| 113.50 | 114.40 | 112.60 | 111.65 |
| 114.40 | 114.40 | 112.20 | 110.40 |
GBP/USD
Current level - 1.3014
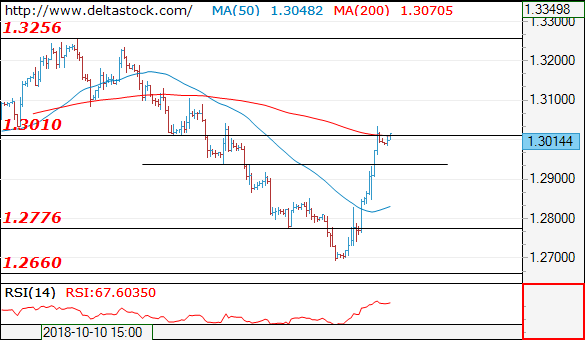
Yesterday's impulsive rise signals, that the reversal at 1.2690 has started the third wave of the prolonged consolidation above 1.2660 and the bias is bullish, for a continuation towards 1.3250-90 area. Initial intraday support lies at 1.2940 and immediate target is projected at 1.3100.
| Resistance | Support | ||
| intraday | intraweek | intraday | intraweek |
| 1.3100 | 1.3010 | 1.2940 | 1.2660 |
| 1.3250 | 1.3440 | 1.2850 | 1.2570 |