Sample Category Title
Week Ahead – Fed Meets Amid Stock Market Wobble; US Midterms and UK Q3 GDP also in Spotlight
The Federal Reserve will be holding its first monetary policy meeting next week since US and global stocks posted a sharp corrective move from record highs. Investors will be looking for some sign from the Fed that it’s paying attention to the recent negative developments in financial markets. Australia’s and New Zealand’s central banks will also be announcing their latest rate decisions. On the data front, this quarter GDP estimates out of the UK will be the highlight, along with Chinese monthly trade numbers. Meanwhile, in the political sphere, traders will be wary of any upsets for President Trump and his Republicans as Americans vote in mid-term elections.
RBA and RBNZ to stand pat
The Reserve Bank of Australia will be the first of the central banks to announce its decision next week, on Tuesday. The Bank is widely anticipated to keep rates at a record low of 1.5% for yet another month. While Australia continues to print solid economic data, inflationary pressures remain muted. This was once again highlighted this week when third quarter inflation fell below the RBA’s 2-3% target band. But fuelling exports drove the trade surplus to a two-year high in September.
The robust trade numbers lifted the Australian dollar to a 5-week high against the US dollar, but aussie traders will be cautious in leading the pair too high before the RBA’s Monetary Policy Statement on Friday. The quarterly report on the RBA’s latest economic projections will be watched for any changes to the Bank’s timeline of when rates are predicted to rise.
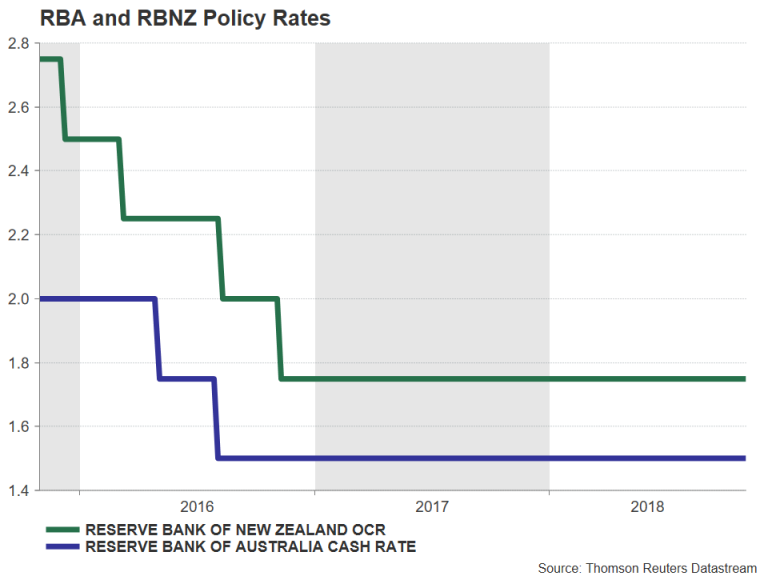
The Reserve Bank of New Zealand will follow the RBA with its policy decision on Thursday. No change in borrowing costs is foreseen from the RBNZ either, as the central bank waits to see whether business confidence will pick up before contemplating its next move. Prior to its decision, the RBNZ will be monitoring New Zealand employment figures due Wednesday. A drop in the unemployment rate and higher wage growth would further eliminate the odds of a rate cut and help the New Zealand dollar extend its gains to above the 5-week high of $0.6689 touched this week. However, it may be too soon for this as the jobless rate is expected to hold at 4.5% and the labour cost index is forecast to moderate to 1.9% year-on-year in the third quarter.
Chinese exports expected to maintain healthy growth in October
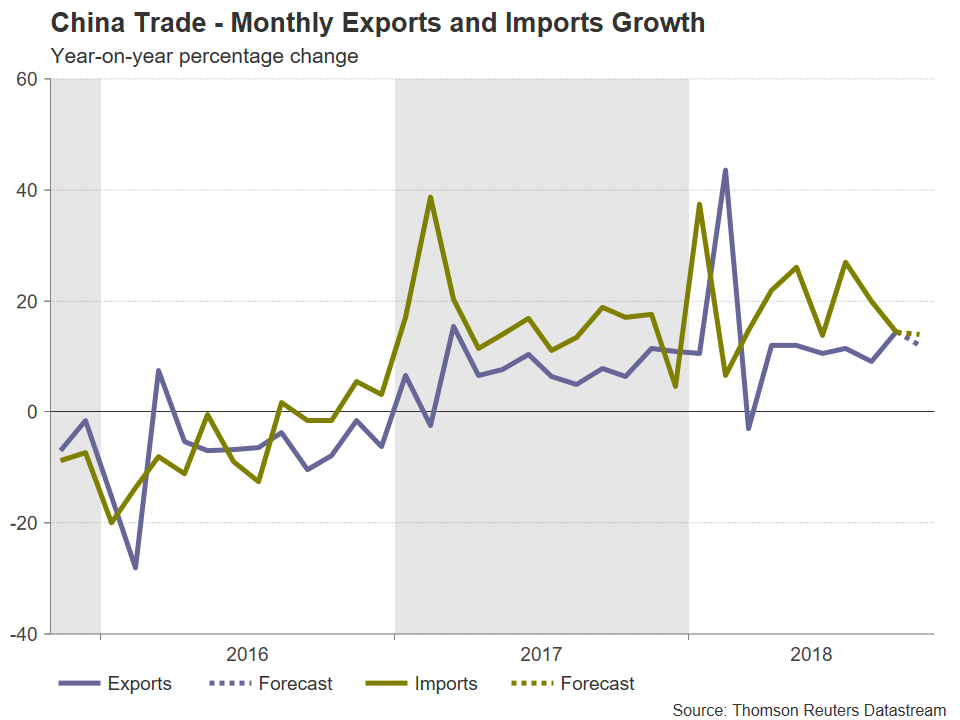
So far, there’s been little sign that exports from China are suffering from the country’s trade war with the United States. Rather, the slowdown in the economy is down to the deleveraging measures undertaken by the government and the cutback in state infrastructure projects. The impact of the US tariffs is still not expected to have filtered through yet, however. Figures due Thursday is forecast to show exports rising by 12% y/y in October, moderating slightly from 14.5%. Imports are also projected to grow by a solid rate in October, increasing by 14% y/y. In other data out of China next week, producer and consumer prices will be watched on Friday.
Japanese wages and BoJ Summary of Opinions eyed
The Bank of Japan kept monetary policy unchanged on Wednesday, but a downgrade of its inflation forecasts signalled the Bank will be sticking with its massive stimulus program for some time yet and this weighed on the yen. A summary of that meeting will be published on Thursday and should shed more light on what was discussed among BoJ board members. A dovish tilt in views could further drag the yen lower. The Japanese currency is less likely to see reaction to economic releases, however, as is typically the case. Household spending is up first on Tuesday, and after rising by the fastest pace in three years in August, annual growth in household spending is forecast to fall back to 1.6% in September. On Wednesday, attention will turn to earnings for any signs of rising wage pressures in September. Annual wage growth had jumped to 3.3% in June but decelerated sharply in July and August. The BoJ considers higher wages as a key factor in lifting inflation towards its 2% price goal. Finally, on Thursday, current account figures and machinery orders for September will be published.
German data to be main focus in Europe
European data will take a backseat next week with the main highlight likely to come from German industrial and trade indicators. Eurozone releases will include the sentix index on Monday, the final October PMIs from IHS Markit and September producer prices on Tuesday, and retail sales (also for September) on Wednesday. The euro will likely see a bigger reaction though to key figures out of Germany.
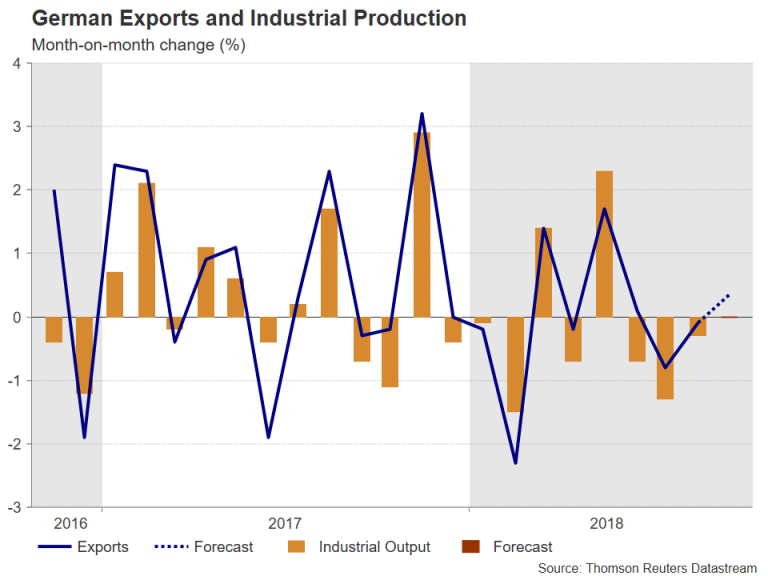
Industrial orders, out on Monday, are forecast to have declined by 0.5% month-on-month in September after surging by 2% in August. Industrial output will follow on Wednesday, where no change is expected, and on Thursday, the latest trade numbers are anticipated to show a 0.35% m/m rise in exports in September. Data out of Germany, the Eurozone’s growth engine, has been underwhelming in recent months and without any convincing signs of a turnaround, the euro is unlikely to see a sustained upside move, despite reclaming the $1.14 level this week.
UK to publish Q3 GDP numbers
Sterling rallied this week on rumours the UK and the EU have reached a tentative deal on giving British financial services firms access to the EU markets after Brexit. A slightly more hawkish tone by the Bank of England at its meeting on Thursday also bolstered the pound. An additional boost could come from next week’s services PMI (Monday) and preliminary GDP figures (Friday) where growth is expected to have accelerated in the third quarter. The UK economy likely expanded by 0.6% quarter-on-quarter in the three months to September, with the annual rate edging up from 1.2% to 1.5%.
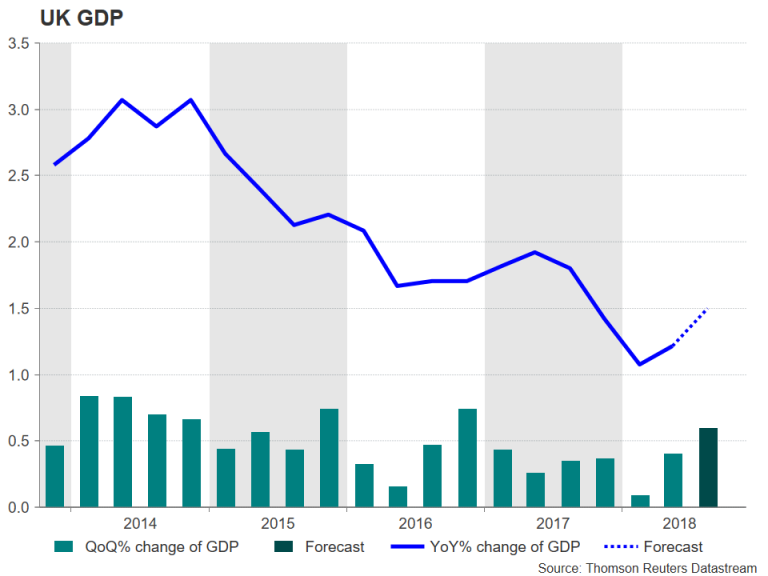
Data on September industrial and manufacturing production, as well as the trade balance, will also be released on Friday. Industrial output is expected to have declined by 0.1% month-on-month in September, while manufacturing production is forecast to have increased by a lowly 0.1% m/m.
Mid-terms and FOMC meeting on the dollar’s radar
The market’s focus in the coming days will firmly be on the US mid-term elections on Tuesday and the Federal Open Market Committee (FOMC) meeting on Wednesday-Thursday. But first up on the US calendar is the ISM non-manufacturing PMI on Monday. The closely watched index is expected to dip slightly in October from 61.6 to 60.0. The JOLTS job openings will follow on Tuesday, with the remainder of the releases (producer prices and the University of Michigan’s preliminary read on November consumer sentiment) coming up on Friday. The producer price index (PPI) will provide the first look at inflationary pressures in October. PPI for final demand is forecast to have risen 0.3% m/m in October.
The data will probably struggle for attention next week as all eyes will be on the Fed as well as on the mid-term elections on Tuesday, with the initial results likely to become available on Wednesday. The Republicans are expected to keep control of the Senate but could lose their majority in the House of Representatives. The US stock market and the dollar could come under selling pressure should the Republicans suffer worse losses as this would make it more difficult for President Trump to push through his agenda for the remainder of his term.
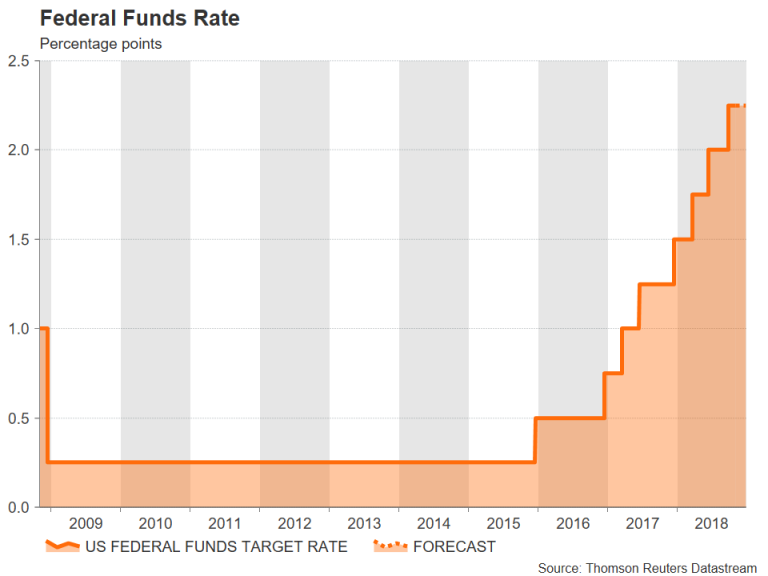
But even if the greenback was to get through the elections unscathed, there will be another test for the currency on Thursday, when the Fed announces its latest policy decision. The FOMC is almost certain to keep interest rates unchanged but markets will be hoping for a less hawkish tone in its policy statement given the weakening global growth outlook and concerns that the Fed is raising rates too fast, which have triggered a sell-off in global equities. Any indications from the statement language that policymakers are carefully watching market developments would be positive for risk-sentiment as this would signal that the Fed is ready to alter course should financial conditions tighten by too much.
Australia & New Zealand Weekly: RBA Will Stick to Positive Forecasts but Risks are Mounting
Week beginning 5 November 2018
- RBA will stick to positive forecasts but risks are mounting.
- RBA: policy meeting, Statement on Monetary Policy.
- Australia: housing finance.
- NZ: RBNZ policy meeting, employment, wages, inflation expectations.
- China: trade balance, foreign reserves, CPI.
- Europe: Sentix investor confidence.
- US: FOMC meeting, mid-term elections.
- Key economic & financial forecasts.
Information contained in this report current as at 2 November 2018.
RBA Will Stick to Positive Forecasts but Risks are Mounting
The Reserve Bank Board meets next week on November 6.
The Bank will also release the November Statement on Monetary Policy on November 9.
Of course the Governor will announce that there has been no change in the cash rate.
Readers will be aware that Westpac adopted a "no change" call for both 2018 and 2019 back in September 2017. At that time markets were pricing in three hikes by end 2019.
Today, markets are pricing only the probability of around 50% of one hike by end 2019 and a full 25bps is not priced-in until end 2020.
Back in August this year, Westpac forecast that the cash rate would remain on hold in 2020.
So, while a year ago we were offering readers some forecasts that were significantly at odds with market pricing, our views today are now largely factored in by the market.
That does not mean that our views are universally supported. In the latest Bloomberg survey of economists' forecasts, only 10 of the 24 forecasters expect the cash rate to be on hold (one is calling cuts) by end 2019. In addition, 9 of those 13 forecasters expecting rates to be rising expect multiple hikes. Note that the other three major Australian banks expect rate hikes next year.
So the case for rates on hold is certainly not a universally accepted one.
As usual we will scour the Governor's statement next Tuesday for any hints towards a firmer tightening bias, but there is unlikely to be much to encourage these efforts.
The Statement's themes will be the same: continuing global expansion; China slowing a little; international trade uncertainty; Australian growth to average a bit above 3% in 2018 and 2019; positive business conditions; household consumption a source of uncertainty; labour market outlook positive; wages growth low; but a gradual lift in wages growth expected; further gradual decline in the unemployment rate expected; inflation higher in 2019 and 2020; housing conditions in Sydney and Melbourne continue to ease; progress toward full employment and target inflation will be gradual.
The Statement on Monetary Policy will include an update of the Bank's forecasts out to December 2020.
Forecasts for GDP growth are likely to be unchanged from the August Statement on Monetary Policy: 3.25% in 2018 and 2019; and 3% in 2020. These forecasts indicate above potential growth, which is generally accepted to be 2.75%.
Headline Inflation forecasts in August were 1.75% in 2018; 2.25% in 2019; and 2.25% in 2020.
With higher petrol prices than were expected in August, the RBA may raise its forecast for headline inflation in 2018 from 1.75% to 2%.
Underlying forecasts for inflation were 1.75% in 2018; 2% in 2019; and 2.25% in 2020.
These forecasts are likely to be unchanged.
On October 31, we received the Inflation Report for the September quarter of 2018. The key underlying measures would have disappointed the RBA. The annual pace of the average of the core measures further slowed to 1.7% from the 2.0% pace in the March quarter. The six month annualised pace of the core measures is now 1.5% - the slowest pace since September 2016. Recall that in May 2016, the then Governor Stevens was expecting 2.5% for core inflation through 2016 but revised that down to 1.5% following the release of the March quarter CPI. The Governor responded to that shock with a rate cut of 25 basis points in May and another in August.
At that time, the 6 month annualised pace of core inflation registered 1.4% through the March quarter and 1.2% through the June quarter. So momentum in inflation was indeed lower than current momentum but not by a significant margin. The longer the subdued 1.5% momentum continues, the harder it will be to justify the forecasts of 2% in 2019 and 2.25% in 2020.
One aspect of the detail within the September quarter 2018 CPI result that stood out was the sharp fall in the price pressures associated with house building. This component, which has the biggest weight in the CPI and consistently appears in the core measures, slowed from 0.8% in the June quarter to 0.1% in the September quarter.
We had a similar result for the March quarter in 2016 (0.2%) but the measure bounced back 0.9% in the June quarter as the housing market recovered through 2016 in response to the May and August rate cuts. Between March 2016 and December 2016 new lending to property investors lifted by 40% and house prices in Sydney (up 11%) and Melbourne (up 7%) both boomed in the last six months of 2016.
There will be no such recovery in 2018 or 2019. The RBA has made a clear commitment to holding the cash rate at the current level and bank lending policies continue to tighten and house prices in Sydney and Melbourne are likely to fall through 2019.
As a comparison with 2016, we note that new lending to investors has fallen by 27% over the last year and there is no sign of any relief.
It is entirely reasonable that builders in the process of constructing new residential developments in Sydney and Melbourne will find great difficulty in passing on cost increases as this particular component of the CPI has remained weak for many quarters. Supply is also likely to maintain downward pressure on rents which are another key component of the CPI. We would not expect the RBA to incorporate such concerns in their forecasts. They will continue to forecast rising inflation out to 2020 despite the risks around housing as well as the ongoing threat to inflationary expectations as the headline rate stays well below the 2.5% target (on a calendar year basis headline inflation has been below 2% since 2014).
The final forecast which appears in the SOMP will be for the unemployment rate.
The forecast in the August SOMP were for a gradual decline to 5.25% in December 2019 continuing to 5% in December 2020.
That was always a very awkward forecast for the RBA which is promoting the prospect of rising wage pressures particularly through 2019 and 2020.
For Australia, the "full employment" rate estimate is generally considered to be 5.0% but we have found that in other developed economies (particularly the US and UK) the full employment rate is lower in the current cycle than that historically. In the US, the unemployment rate has fallen to 3.7% (well below the previously accepted full employment rate of 4.75%) yet wage pressures are only just beginning to emerge, (the Employment Cost Index has lifted by 2.8% in the year to September).
It seems highly unlikely that in this current world of increasingly rapid technological change; globalisation; risk aversion of employees; low inflationary expectations and low trade union membership that Australia's full employment rate is 5%.
With the current print (September) on the unemployment rate now at 5.0% (compared to 5.5% in the August SOMP) the RBA is expected to lower its 2020 unemployment forecast to 4.75%.
Note that the RBA use the three month average of the seasonally adjusted monthly unemployment rate estimate, which is currently 5.2%, as their latest read. That recognises the volatility in monthly estimates and the potential for the recent sharp fall in the unemployment rate to reverse somewhat over the next few months. Abstracting from the short-term particulars, the core profile of the forecast will be consistent with the key theme of a "gradual decline in the unemployment rate".
In contrast, Westpac's forecast reflects a likely slowdown in jobs growth in 2019 with the unemployment rate ticking up to 5.3% through 2019 before settling back at 5.0% by end year. In 2020 we would broadly concur with a 4.75% unemployment forecast by end 2020 although would not see that level as full employment.
Note that the August SOMP discussed the dynamic around the wealth effect as a risk but not a central theme driving the forecasts.
"Recent declines in national housing prices have been gradual and follow several years of very strong growth. Accordingly, there is no evidence that moderate housing price declines have weighed on household consumption to date. Nevertheless, housing assets account for around 55 per cent of total household assets, so lower housing prices could lead to lower consumption growth than is currently forecast. Although the earlier gains in national housing wealth may not have encouraged much additional consumption, it is possible that the consumption decisions of highly indebted and/or creditconstrained households could be more sensitive to declines in housing prices than to the previous increases."
We expect this issue to remain a risk in the November SOMP but not a factor incorporated into the forecasts.
We view that risk as being much more likely and a central component behind our growth forecasts.
Westpac expects growth in 2019 to slow from 3.3% in 2018 to 2.75% in 2019.
The week that was
This week, inflation and the housing market have been in focus for Australia. Offshore, data for the US remained robust, but was less so in Europe and Emerging Asia.
Australian inflation has been an enduring disappointment for the market, with actual outcomes having come in below expectations quarter by quarter for close to two years. The September quarter continued this trend, with headline and the average of the core measures again sub-consensus at 0.4% (market 0.5%) and 0.3% (market 0.4%). More significant for policy, annual headline and core inflation again fell below the 2.0%yr lower bound of the RBA's inflation range, now 1.9%yr and 1.7%yr. Within the quarter, there were many opposing influences, but the main theme was the offsetting of petrol and tobacco inflation by disinflation across house purchase costs and rents and the continued absence of pricing power for the retail sector. Though petrol will remain inflationary in coming months, persistent weakness in housing costs will limit the net effect for headline inflation. As the core measure typically omits energy costs, the effect here will be lopsided and result in annual core inflation holding below the RBA's 2–3%yr target range through the end of 2019.
The soft housing inflation pulse is a consequence of declining house prices and rising supply (restricting rental growth). This week, the October CoreLogic house price data showed that this national decline in house prices is continuing. The decline is led by Sydney (–7.4%yr) and the top end of the market (the top 25% of sales by price down 7.7%yr versus –0.9%yr for the bottom 25%). However, we continue to see evidence of the weakness broadening, with 80% of dwellings now having seen price declines over the past six months compared to 60% for the past year. By dwelling type, losses remain largest for houses.
Dwelling approvals data for September was also released this week. While a bounce was seen in the month, approvals are still down 14% over the year. Further, if high-rise approvals in Victoria are omitted, we estimate approvals actually fell 7.5% in September, with the weakness broad-based by state and dwelling type. Given this trend decline in prices and approvals, it is unsurprising that housing credit growth continues to decelerate. In 3-month annualised terms, total housing credit has slowed from 6.8% in May 2017 to 4.7% currently. Though investor credit has been the primary driver of this softening, owner-occupier credit has also slowed, from 8.7% in July 2017 to 6.4% currently.
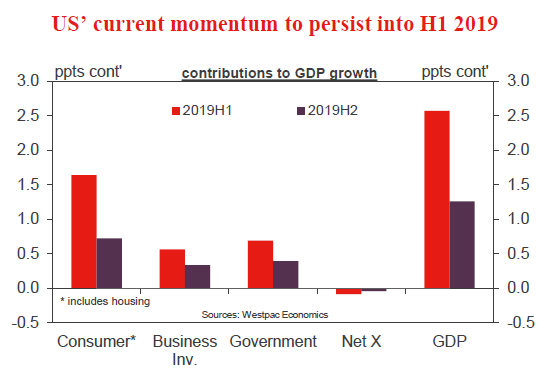
Turning to the US, GDP was again strong in the September quarter at 3.5% annualised. Driving the result was a willing consumer, with growth in this sub-sector rising 4.0% annualised. Elsewhere however, there were a number of signs that higher interest rates are taking effect. This was most obvious in residential construction, now down around 3% annualised over the past nine months, while there are glimpses of weakness in business investment following a strong start to the year. For growth to persist at an above-trend pace, consumption must continue to fire. On this front, the upside surprise for the employment cost index in the third quarter, a 0.8% gain for total compensation, was promising. That said, annual income growth still remains relatively modest at 2.8%yr. To sustain the current pace of consumption, quarterly gains nearer 1.0% are needed. We are not convinced this will occur. If consumption does slow, then together with a softening pulse for business investment and the loss of extraordinary support from fiscal policy (in late 2019), US growth will slow back to trend during 2019.
While debate over the US economy remains focused on whether growth will be at or above trend, for Europe the risk of sub-trend growth is building. The first estimate for the September quarter has disappointed, coming in at just 0.8% annualised, below our estimate of trend growth, 1.2%yr. One-off factors were reportedly at play in the most recent three months, so more time is arguably needed to assess the trend. Looking forward, domestic political risks are paramount. This week, the source of uncertainty was in Germany with Chancellor Merkel announcing that she will not contest her CDU Party leadership this December but remain as Chancellor until the end of the Coalition's term in 2021, but will not stand for re-election.
In the UK, the Brexit deadline grows nearer. With those clouds up ahead, the BoE left rates on hold this week while retaining their gradual tightening bias. The economy is described as "broadly in balance" with the domestic labour market tight and wages growth picking up more than expected. Indeed, if it were not for Brexit uncertainty, the Bank rate would be higher.
Finally to Asia, there we have seen moderating global growth and US trade policy continue to weigh on the manufacturing sector of China and other east Asian nations. For China in particular, domestic demand remains a positive, aided of late by stabilising investment but the downtrend in employment growth poses a risk. This highlights why authorities are becoming more active in the management of the domestic economy and US' tariffs effect on China's external competitiveness.
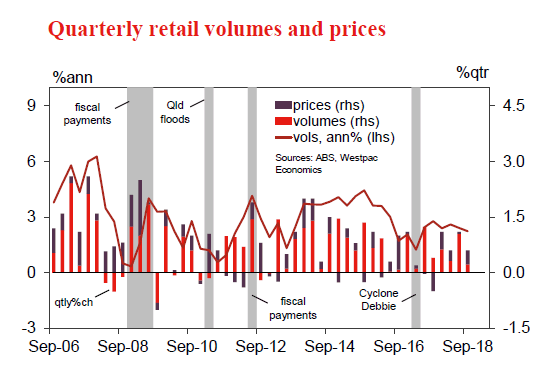
Chart of the week: Australia Q3 nominal and real retail sales
The September retail report was on the soft side, monthly sales coming in a touch under expectations, the quarterly gain in real retail sales also below expectations and the previous quarter's strong gain pared back. While some of this reflected a stronger than expected price gain, there was a fair bit of evidence in the survey detail suggesting that discretionary spending is slowing and hints that the turnaround in housing markets in Sydney and Melbourne may be starting to affect demand.
Monthly sales rose 0.2%, a touch short of the consensus forecast of 0.3% but in line with Westpac's view.
However, sales volumes for the quarter were more underdone, rising 0.2% vs consensus and Westpac forecasts of a 0.4% gain and with Q2's strong 1.2% gain revised back to a 1% increase.
New Zealand: week ahead & data wrap
Financial media in New Zealand has been abuzz with stories of falling equity prices in the US, and falling house prices in parts of Australia. The implication is that New Zealand will be affected – an idea that is far too simplistic.
There will be very little direct impact on the New Zealand economy from either falling US share prices or falling Australian house prices. New Zealanders are not big owners of Australian property, international equities, or even New Zealand equities, so there won't be much in the way of a wealth effect. We've seen claims that New Zealand house prices tend to follow Australia's, but these are simply untrue – the two countries often experience distinct housing cycles. When we prepare our forecast of New Zealand GDP growth for our next Quarterly Economic Overview, neither US equity prices nor Australian house prices will be major factors in our thinking.
That said, what is happening in the US and Australia does serve as a warning of sorts for New Zealand. It is probable that in the future New Zealand will suffer parallel situations for parallel reasons.
In the United States, the strong economy is generating fears of inflation, and consequent fears of higher interest rates. When interest rates rise, investors tend to find bonds more attractive. Consequently, they demand a higher rate of return before investing in equities – which can only be achieved by paying a lower price in the first place. Share prices in the US have been weaker this year mainly due to rising interest rates.
The parallel for New Zealand would be house and farm prices falling when local interest rates eventually rise. The key reason that New Zealand house and farm prices have risen in recent years is record-low mortgage rates, which made it cheaper to borrow and made other forms of saving, such as term deposits, less attractive. Our analysis suggests that when New Zealand interest rates rise, house and farm prices will fall.
That would certainly be serious for the New Zealand economy. Kiwis have an extremely high proportion of their wealth tied up in houses and farms, and tend to consume less when the prices of those assets fall. A house and farm price downturn would also hit the economy via the banking system. A high proportion of bank loans in New Zealand are secured over property. When banks see their security buffers eroding, they tend to become less keen to lend to productive parts of the economy, which crimps growth.
But any likelihood of rising interest rates impacting New Zealand asset prices is years away, and is not a factor in the very nearterm outlook. In fact, New Zealand recently experienced a drop in fixed mortgage rates which we expect will boost house prices in the immediate future.
Declining house prices in parts of Australia have been more to do with regulation. Bank lending standards have tightened at the regulator's behest. This has reduced households' access to credit, leaving them less able to pay for property. At the same time, changing rules are making it more difficult for foreign buyers to purchase property in Australia. Together, these two factors have been important drivers of Australia's housing market downturn. New Zealand's housing market could well be affected by similar drivers in the future. New Zealand has recently introduced a foreign buyer ban. That probably is an imminent negative for New Zealand's housing market, and will suppress Auckland house prices in particular.
New Zealand could be affected by Australia's tighter banking regulations, because the biggest New Zealand banks are all wholly owned subsidiaries of Australian parents. But we are expecting the Reserve Bank of New Zealand to loosen its LVR mortgage lending restrictions when it delivers its next Financial Stability Report on 28 November. New Zealand banks could soon be loosening their lending standards, not tightening them. So credit conditions are more likely to boost the housing market in the near term, rather than constrain it.
A third factor affecting Australia's housing market has been a lift in mortgage rates independent of the Reserve Bank of Australia. This followed a lift in funding costs for Australia's banks. Again, New Zealand is currently experiencing falling mortgage rates, not rising. New Zealand has not experienced a lift in bank funding costs to anything like the same degree as Australia. So while this is something for New Zealand to watch, it is not a factor in the immediate outlook.
Weighing the near-term positives against the near-term negatives, we remain very comfortable with our view that New Zealand's housing market and economy will pick up a little in the very near term. However, further in the future we do expect an extended episode of falling house prices that will crimp consumer spending and therefore slow the economy. Rising mortgage rates and changing tax policy will eventually come to bear on house prices. But that expected downturn will be for local reasons and on New Zealand's own timetable, not simply because we are destined to follow other countries.
Next week will be critical for financial markets. We expect the September quarter labour market surveys, released on Wednesday, to register another small rise in unemployment, from 4.5% to 4.6%. The labour market is cooling a little following the economic slowdown that occurred over 2017.
The following day, the Reserve Bank will release its November Monetary Policy Statement. We expect the Reserve Bank to acknowledge the recent run of strong economic and inflation data in the detail of the document, and by lifting the OCR forecast slightly. However, we expect the RBNZ to stick to the same broad outlook for monetary policy, including retaining the key line that the next move in the OCR could be "up or down." Such a "slightly hawkish" Statement would produce only a minor upward move in swap rates and the NZD.
Data Previews
Aus Nov RBA policy decision
- Nov 6, Last: 1.50%, WBC f/c: 1.50%
- Mkt f/c: 1.50%, Range: 1.50% to 1.50%
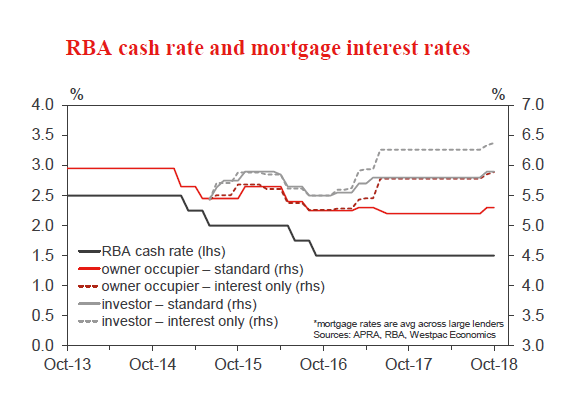
The RBA will again hold rates unchanged at their November meeting, as they have since they last cut rates in August 2016. The Governor's decision statement will repeat the line that: "further progress in reducing unemployment and having inflation return to target is expected, although this progress is likely to be gradual". We expect the RBA cash rate to remain unchanged at 1.50% throughout 2018, 2019, and during 2020.
This month's decision will be followed by the release of updated commentary and forecasts with the RBA's Statement on Monetary Policy on Nov 9. We expect the Bank to retain its upbeat 3.25% growth forecasts for both 2018 and 2019 with no change to its trajectory for inflation. But a lower starting point is likely to lower the forecast profile for the unemployment rate. See p2 for more detail.
Aus Sep housing finance (no.)
- Nov 9, Last: –2.1%, WBC f/c: –1.0%
- Mkt f/c: -1.0%, Range: -2.2% to 0.5%
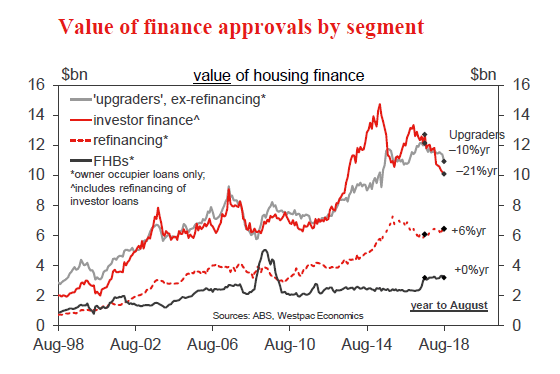
Housing finance approvals continued to soften in August. The headline number of owner occupier loans fell 2.1% to be down -10.2%yr. The value of investor loans was also lower, down 1.1% to be 20.5% lower over the year (an estimated -26% ex refi).
The September update is likely to be another weak one. Housing markets continued to correct in the month, auction clearance rates again moving lower and prices slipping across all major cities. Industry data points to a 1% dip in the number of finance approvals with a more substantive fall in the value of approvals suggesting a significant reduction in average loan size, in turn reflecting a reduction in assessments of borrowing capacity. The value of investor loans will again be of interest.
NZ Q3 Household Labour Force Survey
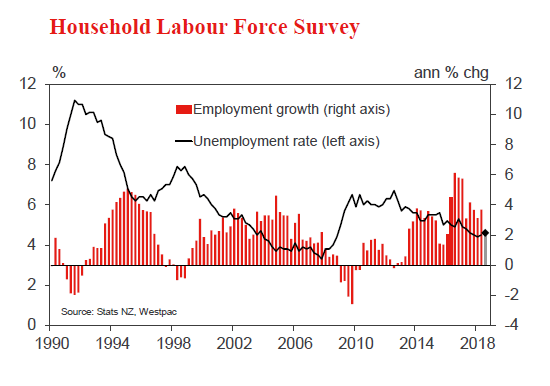
- Nov 7, Employment change, Last: +0.5%, WBC f/c: 0.5% Mkt f/c: 0.5%, Range: 0.3% to 0.7%
- Unemployment rate, Last: 4.5%, WBC f/c: 4.6% Mkt f/c: 4.5%, Range: 4.4% to 4.6%
We expect the September quarter survey to show a small rise in the unemployment rate for the second quarter in a row. A modest 0.5% rise in employment would see annual growth slow to 2%.
Recent indicators of labour demand have been mixed. Business confidence surveys have shown a sharp drop in hiring intentions, but job advertisements have continued to grow, albeit at a slower pace.
A rise in the unemployment rate would be unwelcome for the Reserve Bank, given its recently-added focus on maximum sustainable employment. However, there will be little time to consider the results before the Monetary Policy Statement.
NZ Q3 Labour Cost Index
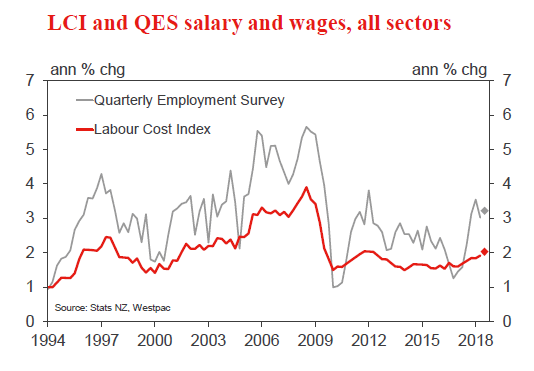
- Nov 7, Private sector last: 0.6%, WBC f/c: 0.6%
- Mkt f/c: 0.5%, Range: 0.4% to 0.7%
We are expecting a 0.6% rise in the Labour Cost Index for all sectors, with private sector growth of 0.6%. In both cases this amounts to annual growth of 2%.
Wage growth this quarter will be boosted by the first stage of the nurses' pay agreement, with a 6% increase that covers about 1% of the total workforce. We'll also see the second stage of the pay equity settlement for aged care workers, though the impact is much smaller than in the first stage a year ago.
The June quarter survey showed early signs of a pickup in private sector wage growth. However, the LCI tends to evolve very slowly, which makes it difficult to judge whether there has been a genuine change in the trend.
NZ Q3 RBNZ survey of inflation expectations
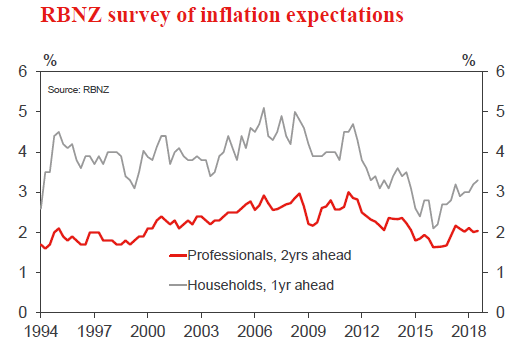
- Nov 7, Two years ahead, last: 2.04%
Since the last RBNZ survey of expectations, we've seen GDP growth surprising to the upside, a larger than expected increase in consumer price inflation and widespread public attention on petrol prices. More generally, businesses are highlighting upside pressure on prices and costs.
The RBNZ's two year ahead inflation expectations measure (the most closely watched of the gauges the RBNZ puts out) tends to be more stable than other measures of expectations due to its longer-term focus. However, with signs of growing pressure on costs and other positive data in recent months, the risks are tilted towards at least some increase.
NZ RBNZ Official Cash Rate and Monetary Policy Statement
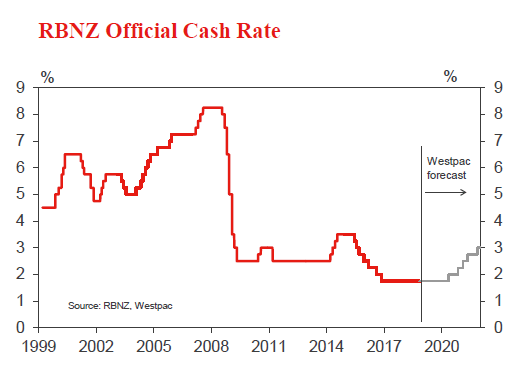
- Nov 8, Last 1.75%, WBC f/c: 1.75%, Mkt: 1.75%
We expect the RBNZ will leave the OCR on hold at 1.75% at its November meeting. However, as activity and inflation developments have been stronger than the RBNZ expected, the accompanying policy statement will be at least a little more hawkish than the August missive (though any change will be minor and will be confined to the details of the document).
We expect the RBNZ to stick to the same broad monetary policy outlook, including restating the all-important phrase that the next move in the OCR could be "up or down" and that it "intends to keep the OCR at an expansionary level for a considerable period."
The RBNZ's August OCR forecast was flat at 1.8%, before starting to rise in September 2020. That putative date for OCR rises could be brought forward by one or two quarters.
NZ Oct retail card spending
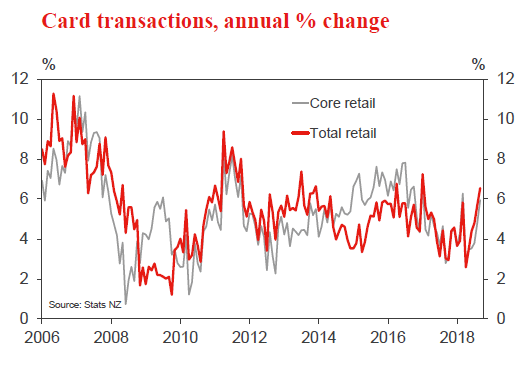
- Nov 9, Last: +1.1%, WBC f/c: +0.5%
Retail spending levels rose by a solid 1.1% in September, following a similar sized gain in August. Those gains were underpinned by increased spending on consumables (e.g. groceries), as well as firm spending on durables. Spending levels have been boosted by the Government's Families Package, which has added to the disposable incomes of many households.
We expect more modest spending growth in October and are forecasting a 0.5% gain in the month. While the lift in disposable incomes has added to the level of spending, higher fuel prices are limiting increases in discretionary expenditure in core categories.
US November FOMC meeting
- Nov 7-8, last 2.125%, WBC 2.125%
The FOMC has persistently focused on the US' own real economy in 2018. As a result, their belief in a continued 'gradual normalisation' of monetary policy has remained resolute.
Come the November meeting, there is no reason to expect a material change in view, though rates will not be raised. Employment growth has remained strong, so too GDP.
The nascent evidence of interest rate sensitive sectors coming under pressure is unlikely to concern the Committee at this stage with policy still seen as accommodative. This is also true of recent market declines as equities remain at elevated levels.
For the FOMC, next week's mid-terms have little to no immediate significance. Fiscal policy will become an issue from mid-to-late 2019, as support for growth fades.
Weekly Focus: Global Slowdown
Market Movers ahead
- The US mid-term elections will attract a lot of attention but are unlikely to lead to any changes in economic policy.
- The FOMC meeting is a small one and we do not expect any policy or signal changes.
- In Europe, keep an eye on politics in Italy and Germany.
- The UK is likely to strong GDP figures for Q3, but more interestingly, we will also get indicators for Q4, which might well be weaker.
- Trade and FX reserve data out of China will shed light on the effects of the trade war and the scale of the intervention to support the CNY in October.
- Norwegian price data is likely to indicate a slowdown in core inflation.
Global macro and market themes
- Global growth data disappointed, with weak GDP numbers for the euro area, lower new orders in the US and a nosediving PMI in China.
- Italy avoided a downgrade from rating agencies, but still seems uncompromising on the budget. It is now also facing stagnation as growth in Q3 was zero.
- US labour costs showed the highest growth in 10 years.
- In contrast, Swedish wage growth remained muted.
GBPUSD Outlook: Limited Impact from Upbeat US NFP Data But Bulls May Hold in Extended Consolidation Before Resuming
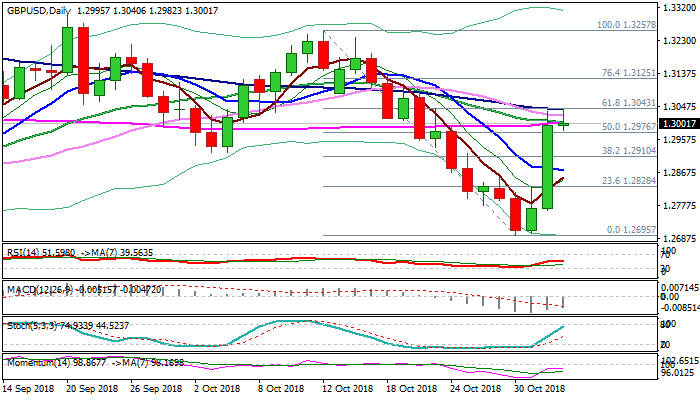
Cable dipped to the session low at 1.2982 after US jobs data beat, which inflated dollar, but pound's weakness was so far limited.
US No-Farm payrolls jumped to 250K in Oct, well above Sep downward-revised at 118K and forecast for 193K, marking the third highest result in 2018.
US unemployment remained unchanged at multi-decade low at 3.7% and average hourly earnings came in line with expectations at 0.2%, making US jobs report positive overall. Solid numbers in October signal further tightening in the US labor market which would support Fed's intention to increase interest rate one more time this year in December. Pound received support earlier today from upbeat UK construction PMI data (Oct 53.2 vs 52.0 f/c) and remains support by positive Brexit news, which so far prevented stronger losses on upbeat US jobs data.
On the other side, dollar's support from solid NFP could be partially offset by the latest news which dismissed media reports that President Trump was preparing for possible trade deal with China.
Cable's near-term sentiment remains firmly bullish on Brexit deal optimism, but bulls may take a breather after repeated failure at strong technical barrier at 1.3043 (Fibo 61.8% of 1.3257/1.2695/10SMA). Momentum studies on daily chart turned sideways and support the notion, with broken daily cloud base (1.2980) holding dips and maintaining firm bullish stance.
Today's close will be watched for fresh signals, as repeated close above cloud base would keep bulls intact for fresh attempts higher after consolidation.
Conversely, bulls might be paused for deeper pullback if weekly close occurs below daily cloud base.
Double-Fibonacci support at 1.2909 (broken Fibo 38.2% of 1.3257/1.2695/Fibo 38.2% of 1.2695/1.3040 upleg) marks pivotal point, where deeper pullback should find ground and keep fresh bulls in play.
Res: 1.3043; 1.3095; 1.3125; 1.3192
Sup: 1.2980; 1.2959; 1.2921; 1.2909
Canada: October Sees a Few More Jobs
On net, 11.2k more Canadians were at work in October. Fewer of us were looking for work, helping send the unemployment rate a tick lower to 5.8%
Continuing the see-saw pattern of late, full-time employment was in the driver's seat, with 33.9k net positions added. Part-time work fell 22.6k. The overall gains were driven by the private sector (+20.3k) as public sector employment pulled back (-30.8k), leaving a 21.8k gain in self-employment as the deciding factor.
The gains in employment were concentrated among core-aged (25 to 54) workers, up 31k on net. Those aged 55+ also saw gains (+19k), which means that those aged 15 to 24 saw a sizeable pull-back of 39k.
On an industry basis, the goods sector pulled back (-12.0k), while the service sector added 23.2k, with notable gains in trade (19.2k), business support services (+22k), and healthcare (+15.3k). Only Quebec saw employment gains of note, adding 9.1k as performances were flat in the other provinces.
Aggregate hours worked edged up just slightly (+0.1% month/month, or +0.7% year-on-year). Hourly wages for permanent employees decelerated for a fifth month, gaining just 1.9% year-on-year.
Key Implications
Don't let the headline drop in unemployment fool you, this was a soft report. The decline in the unemployment rate can be largely put down to fewer Canadians engaging with labour markets, not an encouraging sign. And while the economy managed to add jobs on net, and full-time ones at that, these gains are all due to self-employment – not necessarily a bad thing, but hardly a picture of strength.
If there is a bright spot in the report, it may, oddly enough, be in the noise. The heightened volatility over the summer months may be due to changes in seasonal employment. Youth employment holding back the overall figure for October suggests that this effect may still be in play and so this month's figures need to be taken with an even larger grain of salt than normal.
In light of communications around last week's Bank of Canada policy interest rate hike, the wage component was bound to be even more closely watched than usual. In the event, the figures were again disappointing, with wage gains slowing for a fifth straight month. At 1.9% year-on-year, wage growth, at least as measured by this survey, is back below even core inflation.
As discussed in a recent report, income growth will be crucial in enabling households to manage debt loads in a rising rate environment, and by extension a key determinant of the pace of future Bank of Canada interest rate hikes. Past Bank of Canada communications have suggested that today's report doesn't carry much weight, with more emphasis placed on less timely (but less volatile) measures, which have so far been holding up well. On balance, today's data doesn't help the case for an accelerated pace of tightening, but still leaves January a reasonable target for the next move up.
US NFP: Payrolls Bounce Back Strongly After Hurricanes Pass
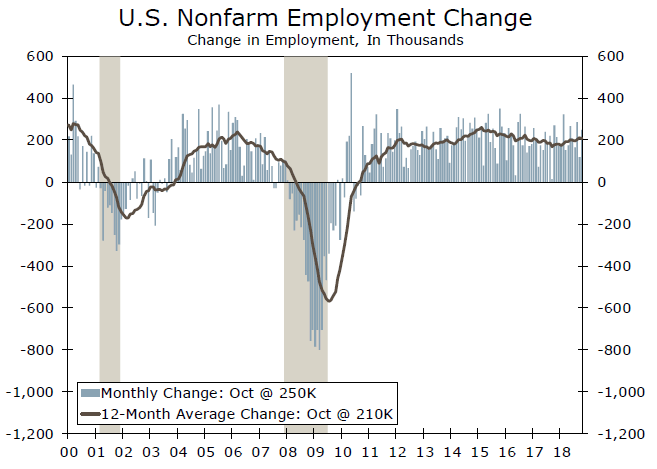
Nonfarm employment shot up by 250K in October after hurricane-distorted weakness in September. The unemployment rate held steady, but average hourly earnings rose at the highest rate in this cycle.
Employment Rose Strongly in October
Data released this morning showed that nonfarm payrolls jumped by 250K in October (top chart), which was stronger than most analysts had expected. Despite the sizeable increase in payrolls, the unemployment rate remained unchanged at 3.7% because the labor force rose by 771K during the month. Average hourly earnings rose by 0.2% in October, which matched the consensus forecast.
The strong rise in payrolls in October represents, at least in part, statistical payback for the hurricane-distorted weakness in employment in September. Specifically, jobs in the trade and transportation sector, which contracted by 8K in September, bounced back by 36K in October. Retail trade jobs plunged by 32K in September but rose by 2K last month. Employment in the leisure and hospitality sector was flat in September, but shot up by 42K in October. Of note, jobs in the manufacturing sector rose by 32K in October, the 15th consecutive month of job gains in this sector. Manufacturing employment has risen by 1.3 million jobs since bottoming in early 2010.
Smoothing through the monthly volatility in the overall payrolls number shows that nonfarm employment rose by an average of 218K per month during the August-through-October period, which is in line with the average monthly gain over the past 12 months. In other words, the trend of strong employment gains remains intact.
Labor Market Continues to Tighten
As noted above, the unemployment rate held steady at 3.7% in October. That said, the data show that the labor market tightened further. The U-6 unemployment rate, which is a broader measure of joblessness because it includes workers who have become discouraged and left the labor market (among a few other categories of workers), rose to 7.4% in October from 7.5% in September (middle chart). Not only is this rate of unemployment the lowest in the current cycle, but it is within spitting distance of the October 2000 low of 6.8%.
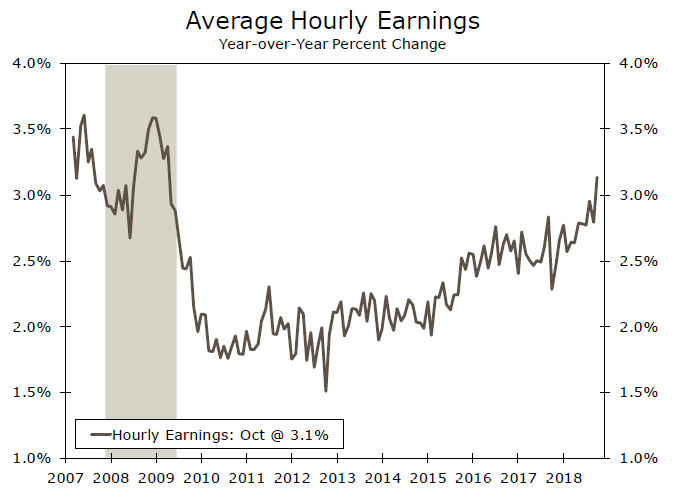
As also noted above, average hourly earnings rose by 0.2% in October. But due to some sizeable increases in recent months—earnings were up 0.4% in August and another 0.3% in September—the year-over-year increase in average hourly earnings rose to 3.1% in October. Although this rate of wage inflation remains short of the rates that were reached in the late stages of previous cycles, it represents the highest rate of wage inflation in this cycle.
Most analysts expect that the Federal Reserve will hike rates by another 25 bps at its December FOMC meeting, and today's strong labor market report reinforces that expectation. Looking forward, we look for employment growth to remain generally strong, which should cause the unemployment rate to recede even further. Consequently, we look for the Fed to continue raising rates at a gradual pace into next year.

Revisions Move Canada’s Trade Calance to Deficit
Canada posted a surprise -$0.42 billion trade deficit in September, defying expectations for a $0.2 billion surplus. This follows a revised -$0.55 billion deficit in August (previously reported as a $0.53 billion surplus).
The narrowing of the deficit in September was driven by declines in imports (-0.4%) outpacing those in exports (-0.2%), The move to a deficit is the result of a significant upward revision to August's imports, caused by the late reporting of three high-value ships (icebreakers from Sweden) that drove overall transportation sector imports up.
In real terms, the slumps were more pronounced, with import volumes falling 1.5% and export volumes declining 1.2%.
The decline in imports was mostly led by a drop in aircraft and other transportation equipment (-28.3%) due to a decrease in the imports of ships (noted above). Energy imports were also down 11.5% on the month, led by a decline in both crude oil imports (-13.2%) and refined petroleum products (-18.9%). Imports fell in five out of the 11 sectors.
Exports were mixed, with six out of the 11 sectors posting declines. The decline was mostly led by a pullback in consumer goods exports (-3.9%) which was mostly centered in food, beverage, and tobacco products (-5%). Energy exports provided somewhat of an offset, moving up 2.3% on the month, with a notable increase in refined petroleum energy products (10.6%).
Canada's merchandise trade surplus with the U.S. narrowed to $4.8 billion in September, as a imports (1.2%) increased more than exports (0.4%).
Key Implications
This was a disappointing print, boosted further by the significant revision to August's data. For the third quarter as a whole, import volumes were down 1.2%, whereas exports volumes also fell a less drastic 0.3%.This leaves our third quarter GDP tracking at 1.8%, just in line with the Bank of Canada's estimate. Nevertheless, the broad-based declines in both exports and imports confirms the slowing momentum narrative, both domestically and globally.
It is worth noting that the Bank of Canada upgraded the contribution of exports to overall growth in its latest Monetary Policy Report for 2018 and 2019 – a welcome development if realized and one which is likely still possible given strong performance in Q2. Going forward, strong U.S. export demand, greater trade certainty with USMCA, and a lagging Canadian dollar should support the export sector.
Steel and aluminum tariff negotiations are still ongoing, with Foreign Minister Freeland recently indicating that the negotiations are completely separate and independent from the USMCA agreement, albeit hinting that the agreement has provided "positive momentum." Any resolution to these tariffs should provide an added boost to positive sentiment generated by the removal of NAFTA uncertainty.
United States Employment Report Sheds Doubt on Growth Downturn
The expectations that we should prepare for a potential downturn in growth from the United States economy were nowhere to be seen in the latest employment report, with another impressive 250,000 jobs added during October.
This is another striking headline jobs reading out of the United States, that highlights to everyone once again the US divergence story, where the economic progress within the United States when compared to its developed counterparts is massive.
The employment report has narrowed some of the losses that the Dollar was carrying earlier during Friday trade, but the USD is still broadly lower against most of its counterparts following the promising reports of a potential breakthrough in United States-China trade talks.
Out of the 31 expanded majors on the Bloomberg Terminal at time of writing, only the Canadian Dollar, British Pound, Japanese Yen and Russian Ruble are lower against the Dollar today. The 0.15% weakness in the British Pound is probably related to the sudden surge in the Pound yesterday on Brexit hopes suffering from over-exhaustion, while the Yen is lower due to improved risk appetite in global stocks.
As we look ahead to the next trading week, investors must prepare for a potentially very busy one in the FX markets. Global markets will remain very sensitive to any new headlines over eased potential trade tensions, while investors also need to prepare and monitor possible risks with the US mid-term elections next week.
US NFP: Hiring Activity Rebounds in October, in an All-Around Positive Report
Hiring rebounded sharply in October, as U.S. non-farm payrolls added 250k new jobs. That comes off a modest 118k gain in September, which was held back by the impact of Hurricane Florence.
The unemployment rate held at its cycle low of 3.7%. The overall labor force participation rate actually moved up two ticks to 62.9%, but has remained broadly unchanged over the past year.
Turning to the industry detail, both goods and services sector hiring accelerated in October. Within services, strength was seen in health care (+36k), transportation and warehousing (+25k), and professional and business services (+35k). Hiring in leisure and hospitality (+42k) also bounced back in October after being held back Hurricane Florence ins September.
Meanwhile, strength in the goods-producing sector came in both manufacturing (+32k) and construction (+30k).
The closely watched measure of wage growth – average hourly earnings – rose 0.2% on the month. On a year-on-year basis, wages were up 3.2% – a new post-recession high.
Key Implications
This is an unambiguously positive report. Hiring bounced back from a hurricane-dampened September. The number of Americans with jobs relative to the population reached a new post-recession high. And, perhaps most notably, wages continue to make progress.
There is little doubt that the full employment half of the Fed's dual mandate is right on track. The October employment report is consistent with another rate hike in December.
It has long been the inflation side of the scale that has caused head scratching among FOMC members. Inflation is on target now, and the question is how much pressure is bubbling beneath the surface. So far there isn't a ton of evidence for a breakout in price pressures. That underpins our expectation that the Fed can continue its gradual pace of a hike a quarter over the next year.
EUR/USD Mid-Day Outlook
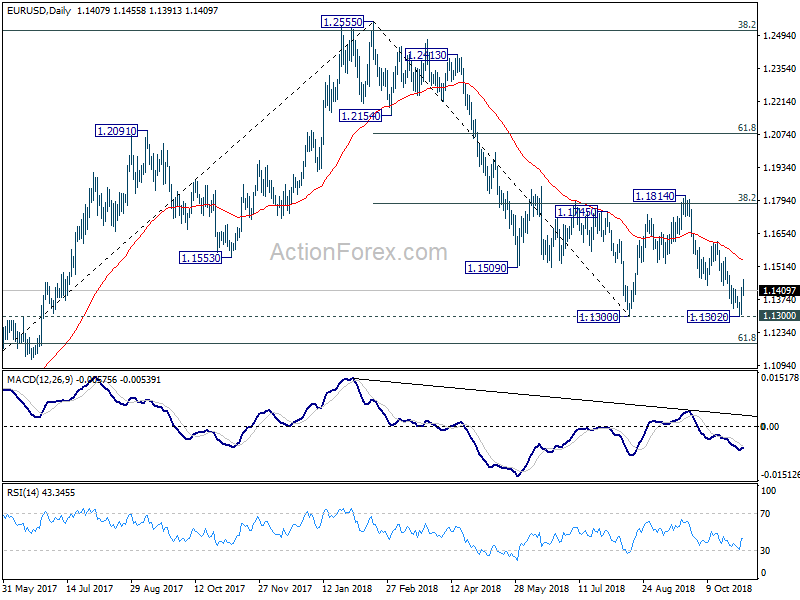
Daily Pivots: (S1) 1.1335; (P) 1.1379; (R1) 1.1455; More....
Intraday bias in EUR/USD remains on the upside as this point. Rise from 1.1302 is seen as the third leg of the consolidation pattern from 1.1300. Further rise would be seen to 1.1621 and above. But upside should be limited by 1.1814 to bring down trend resumption eventually. On the downside, break of 1.300 will resume whole down trend from 1.2555 and target 1.1186 fibonacci level next.
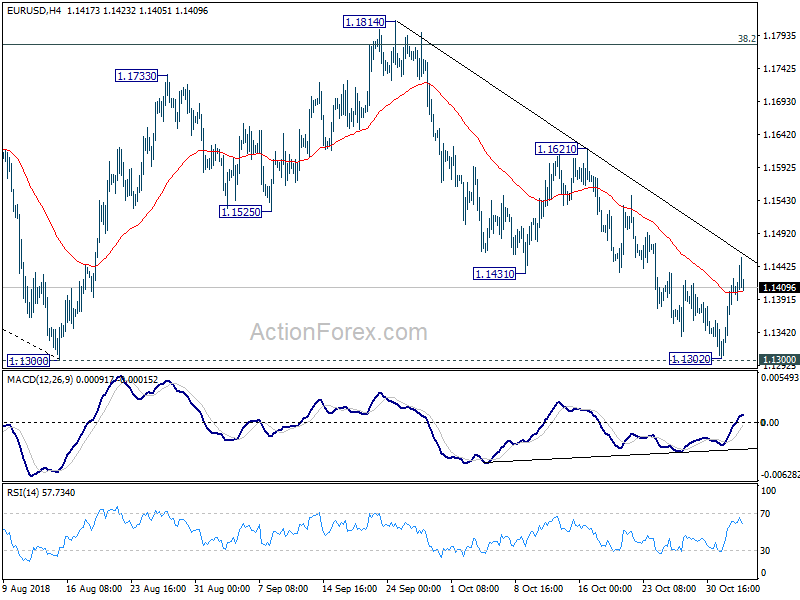
In the bigger picture, corrective pattern from 1.1300 could have completed at 1.1814 after hitting 38.2% retracement of 1.2555 to 1.1300 at 1.1779. Decisive break of 1.1300 will resume the down trend from 1.2555 to 61.8% retracement of 1.0339 (2017 low) to 1.2555 at 1.1186 next. Sustained break there will pave the way to retest 1.0339. On the upside, break of 1.1814 will delay the bearish case and extend the correction from 1.1300 with another rise before completion.